


INTRODUCTION
Organizations are ‘culture-bearing milieus’ (Louis, Reference Louis1985: 75). Organizational cultures are naturally formed through the continuous interactions of organization members. Pettigrew (Reference Pettigrew1979: 574) first defined organizational culture as ‘a system of publicly and collectively accepted meanings operating for a given group at a given time.’ Since then, there have been numerous studies on the concept and definitions of organizational culture, and it is generally agreed that organizational culture is to some degree a comprehensive lifestyle that is manifested in both tangible and intangible forms.
Organizations have not only their own unique culture but also various subcultures (Louis, Reference Louis1985; Van Mannen & Barley, Reference Van Mannen and Barley1985; Martin, Reference Martin1992; Trice, Reference Trice1993; Cameron & Quinn, Reference Cameron and Quinn2006; Schein, Reference Schein2010). Trice and Morand (Reference Trice and Morand1991) define a subculture as ‘distinct clusters of understandings, behaviors, and cultural forms that identify groups of people in the organization. They differ noticeably from the common organizational culture in which they are embedded, either intensifying its understanding and practices or deviating from them.’ Therefore, subcultures could exist in a group based on power in the organization, conflicts of interest between groups and differences in opinions (Martin, Reference Martin1992). Louis (Reference Louis1985: 79) also noted, ‘any group, for example the people who get together for bridge at lunch on Thursday, may develop a culture.’ Therefore, as all organizations continue to develop, they have the possibility of creating a subculture as time passes.
Highly educated professionals in research and development (R&D) organizations have their own characteristics, which form unique cultures and subcultures. To R&D organizations that employ highly educated professionals, subculture may be also a critically important factor in successful medium- to long-term performance. A study showed that different subcultures in two business units in an R&D organization could determine the success and failure of project goals (Müller, Krammergaard, & Mathiassen, Reference Müller, Krammergaard and Mathiassen2009). Hence, as a critical factor that has a strong influence on R&D performance, subcultures should be constantly coordinated and changed appropriately (Cameron & Quinn, Reference Cameron and Quinn2006; Schein, Reference Schein2010) to conduct successful R&D and to secure a medium- to long-term competitive advantage.
Because characteristics of members and groups differ, many types of subculture in R&D organizations may exist. Research (e.g., Asmawi & Mohan, Reference Asmawi and Mohan2011) has identified dimensions such as teamwork and knowledge sharing, empowerment and recognition, conformity and impediments to R&D, risk taking, customer orientation, autonomy, social networking, and organizational design that can affect the formulation of cultures in R&D organizations. However, as it is very difficult to manage all the possible dimensions that comprise culture in an R&D organization, it is necessary to identify the most important dimensions to categorize the subculture, considering the characteristics of the members, the departments, and the managerial purpose of identifying the subculture of the organization, to obtain optimal or improved performance from its members and departments.
As we have an interest in subculture and the performance of R&D professionals who work in a professional organization, we have decided to focus on autonomy and group cohesion of R&D professionals. Autonomy is an important cultural factor in R&D organizations (Asmawi & Mohan, Reference Asmawi and Mohan2011: 518–519) and is one of the ideal characteristics of professionals (Kerr, Von Glinow, & Schriesheim, Reference Kerr, Von Glinow and Schriesheim1977). R&D professionals tend to be autonomous and self-motivated, which means that they are perceived to have a high degree of control over their own affairs (Yeh, Reference Yeh1996). As professional autonomy is often described as being claimed by professionals who primarily serve their own interests, the degree of autonomy may lead to different subcultures and can harm or help the performance of the organization to which they belong (Yeh, Reference Yeh1996; Asmawi & Mohan, Reference Asmawi and Mohan2011).
Group cohesion can be defined as overall social integration, as well as an individual’s perceived attraction to the group and satisfaction with other members (Huang, Reference Huang2009: 789). Asmawi & Mohan (Reference Asmawi and Mohan2011) pointed out that collaboration and interaction are very important characteristics of R&D organizations’ activities and environments. In addition, R&D professionals may be affected by the characteristics of the department to which they belong, because of group cohesion. In addition, several studies have shown that group cohesion is directly or indirectly associated with R&D performance (Sheldon, Reference Sheldon1971; Aronson & Lechler, Reference Aronson and Lechler2009; Huang, Reference Huang2009).
The purpose of this paper is to identify the existence of subcultures and to explore their effect on the performance of R&D professionals in a professional organization. For that purpose, this paper first explores the locus of the subcultureFootnote 1 of a professional R&D organization to find subcultures within it, by focusing on whether there exist cultural differences between R&D areas as well as between research types (applied and developmental research). In exploring the loci of subcultures in an R&D organization, Mary Douglas’s grid–group theory was adopted to categorize types of subculture because this theory best informs our interest in subculture and the performance of R&D professions.
The grid–group theory, a conceptual framework describing social interaction, consists of two dimensions based on autonomy and group cohesion mentioned above: the ‘grid dimension’ (‘dimension of individuation’) and the ‘group dimension’ (‘dimension of social incorporation’) (Douglas, Reference Douglas1982). Because R&D activities essentially require the co-operation of professionals in various experiments, tests, and analyses, which leads to various levels of social interaction (Aronson & Lechler, Reference Aronson and Lechler2009; Asmawi & Mohan, Reference Asmawi and Mohan2011), the grid–group theory may be considered to be an effective way to categorize and describe the various subcultures of an R&D organization. Guzman et al. (Reference Guzman, Stanton, Stam, Vijayasri, Yamodo, Zakaria and Caldera2004) and Romi (Reference Romi2014) used grid–group theory to analyze the occupational subculture IT specialists.
After exploring the existence of subculture based on grid–group theory, we examine the impact of subculture on the job satisfaction of individual researchers. Job satisfaction in particular is chosen because many studies have shown that job satisfaction positively affects employee turn-over, intent and desire to remain, and is likely to influence other areas of organizational performance (Mowday, Porter, & Dubin, Reference Mowday, Porter and Dubin1974; Porter, Steers, Mowday, & Boulian, Reference Porter, Steers, Mowday and Boulian1974; Cheng, Lai, & Wu, Reference Cheng, Lai and Wu2010). In addition, it is difficult to obtain objective measures of performance in a professional organization; therefore, job satisfaction, as a desirable factor, could be an effective proxy for such measures.
Highly educated professional R&D organizations may distinguish themselves from other groups by conducting knowledge-intensive and highly creative processes (Asmawi & Mohan, Reference Asmawi and Mohan2011). They value autonomy and self-achievement (Yeh, Reference Yeh1996), seeking advanced professional knowledge and identification with fellow professionals (Kerr, Von Glinow, & Schriesheim, Reference Kerr, Von Glinow and Schriesheim1977). Therefore, there inevitably exists a certain cultural type that professionals prefer because of their occupational context. Consequently, it is very important to examine which type of culture can produce the best performance. The Electronics and Telecommunications Research Institute (ETRI), an international non-profit R&D institute in Korea that covers all fields of Information and Communication Technology, was chosen as the sample organization for the study.
This paper consists of five sections. After reviewing related studies in the second section, the third section outlines our research methodologies and data. The fourth section reports the results of the empirical analysis, followed by a discussion and some concluding remarks in the fifth section.
LITERATURE REVIEW AND HYPOTHESES
Organizational culture and subculture
Organizational culture, actively researched since the early 1980s by organizational scholars, is recognized as one of the most powerful factors and key ingredients in the performance and long-term effectiveness of organizations (Cameron & Quinn, Reference Cameron and Quinn2006). Over time, an organization naturally forms subcultures in addition to one overall culture. There are various reasons that a subculture may arise, from age, gender, race, or geographical decentralization to segmentation by division, particular job type, hierarchical level, differentiation by function, occupation, ideology (e.g., the nature of the work), product, market, industry, technological innovation, or the choice of appropriate techniques (Louis, Reference Louis1985; Van Mannen & Barley, Reference Van Mannen and Barley1985; Schein, Reference Schein2010).
Many studies have proven that subcultures have a close relationship with organizational learning (Schein, Reference Schein1996), conflict over technological innovation (von Meier, Reference von Meier1999), organizational commitment (Lok, Westwood, & Crawford, Reference Lok, Westwood and Crawford2005), and consumer behavior (Li, Zhang, & Cai, Reference Li, Zhang and Cai2013). Furthermore, disharmony in subcultures can damage the effectiveness of the organization, leading to disruption of the achievements of the organization’s goals and its collapse from within as a result of conflict (Trice & Beyer, Reference Trice and Beyer1993; Hofstede, Reference Hofstede1998; Cameron & Quinn, Reference Cameron and Quinn2006; Schein, Reference Schein2010). Therefore, diagnosing each subculture composing overall organizational culture, and aligning and coordinating them to pursue a shared organizational goal could be regarded as an essential management activity for improving employees’ performance (Cameron & Quinn, Reference Cameron and Quinn2006; Schein, Reference Schein2010).
Organizational culture with respect to grid–group theory
Grid–group theory was developed by Mary Douglas and was continually refined by both Wildavsky (Reference Wildavsky1987) and Thompson, Ellis, and Wildavsky (Reference Thompson, Ellis and Wildavsky1990). Douglas explains that individuals are placed within a social context, with the two dimensions of ‘grid’ and ‘group’Footnote 2 . The grid dimension refers to the ‘dimension of individuation’ (i.e., autonomy or the degree of individual freedom), while the group dimension refers to the ‘dimension of social incorporation’ (i.e., group cohesion or the degree of social boundedness; Douglas, Reference Douglas1982; Boholm, Reference Boholm1996; Grendstad, Reference Grendstad1999; Chai, Liu, & Kim, Reference Chai, Liu and Kim2009). That is, the group dimension relates to the problem of interacting with other individuals and the strength of the collective, whose decisions strongly bind members’ individual determinations – the degree of solidarity, cohesiveness, and conformity to expectations among those of a similar ideology. In contrast, the grid dimension relates to the extent to which an individual is constrained by formal rules and regulations, as well as hierarchical authority, in his or her social life (Wildavsky, Reference Wildavsky1987). When the grid is strong, there are clear, strictly applied rules and regulations for the roles and positions of individuals, who must follow explicit guidelines regarding behavior. On the other hand, when the grid is weak, formal classification weakens; individuals can more freely negotiate, compete and transact, but their places and roles are poorly defined (Douglas, Reference Douglas1982; Thompson, Ellis, & Wildavsky, Reference Thompson, Ellis and Wildavsky1990; Trice, Reference Trice1993).
According to Thompson, Ellis and Wildavsky (Reference Thompson, Ellis and Wildavsky1990) and Grendstad (Reference Grendstad1999), combinations of grid and group dimensions could yield four different types of culture: hierarchy, egalitarianism, individualism, and fatalism, as shown in Figure 1. A hierarchical culture has strong group and grid dimensions. Individuals in a hierarchical culture are controlled by other members and confined by socially imposed roles. Cultural attributes include trust in rules and regulations, approval of the hierarchical structure and centralized decision-making, acceptance of the control of authorities for maintaining order, and emphasis on social goals and order. In other words, the culture possesses various means of mediation and control for settling social conflicts. Members of such a culture also have a strong identity and satisfy their desires through the group, which increases their dependence on it. Therefore, a hierarchical culture can improve the performance of an organization through strong leadership with expertise, rational and specialized processes, and rule- and regulation-based systems. Conversely, weak leadership with weak expertise and a lack of precise rules and regulations can cause disorder in organizational management. To overcome such problems, improvements in expertise and a focus on delicate rules and regulations are required (Hood, Reference Hood1998: 25–26). In other words, more developed processes and rules, and delegated authority with strong expertise, may develop stable motivation and performance.
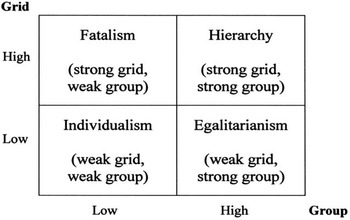
Figure 1 Four cultural types in grid–group theory Source: Thompson, Ellis, & Wildavsky, Reference Thompson, Ellis and Wildavsky1990; Grendstad, Reference Grendstad1999.
An individualistic culture consists of weak grid and group dimensions, and regards self-regulation as the ideal means of control. In this type of culture, people do not receive external regulation, and there is no binding force imposed on them; therefore, all relations are decided through the free negotiation of individuals. An individualistic culture is a weak group culture, meaning that group borders are temporary and frequently moved through exchanges, deals, and compromises between individuals and groups. Social punishments and culture-based controls are relatively weak, meaning that individuals can regulate their relationships freely and independently. Therefore, an individualistic culture can improve the performance of an organization by providing an environment in which individuals have equal opportunities and can compete freely.
An egalitarian culture consists of a weak grid and a strong group. Members are strongly committed to their group, but at the same time, the relations between members are equal, and they possess no authoritarian attitude. Only the external border of this group is clear, but the positions of the members within it lack official classifications or discrimination. Furthermore, because the hierarchy that allows authority to be exerted within the group is not fixed, negotiation is preferred as a decision-making method.
Finally, a fatalistic culture consists of a strong grid and a weak group; individuals have no autonomy and a weak identity within the group. A fatalistic culture is characterized by unpredictability of events: dependence on luck and feelings of helplessness, ineffectiveness, and distrust. Because individuals’ preferences within a culture change according to situations such as who leads them and what benefits are provided, it is difficult to find consistency in this type of culture (Schwarz & Thompson, Reference Schwarz and Thompson1990; Trice, Reference Trice1993; Grendstad, Reference Grendstad1999).
Subcultures of R&D professionals
In regard to grid–group theory, combination of different degree of grid dimension and group dimension produce different cultural types as time passes. R&D professionals in an organization may perceive different levels of freedom (grid dimension) and group cohesion (group dimension) according to factors such as leadership style, research characteristics, personal traits, organizational historical background, and educational background. These different levels of freedom and group cohesion may produce different cultural types in an organization. Hypothesis 1 follows from the arguments above:
Hypothesis 1: For R&D professionals, different subcultures measured by grid–group dimensions exist in an organization.
In an R&D organization of a certain size that conducts multiple studies in various fields, different subcultures may be present across fields or types of research. Bloor and Dawson (Reference Bloor and Dawson1994) commented that professionals enter an organization with cultural knowledge obtained from their schools and societies, leading to the formation of a subculture through experiences shared with the members of other societies that mesh with the existing culture of the organization. For instance, Gregory (Reference Gregory1983) interviewed 75 technical professionals working in computer companies in Silicon Valley and found that subcultures exist within ‘hardware engineering,’ ‘software engineering,’ ‘computer programming,’ ‘marketing,’ ‘technical documentation,’ and other fields. Regarding the existence of subcultures across research fields, a subordinate organizational culture is likely to be formed in similar research fields by people of similar educational backgrounds with a need for collaboration. Schein (Reference Schein2010) had a similar view, believing that professionals form a subculture by sharing work experiences and professional beliefs that have been formed according to their educational background. He argued that ‘if there is strong socialization during the education and training period, and if the beliefs and values learned during this time remain stable as taken-for-granted assumptions even though the person may not be in a group of occupational peers, then clearly those occupations have cultures’ (Schein, Reference Schein2010: 21). Sometimes, newcomers with educational backgrounds similar to those of existing members learn esoteric knowledge in their work, strengthening their group identity (Trice, Reference Trice1993), which also leads to the formation of a subculture. Based on these arguments, the following hypothesis is proposed:
Hypothesis 1a: Subcultures of R&D professionals vary according to their research field in an R&D organization.
Subculture types are influenced by forms of interaction between researchers. Furthermore, these interactions may be influenced by different types of individual research. Vollmer (Reference Vollmer1972) analyzed 3,600 scientists working in colleges or institutes in the United States from professional society membership lists and found numerous differences in their career paths, research attitudes, and activities depending on the types of their research (i.e., basic or applied). Vollmer (Reference Vollmer1972) found that scientists who conduct basic research have a tendency to work alone without supervision by their bosses, and those who conduct mixed or applied research have a tendency to co-operate with other scientists in the same or other fields and to consult their bosses.
Vollmer’s research may be applied to the grid–group theory, whereby culture types depend on forms of interaction, which in turn are influenced by types of research. In other words, R&D professionals have a variety of social interactions (autonomy, group cohesion) depending on their type of research (basic, applied, and developmental) as proven by Vollmer’s research (Vollmer (Reference Vollmer1972: 67))Footnote 3 , which may result in a variety of culture types as a combination of two culture-making dimensions: autonomy and group cohesion. Van Mannen and Barley (Reference Van Mannen and Barley1985: 37) commented that the ‘differential interaction among an organization’s membership may reflect physical proximity, the sharing of common tasks or status, dependencies in the workflow, demand made by some members on others, and even accidents of history.’
Along with these arguments, it is hypothesized that members of an R&D organization covering basic, applied, and developmental research would have different social interactions according to their research type, leading to the formation of different subcultures:
Hypothesis 1b: For R&D professionals, subcultures differ according to type of research (applied and developmental).
Organizational culture has a strong effect on organizational effectiveness and performance (Denison, Reference Denison1990; Kotter & Heskett, Reference Kotter and Heskett1992; Cameron & Quinn, Reference Cameron and Quinn2006). Job satisfaction, which is defined as a pleasurable or positive emotional state resulting from the appraisal or experience of one’s job (Locke, Reference Locke1976), is a desirable factor in pursuing the research objectives in an R&D organization. Job satisfaction positively affects employee turn-over, intent and desire to remain, and is likely to influence organizational performance (Mowday, Porter, & Dubin, Reference Mowday, Porter and Dubin1974; Porter et al., Reference Porter, Steers, Mowday and Boulian1974; Cheng, Lai, & Wu, Reference Cheng, Lai and Wu2010). Because a high turnover rate of skilled R&D professionals could hinder the successful pursuit of an R&D goal, job satisfaction could be related to long-term R&D performance either directly or indirectlyFootnote 4 .
Degree of freedom and group cohesion in an organization must influence the job satisfaction of R&D professionals. Chang & Cheng (Reference Chang and Cheng2014) argued that a high degree of job autonomy for R&D professionals leads to job satisfaction. Huang (Reference Huang2009) asserted that group cohesion creates consensus among R&D employees and reduces conflict in R&D processes. Cheng, Lai, and Wu (Reference Cheng, Lai and Wu2010) commented that employee conflict reduces R&D employees’ job satisfaction, because these professionals prefer an environment where they are free to study and co-operate with colleagues with similar expertise, without rules, regulations, or authority. For example, Kerr, Von Glinow, and Schriesheim (Reference Kerr, Von Glinow and Schriesheim1977) suggested that expertise, autonomy, commitment to work, identification with profession and fellow professionals, ethics, and collegial maintenance of standards are the characteristics of ideal professionals.
In addition, there may be other variables that have an impact on the job satisfaction of R&D professionals. For example, Sabharwal (Reference Sabharwal2011), analyzing the job satisfaction pattern of scientists and engineers, commented that tenure is a powerful explanatory variable in measuring faculty job satisfaction. This is because faculty tenure is awarded when a professor’s performance has been excellent for a long time. In a research institute such as ETRI, the length of service (work experience) may be regarded as a good proxy for tenure. Thus, in this paper, job satisfaction was measured by controlling for the effect of length of service on job satisfaction.
If there are any differences in the subculture of grid and group, they could have an impact on the performance of a researcher and could be moderated by length of service. Another hypothesis is suggested, as follows:
Hypothesis 2: For R&D professionals, job satisfaction differs according to type of subculture.
METHOD
Sample
The sample for this study was from ETRI, an international IT institute in South Korea. Because organizational culture is the ‘a product of social learning’ (Schein, Reference Schein2010: 17), 285 full-time researchers who had worked at ETRI for more than 5 years were surveyed to identify the organizational culture. Data were collected using a self-administered survey consisting of paper-and-pencil questionnairesFootnote 5 .
ETRI has six engineering research laboratories, and its 1,700 full-time researchers all have master’s degrees or higher qualifications; half of them have doctorates. ETRI is a leading research institute that has contributed greatly to the IT development of South Korea, mostly by contracting with government agencies for periods of three to 5 years. Currently, it generally conducts applied and developmental research projects, and all researchers work on more than one project.
For this study, four of the six engineering laboratories were selected on the basis of research fields, history and size, and a proportionate quota method was used. The four laboratories were the Software Research Laboratory, Network Research Laboratory, Components and Materials Research Laboratory, and Content Research LaboratoryFootnote 6 . The Software Research Laboratory and Network Research Laboratory generally conduct developmental research, whereas the Components and Materials Research Laboratory and the Content Research Laboratory typically engage in applied research projects.
The Software Research Laboratory has developed embedded software and technologies for speech and language information, low-cost cloud computing infrastructure, creative computing, and knowledge-based information security and safety. Data were collected from 82 researchers. Approximately 61% of the members reported that their research type was developmental. The Network Research Laboratory aims to improve communication services through wired and wireless communication networks, focusing on developing IT systems through a combination of hardware and software. Data were collected from 94 researchers, 67% of whom were found to be working on development projects.
The Components and Materials Laboratory mainly conducts research on hardware, focusing on IC equipment, such as designing semiconductors, to improve information and communication services and systems. Data were gathered from 68 researchers, 67.6% of whom were reported to be engaged in applied research. Finally, the Content Research Laboratory conducts research on software- and computer-related services such as those in the motion picture, gaming, and education industries. Data were collected from 41 researchers, ∼61.0% of whom were reported to be engaged in applied research.
Measures
Although some studies have used questionnaires adapted from grid–group theory (Hampton, Reference Hampton1982; Boyle & Coughlin, Reference Boyle and Coughlin1994; Coughlin & Lockhart, Reference Coughlin and Lockhart1998; Grendstad & Selle, Reference Grendstad and Selle1999), their application has varied considerably. While some dealt with political or social issues, others used questions that were too general, making it difficult to provide a sufficiently specific analysis of the culture of an R&D organization. In this paper, a questionnaire by Boyle & Coughlin (Reference Boyle and Coughlin1994) and the pedagogy-related questionnaire of Chastain (Reference Chastain2005) were modified to suit R&D professionals, because those questionnaires, based on grid–group theory, focus specifically on organizational situations and activities rather than abstract political or social issues. Items were measured on a 5-point Likert scale, and the questionnaire is presented in Appendix B. In addition, job satisfaction was measured by the Minnesota Satisfaction Questionnaire drawn from the study by Weiss, Dawis, England, and Lofquist (Reference Weiss, Dawis, England and Lofquist1967)Footnote 7 . Minnesota Satisfaction Questionnaire is widely used for measuring job satisfaction (Rehman, Mahmood, Salleh, & Amin, Reference Rehman, Mahmood, Salleh and Amin2014).
To verify the internal consistency of the grid and group dimensions, Cronbach’s α coefficients were calculated (Cronbach, Reference Cronbach1951)Footnote 8 . The α coefficients for the grid and group items were 0.75 and 0.70, respectively, which confirms the reliability of the items. In addition, to verify the validity of the questionnaire, a confirmatory factor analysis with varimax rotation was conducted (Kaiser, Reference Kaiser1958). However, the factor loadings of two of the grid items (Grids 7 and 8) and three of the group items (Groups 1, 7, and 8) were noticeably lower than those of the other items and were therefore excluded. The factor loadings of the remaining six items in the grid dimension and the remaining five items in the group dimension were greater than 0.5, as shown in Table 1 and Table 2, indicating sufficient validity. Therefore, these items are judged to measure the grid and group dimensions in the subjects appropriately.
Table 1 The means, SDs, factor loadings, and cronbach’s α coefficients of the grid dimension items

Note. n=285; Kaiser–Meyer–Olkin: 0.75; eigenvalue: 5.02; variance explained: 62.76%.
Table 2 The means, SDs, factor loadings, and cronbach’s α coefficients of the group dimension items

Note. n=285; Kaiser–Meyer–Olkin: 0.71; eigenvalue: 3.25; variance explained: 64.92%.
RESULTS
Different subcultures according to grid–group dimensions exist in an organization (Hypothesis 1)
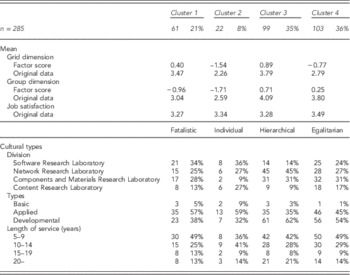
Cluster analysis involves ‘dividing a large group into smaller ones so that the observations within each group are relatively similar and the observations in different groups are relatively dissimilar’ (Lattin, Carroll, & Green, Reference Lattin, Carroll and Green2003: 264). Cluster analysis was employed to classify researchers into mutually exclusive groups on the basis of the ward method, using the K-means clustering procedure after confirming the number of researchers’ groups through a dendrogram from hierarchical cluster analysis. The cluster analysis categorizes 285 researchers into four clusters with 61, 22, 99, and 103 researchers, as shown in Table 3. Additionally, an ANOVA (analysis of variance) test for the difference between means of the clusters proved to be statistically significant. Interestingly, the four clusters that were derived are categorized into four types of culture according to grid–group theory: fatalistic, individual, hierarchical, and egalitarian. This was established by the mean values for the grid and group dimensions of each cluster. This result shows that there are four groups of R&D professionals who perceive the subculture differently in a professional organization, which is consistent with Hypothesis 1: different subcultures measured by grid–group dimensions exist in an organization.
Table 3 Cluster analysis results and descriptive statistics of the four clusters
Subcultures differ according to research field (Hypothesis 1a)
It is very difficult to define ‘research field’ uniformly, especially in R&D, because the higher the educational level of the researchers, the more specialized and varied their research tends to be. Nevertheless, the four ETRI laboratories could be regarded as distinct fields within which researchers work, allowing us to examine whether there are differences in the subcultures.
The descriptive statistics for the items constituting each grid and group dimension are shown in Table 4. The total mean of the grid dimension items for the four groups was 3.24, while that of the group dimension items was 3.64. Because the grid and group dimensions were measured using a 5-point Likert scale questionnaire with a score of three placed in the center, the total mean values for the grid and group dimensions, both of which are greater than 3.0, imply that the dimensions reflect a hierarchical culture.
Table 4 Descriptive statistics of the items in the grid, and group dimensions of the four groups

While the organization has an overall hierarchical culture, there would also be distinct subcultures within it. To investigate the existence of these subcultures empirically, the differences in the mean values of the grid and group dimensions of the four laboratories were analyzed. The mean values were estimated based on factor scores, calculated by multiplying the standardized score of the original variable by the factor score coefficients, which represent the cause-and-effect relationship between the original observations and factors. Because the mean value of the factor score is 0, and the distribution is standardized to 1 (Lattin, Carroll, & Green, Reference Lattin, Carroll and Green2003), the values of the grid and group dimensions can be placed in a quadrant centered at 0.
An ANOVA was conducted to see whether there exist any statistically significant differences between the means of the factor scores for each of the four laboratories. As shown in Table 5, the results of the ANOVA reveal that the grid dimension was significantly different (F=5.86, p<.05). The group dimension had a meaningful difference (F=2.55, p<.1). Even if the p-value=.06, slightly over the critical value p-value of .05, it is at least over the minimum standard for accepting the hypothesis, considering that this result is from R&D professionals within one organization. In addition, least significant difference tests, a post hoc test in ANOVA, by each grid dimension and group dimension were conducted, and the results showed differences among more than two groups as shown in Table 6. Therefore, Hypothesis 1a is acceptedFootnote 9 . One interesting finding is that in both the grid and group dimensions, while the Software Research Laboratory and Network Research Laboratory had positive mean factor scores, the Components and Materials Research Laboratory and Content Research Laboratory had negative mean factor scores. A positive factor score indicates that the value exceeds the total mean, and a negative factor score indicates the opposite. Thus, the Software Research Laboratory and Network Research Laboratory had stronger grid and group dimensions than the other two laboratories of the Components and Materials Research Laboratory and Content Research Laboratory. Because the mean factor scores of the grid and group dimensions of each laboratory are in a quadrant centered at 0, the Software Research Laboratory and Network Research Laboratory were diagonally opposite the Components and Materials Research Laboratory and the Content Research Laboratory. This indicates that the Software Research Laboratory and Network Research Laboratory had comparatively hierarchical subcultures, while the Components and Materials Research Laboratory and Content Research Laboratory had comparatively individualistic subcultures.
Table 5 ANOVA results, means, and SDs of the factor scores of the four groups by each grid and group dimension

Note. The variances of the four groups were confirmed using Levene’s test for equality of variances.
Table 6 The least significant difference (LSD) test results (a post hoc test in ANOVA) of the four groups by each grid and group dimension

a The mean difference is significant at the .01 level.
b The mean difference is significant at the .05 level.
c The mean difference is significant at the .1 level.
One important implication of this finding is that the laboratories of an R&D organization conducting research in a variety of fields could have different subcultures depending on their field.
Subcultures differ according to research type (Hypothesis 1b)
When researchers at ETRI were classified into applied and developmental research categories to investigate whether there were subcultures that depended on research type, nine participants were found in the basic research category, 129 in the applied research category, and 147 in the developmental research category. Because the number of participants in the basic research category was too small, that category was excluded from the analysis. Therefore, the factor scores of the individuals in applied and developmental research categories were used to test Hypothesis 1b. The mean values and standard deviations for the grid and group dimensions in each category were calculated in the same way as for Hypothesis 1a. A t-test was used to examine whether there were statistically significant differences in the average values of these categories. Any significant difference would indicate the presence of subcultures caused by the different types of individual research.
Table 7 shows the results of the t-test. There are statistically significant differences between applied and developmental categories in both the grid and group dimensions. These results, which support Hypothesis 1b, indicate that different kinds of subculture, such as grid and group, could emerge based on different types of individual research. Furthermore, in both the grid and group dimensions, the applied research category had a negative mean value, and the developmental research category had a positive one. This means that the applied category had weak grid and group dimensions, whereas the developmental category had strong grid and group dimensions, indicating that the applied research category had an individualistic subculture and the developmental research category had a hierarchical subculture.
Table 7 T-test results, means, and SDs of the factor scores of the research types by each grid and group dimension

Note. The variances of the four groups were confirmed using Levene’s test for equality of variances.
Job satisfaction differs according to subculture (Hypothesis 2)
An ANCOVA (analysis of covariance) was employed to check the statistical significance of difference between means of clusters with the covariate variable, length of service, to control for its influence on job satisfaction. The result (Table 8) shows that job satisfaction differs significantly between clusters (F=4.89, p<.05), even though the control variable, length of service, has a significant effect on job satisfaction. When the mean value of job satisfaction of the four clusters is compared, that of cluster 4 (egalitarianism) is higher than that of any other clusters. This result implies that the grid dimension negatively affects the job satisfaction of R&D professionals, and the group dimension positively affects job satisfaction. In other words, the subculture of weak grid and strong group, where members are strongly committed to their group, when their relations are equal and there is no authoritarian attitude, could be the best combination of subcultures in the case of a highly professional R&D organization like ETRI. This implies that the researchers in other clusters could be motivated if they were treated in the same ways as researchers in cluster 4.
Table 8 ANCOVA results, means, and SDs of the four clusters including the control variable of length of service

DISCUSSION AND CONCLUSION
This study investigates the existence and impact of subculture of an R&D organization by applying Douglas’s grid–group theory, which is based on social relationships and interaction. Sample data were obtained from 285 full-time researchers with master’s degrees or higher qualifications who had worked for more than 5 years at ETRI, a government-supported IT institute in Korea.
Empirical findings on the existence of subcultures suggest that while ETRI has an overall hierarchical organizational culture, two types of subculture coexist depending on research fields as well as research types. More specifically, in the case of research fields, the Software Research Laboratory and the Network Research Laboratory have hierarchical subcultures, while the Components and Materials Research Laboratory and the Content Research Laboratory have individualistic subcultures. In addition, in the case of research types, the applied research category has an individualistic subculture, while the developmental research category has a hierarchical subculture.
These subcultures could exist because the research field and research types require different tasks and goals, and naturally, they have different ways of control and styles of working with others. These tasks and ways of control place different demands on the researchers and influence their orientation towards, commitments to and co-operation with colleagues. This may explain why different research fields and types have dissimilar subcultures.
These findings are meaningful because they offer important implications for successful R&D management. That is, subcultures may have a positive impact on an organization when they are connected with successful management policies for better research performance. However, when they are not, they could negatively affect learning, innovation, and communication in the organization (Schein, Reference Schein1996; Hofstede, Reference Hofstede1998; von Meier, Reference von Meier1999; Lok, Westwood & Crawford, Reference Lok, Westwood and Crawford2005; Müller, Krammergaard, & Mathiassen, Reference Müller, Krammergaard and Mathiassen2009).
When the impacts of subcultures on job satisfaction are examined, the best alternative is shown to be a combination of a weak grid and a strong group, egalitarianism. This result implies that R&D professionals may not work in organizational cultures regardless of their preference. Therefore, management skill and policy are necessary to change the culture to one of egalitarianism. For example, the Software Research Laboratory and the Network Research Laboratory, which require heavy investment and close working relationships to accomplish a well-planned and central goal, would be better off allowing their researchers to take more flexible approaches to work and allowing greater scope for independent thought by individuals to improve job satisfaction. On the other hand, the Components and Materials Research Laboratory and the Content Research Laboratory, which require creativity and allow their researchers to work independently, would be better off encouraging more group cohesiveness to improve job satisfaction. Similarly, the researchers engaged in the developmental research category may be motivated by being given more flexibility, while those in the applied category may be motivated by emphasizing group cohesiveness. Thus, R&D organizations may utilize the existence of subcultures, which may arise depending on fields and types of research, to develop different policies to enhance their organizational effectiveness such as job satisfaction.
One of the important policy implications of this study is that an organization should identify subcultures and monitor their effects on the outcomes of research fields and types, since ‘the performance outcomes reflect the extent to which an organization is able to develop a coherent and cohesive fit between its sector, strategy, culture and human resource management practices (Dreher & Dougherty, Reference Dreher and Dougherty2002)’ (Edgar, Gray, Browning & Dwyer, Reference Edgar, Gray, Browning and Dwyer2014: 73). To be more precise, subcultures should be understood at the level of each research field and type so that management policies and practices can be prepared to achieve desirable subcultures at that level.
There are some limitations to this study. First, only one R&D organization was examined, which greatly reduces the generalizability of the results. Thus, future research could include numerous R&D organizations to allow conclusions that are more generalizable and solid to be drawn. Second, because of the difficulties of defining and sampling, this paper regarded the professionals’ research fields as divisions of an R&D organization that are not independently separated from research types. This could cause overlap among participants. Although the hypotheses are derived from different perspectives of the research, the interpretation of the empirical results regarding research field and type could be related. Finally, the overall cultures and subcultures of R&D professionals may be more complex than those suggested in this paper. Therefore, more loci may exist and their relationships with R&D performance warrant further study.
Acknowledgements
We sincerely thank all the ETRI researchers who assisted with the survey. This work was partly supported by the ICT R&D program of MSIP/IITP [2013-005-002-003, Research on Spectrum and Future Policy] and National Research Foundation of Korea (NRF) grant funded by the Korean Government (NRF-2013S1A3A2043357).
Financial Support
None.
Conflicts of Interest
None.
Appendix A: Demographic data of the respondents

Appendix B: Questionnaire for measuring grid and group dimensions
Grid dimension
By myself By those in authority, administrators, rules
(1) (2) (3) (4) (5)
1. The direction of research in an R&D project is established _______________.
2. The goals and methods of working on an R&D project are established _______________.
3. The scope of the research in an R&D project is determined ____________ through negotiation with others.
4. Personnel, space and equipment are allotted ____________ through transactions with others.
5. Individual R&D projects are assigned _______________ through competition with others.
6. Decisions about work and daily activities are controlled by ______________.
7. As long as I follow the rules in my company, things will be okay: No ↔ Yes.
8. The authority structures in my company are centralized: No ↔ Yes.
Group dimension
Individuals/An individual/Individually Groups/A group/Collectively
(1) (2) (3) (4) (5)
1. The rewards of an R&D project are given to ______________.
2. R&D projects typically have goals that are planned _______________.
3. Performance of an R&D project is generally the result of ____________efforts.
4. Researchers work towards R&D project goals as_______________.
5. R&D resources (people, budgets, equipment, etc.) are ____________ managed.
6. The success of an R&D project depends on____________.
7. I want to stay with my company because of the warm and friendly relationships I have with my colleagues: No ↔ Yes.
8. I have a job where the people I work with get together socially away from the job: No ↔ Yes.


