

Introduction
Conservation of birds has become a global environmental issue, particularly with increases in environmental degradation, habitat loss, invasive species and effects of climate change threatening extinction of many species (Robbins et al. Reference Robbins, Sauer, Greenberg and Droege1989, Balmford et al. Reference Balmford, More, Brook, Burgess, Hansen, Williams and Rahbek2001, Crick Reference Crick2004, Butchart et al. Reference Butchart, Walpole, Collen, Van Strien, Scharlemann, Almond, Baillie, Bomhard, Brown, Bruno and Carpenter2010). Birds are recognised as important and reliable indicators of terrestrial biodiversity, environmental conditions, and habitat quality (Bibby Reference Bibby1999, Canterbury et al. Reference Canterbury, Martin, Petit, Petit and Bradford2000), due to their well-documented ecology (being one of the best known faunal groups in the tropics, e.g. Stotz et al. Reference Stotz, Fitzpatrick, Parker and Moskovits1996, Dunn Reference Dunn2004, Hill and Hamer Reference Hill and Hamer2004, BirdLife International 2005), and because they are one of the most vulnerable vertebrate taxa to forest disturbance (e.g. Aleixo Reference Aleixo1999, Johns Reference Johns1991, Mason Reference Mason1996, Thiollay Reference Thiollay1992, Wong Reference Wong, Diamond and Lovejoy1985). In addition, birds (particularly habitat specialist birds) are also known to be suffering population declines around the globe (Butchart et al. Reference Butchart, Walpole, Collen, Van Strien, Scharlemann, Almond, Baillie, Bomhard, Brown, Bruno and Carpenter2010) as a result of habitat loss and climate change. While generalist and invasive bird species may expand their ranges, specialist species are more likely to die off, if local climate changes unfavourably or if habitat quality declines, due to their highly specialised requirements (Huntley et al. Reference Huntley, Collingham, Green, Hilton, Rahbek and Willis2006).
The Albertine Rift region, located in the eastern portion of the African continent, stretches from the northern end of Lake Albert to the southern end of Lake Tanganyika and covers Burundi, Democratic Republic of Congo (DRC), Rwanda, Tanzania and Uganda. As part of the Eastern Afromontane Hotspot (Brooks et al. Reference Brooks, Hoffmann, Burgess, Plumptre, Williams, Gereau, Mittermeier, Stuart, Mittermeier, Robles-Gil, Hoffmann, Pilgrim, Brooks, Mittermeier, Lamoreux and Fonseca2004), the Albertine Rift is the most species-rich region for vertebrates on the African continent (Pickford Reference Pickford1990, Brooks et al. Reference Brooks, Balmford, Burgess, Fjeldsa, Hansen, Moore, Rahbek and Williams2001, Plumptre et al. Reference Plumptre, Behangana, Davenport, Kahindo, Kityo, Ndomba, Nkuutu, Owiunji, Ssegawa and Eilu2003) and an internationally recognized Endemic Bird Area according to BirdLife International (Stattersfield et al. Reference Stattersfield, Crosby, Long and Wege1998), as well as a WWF ‘Global-200’ priority ecoregion (Olson and Dinerstein Reference Olson and Dinerstein1998, Burgess et al. Reference Burgess, D’Amico Hales, Underwood, Dinerstein, Olson, Itoua, Schipper, Ricketts and Newman2004).
The Volcanoes National Park (VNP) in Rwanda, part of the Albertine Rift region, boasts some of Rwanda’s best remaining natural vegetation and is home to many endangered species, including the ‘Critically Endangered’ mountain gorilla Gorilla beringei beringei, several globally threatened bird species and species endemic to the Albertine Rift region. Rapid surveys in the VNP have shown that more than 100 bird species occur in the park, including the threatened Shelley’s Crimsonwing Cryptospiza shelleyi (Owiunji et al. Reference Owiunji, Nkuutu, Kujirakwinja, Liengola, Plumptre, Nsanzurwimo, Fawcett, Gray and McNeilage2005). However, there have been no recent studies or any long-term research that enable us to determine the bird communities or the status of birds in the VNP. The VNP comprises typical Afromontane forest characterised by altitudinal gradients (ranging from 2,300 to 4,500 m). The high rainfall, cool temperatures, and altitudinal range in the park have resulted in a broad range of habitats and a rich biodiversity (Weber Reference Weber1987, Owiunji et al. Reference Owiunji, Nkuutu, Kujirakwinja, Liengola, Plumptre, Nsanzurwimo, Fawcett, Gray and McNeilage2005). However, the park has suffered from high levels of degradation and destruction, with the total area of the VNP reduced by 50%, from 328 km2 to 160 km2, during the 1960s and 1970s, as a result of conversion of land for agriculture (Weber Reference Weber1987). Today, the park remains under threat from illegal activities and population pressure, with the area surrounding the park having some of the highest population densities in Africa (ranging from 314 to 1,028 people per km2; Bush et al. Reference Bush, Ikirezi, Daconto, Gray and Fawcett2010).
Given the recognised importance of the Volcanoes National Park for biodiversity, and its vulnerability to external pressures and environmental change, long-term monitoring of the park’s biodiversity is crucial. Such information will allow us to determine the status of diversity in the park, and to detect any changes over time or in response to environmental factors. As such, this study aims to determine the biodiversity and conservation value of the VNP for birds, compared to areas outside of the park; identify the important vegetation types in the VNP for birds; assess the most important environmental and habitat factors for bird diversity in the VNP; and determine trends of birds in the VNP over the five-year study period (2013–2017).
Methods
Study area
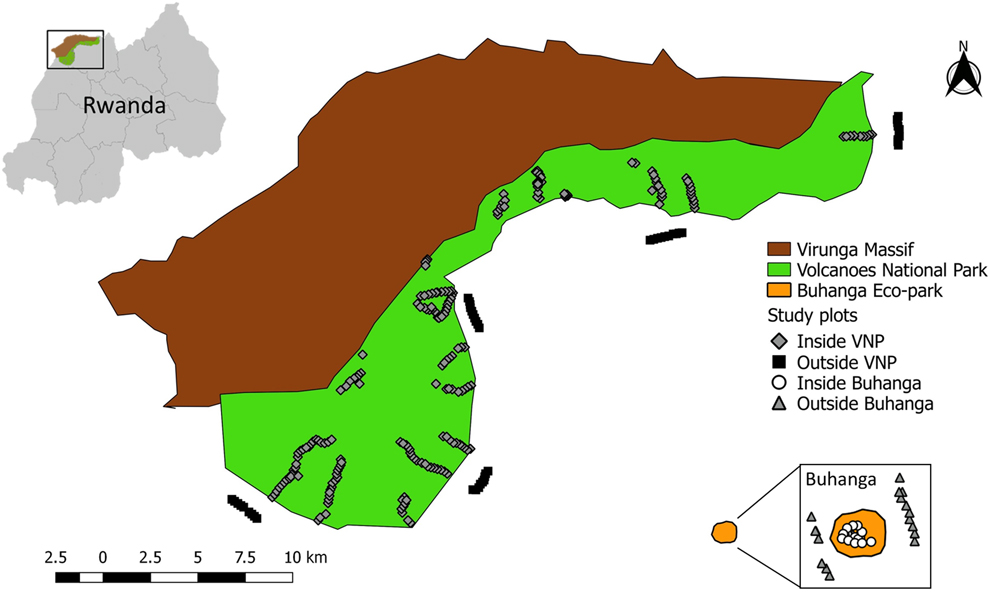
The study was conducted in and around the Volcanoes National Park (VNP), Rwanda (between 1°21’–1°35’S, 29°22’–29°44’E), a mountainous region, located on the eastern edge of the Albertine Rift (Figure 1). Elevation ranges from 2,300 to 4,500m above sea level (McNeilage Reference McNeilage, Robbins, Sicotte and Stewart2001). Annual rainfall in the Virungas is c.2,000 mm (Plumptre Reference Plumptre1991), with a distinct “long” dry season in June–August, a less distinct “short” dry season in December–February, a “long” heavy rainy season March–May, and a less heavy “short” rainy season September–November (Grueter et al. Reference Grueter, Ndamiyabo, Plumptre, Abavandimwe, Mundry, Fawcett and Robbins2013). This study was carried out at 30 sites inside the VNP (covering both the eastern and western sectors of the park; Table S1 in the online Supplementary material) in all vegetation types, excluding the rocky alpine zones (c.8 to 13 km2), which were not surveyed due to logistical constraints. The vegetation types loosely followed those classified by Plumptre (Reference Plumptre1991) and Grueter et al. (Reference Grueter, Ndamiyabo, Plumptre, Abavandimwe, Mundry, Fawcett and Robbins2013): (1) bamboo Yushania alpina and mixed bamboo forest at c.2,500–2,800 m; (2) mixed forest and Mimulopsis: mixed species montane forest with understorey of dense Mimulopsis spp. at c.2,500–2,700 m; (3) brush ridge comprised of Hypericum woodland on volcano slopes at c.3,000–3,300 m; (4) Hagenia-Hypericum woodland characterised by Hypericum revolutum, Hypericum absi and Hagenia abyssinica trees at c.2,800–3,300 m; (5) herbaceous vegetation (dense tall herbs with no tree cover) at c.2,800–3,300 m; (6) meadows at c.3,100–3,400 m; (7) a sub-alpine zone comprised of giant lobelia Lobelia stuhlmannii stands and thickets of Rubus spp. at c.3,300–3,600 m; and (8) waterbodies, comprising streams, ponds, swamps, bogs and marshes of varying sizes (c.100–23,000 m2) at varying elevations.

Figure 1. Map of the study area showing the location of the study plots at the four different localities (Inside VNP; Outside VNP; Inside Buhanga; Outside Buhanga).
In addition to sampling inside the VNP, sampling was also conducted in three other localities in the study area: five sites outside the VNP (comprised of cropland at c.2,000–2,500 m), two sites inside Buhanga eco-park (comprised of Dracaena vegetation at c.1,600 m) and two sites outside Buhanga eco-park (comprised of cropland at c.1,600 m) (Figure 1; Table S1). Buhanga eco-park is a small (c.30 ha) patch of sacred forest comprised of open and closed vegetation, surrounded by cropland and high human population densities (Plumptre et al. Reference Plumptre, Masozera and Vedder2001). Buhanga eco-park and the areas directly surrounding the VNP and Buhanga eco-park, were selected to be surveyed in this study in order to assess the conservation value of the VNP in comparison with other national parks and non-protected areas. Buhanga eco-park was selected as it is in close proximity to the VNP, so has a similar climate, but different elevation and vegetation.
Avifauna surveys
Avifauna surveys were carried out every year between June and September. Surveys inside and outside the VNP ran from 2013 to 2017; surveys inside and outside Buhanga eco-park ran from 2010 to 2017. Point count methods (Bibby Reference Bibby2000) were used to survey avifauna communities in each of the localities. At each site, transects at > 1000 m distance from each other were established, using existing forest trails, tracks and paths. Along each of these transects, fixed-radius point counts (Bibby Reference Bibby2000) of 25 m radius (‘plots’) were established at 200 m intervals (Sutherland Reference Sutherland2006), except inside Buhanga, where the intervals were 100 m, due to limitations in the size of the park. The location of the centre of each plot was recorded using a handheld GPS unit. A total of 377 plots were covered, including 297 plots inside the VNP, 40 plots outside the VNP, 20 plots inside Buhanga eco-park, and 20 plots outside Buhanga eco-park. Bird counts were carried out between 06h30 and 12h00 with observations lasting 10 minutes per point but allowing 5 minutes for settling. All birds observed or heard, including those in flight, were recorded and their distance from the centre of the plot was measured using a laser rangefinder. Each plot was surveyed twice per season, with at least one month between surveys.
Habitat variable measurements
Habitat assessments were carried out between June and September 2017 in each of the bird monitoring plots at each site, to obtain environmental and habitat data in order to investigate which factors affect the diversity of birds inside the VNP. At each plot, the dominant vegetation type was recorded and categorised into the following vegetation types, roughly following the classification of Plumptre (Reference Plumptre1991), Watts (Reference Watts1983), and Grueter et al (Reference Grueter, Ndamiyabo, Plumptre, Abavandimwe, Mundry, Fawcett and Robbins2013): bamboo/mixed bamboo; brush ridge; Hagenia forest/Hypericum woodland; herbaceous; meadow; high/low/open/closed mixed forest; and subalpine (characterised by wet or dry meadows of sedges or grasses). The vegetation type of any plots located at wetlands was classified as ‘waterbody’. Vegetation types in which sampling was conducted outside the VNP were either crops (outside VNP and outside Buhanga) or Dracaena (inside Buhanga).
Habitat measurements were taken in a 10 x 10 m sub-plot in the centre of each 50 m-diameter bird survey plot. The location of each sub-plot was recorded using a handheld GPS unit. Altitude was determined using a handheld GPS unit, and split into altitude bands (1,500–2,000 m; 2,001–2,500 m; 2,501–3,000 m; 3,001–3,500 m; 3,501–4,000 m; 4,001–4,500 m) for analysis. Air temperature and humidity were recorded using a thermo-hygrometer at the four corners of each sub-plot and the mean temperature and humidity data were calculated. Temperature and humidity measurements were taken in the morning, between 08h00 and 10h00. Canopy height (representative height of the taller trees composing the upper canopy layer) within each study sub-plot was measured using the tangent method with a clinometer and tape measure. To calculate the mean canopy height of each plot, two measurements were taken at each side of the plot. Canopy cover was measured from hemispherical photographs taken using a fisheye hemispherical lens and analysed with the software Gap Light Analyzer 2.0 (Frazer et al. Reference Frazer, Canham and Lertzman2000). The canopy was photographed from the understorey (camera oriented towards the sky), to produce a circular image of the canopy. The software then transforms the colours from hemispherical photos to black and white, in order to quantify the number of pixels of the photograph corresponding to canopy. Canopy cover was then calculated as the proportion of the total number of black pixels in the photograph. To determine the proportion of canopy cover of each sub-plot, four canopy photographs were taken at each corner of the sub-plot, and the mean value was calculated. Understorey shrub cover was measured by photographing the understory shrub layer using a black sheet (1 x 1 m) arranged perpendicularly to the ground as background. A normal camera lens was used and the camera was positioned 3 m away from the background. A total of four understorey photographs were taken at each corner of the sub-plots (looking in to the centre of the plot). The photographs were then analysed with the software Sidelook 1.1 (Nobis and Hunziker Reference Nobis and Hunziker2005) and the mean value calculated. This software converts the photographs into polarised black and white pictures, providing the percentage of black (vegetation) and white (no vegetation) pixels and provides a measure of both percentage cover and indices of vegetation complexity.
Ground cover was visually estimated within two 50 cm x 50 cm sub-quadrats placed 10 m on either side of the centre point of the subplot and assessing the percentage of ground covered by: vegetation; leaf litter and fine woody debris (< 10 cm diameter); coarse woody debris (> 10 cm diameter); rock; bare soil; other. The dominant ground cover type was then determined as the ground cover type with the highest mean percentage cover over the two sub-quadrats. Leaf litter depth was measured by inserting a 1-m stick into the litter at two opposite corners of the sub-plot and calculating the mean depth. Within the 10 x 10m subplot, the total basal area of live and dead trees was calculated by making counts of all free-standing woody-stemmed plants that were taller than 1 m above the soil, recorded by DBH (diameter at breast height) class (2.5–5 cm; 5–10 cm; 10–25 cm; 25–50 cm; 50–100 cm; >100 cm; following Kanowski et al. Reference Kanowski, Catterall, Freebody, Freeman and Harrison2010). The total basal area was calculated as the sum of the basal area of all woody-stemmed plants recorded within the sub-plot (in m ha-2). Basal area for live trees and standing dead trees were calculated separately. In addition, we also calculated DBH of live H. abyssinica trees, saplings and seedlings in the subplot, as this tree species is known to be a key habitat for biodiversity, but is suspected to be declining in the VNP (Fischer and Killmann Reference Fischer and Killmann2008, Seburanga et al. Reference Seburanga, Nsanzurwimo and Folega2014). All vines that were >1 cm DBH were also recorded by DBH class, and the total basal area of vines was calculated for each plot.
Data analysis
All calculations were carried out using R version 3.4.2 (R Core Team 2017). Each site was visited twice each year and these visits were pooled into annual counts and these annual counts were used as the sampling unit. In order to account for any potential difference in detection probability between years, abundance estimates were calculated using distance sampling methodology, to give an estimate of the number of individual birds per plot per year. To estimate species richness in each habitat category and assess whether all bird species had been sampled, we generated sample-based observed species richness rarefaction curves, with 95% confidence intervals, using ‘vegan’ and ‘rich’ packages in R. We also calculated the mean of four commonly used abundance-based species richness estimators (CHAO, JACK1, JACK2 and Bootstrap), from 999 randomisations of observed species richness. Sampling efficiency was calculated as observed species richness/ estimated species richness x 100. We measured species diversity using the Shannon-Wiener index, which takes into account the proportion of individuals recorded for each species, relative to the total number of individuals recorded, for each community. To test for effects of year, vegetation type, and habitat factors, we used generalised linear mixed effects models (glmm). The effect of year on abundance, species richness and Shannon diversity was looked at with site as a random effect. Year and site were included as random effect terms when looking at the effect of locality (Inside VNP; Outside VNP; Inside Buhanga; Outside Buhanga), and site was included as a random effect term when looking at the effect of year and vegetation type on abundance, species richness and Shannon diversity. Bird data from 2017 only (the same year as the habitat data was collected) was used when looking at the effect of habitat factors on bird diversity (abundance, species richness and Shannon diversity). Significant differences were followed up with Tukey contrasts (Multiple Comparisons of Means). Appropriate error structures were applied for all models. To assess the similarity of vegetation types in terms of their species composition, we used a non-metric multidimensional scaling (NMDS) ordination analysis using Bray-Curtis pairwise distances based on bird abundance data. To test for differences in Bray-Curtis similarity between localities and vegetation types, we used a permutational multivariate analysis of variance (ADONIS).
Collinearity between variables is an ever-present issue in regression-type analyses of ecological data (Dormann et al. Reference Dormann, Elith, Bacher, Buchmann, Carl, Carré, Marquéz, Gruber, Lafourcade, Leitão, Münkemüller, Mcclean, Osborne, Reineking, Schröder, Skidmore, Zurell and Lautenbach2013). Collinearity was explored between habitat variables using pairwise Pearson’s correlations, scatterplots and Principal Components Analyses (PCA) (Zuur et al. Reference Zuur, Ieno and Elphick and2010). If significant collinearity between two habitat variables (Pearson’s r2 > 0.7) was detected, a single variable was selected from the pair to represent both in models (Dormann et al. Reference Dormann, Elith, Bacher, Buchmann, Carl, Carré, Marquéz, Gruber, Lafourcade, Leitão, Münkemüller, Mcclean, Osborne, Reineking, Schröder, Skidmore, Zurell and Lautenbach2013).
To test the importance of different habitat variables on bird abundance, species richness and species diversity we used GLMMs or LMMs, with site as the random intercept. Model residuals and diagnostics were plotted and checked as per Zuur et al. (Reference Zuur, Ieno, Walker, Saveliev and Smith2009) and the importance of environmental variables in each of the three models was determined using backwards model selection based on likelihood ratio tests (χ2) and confidence intervals (Bolker et al. Reference Bolker, Brooks, Clark, Geange, Poulsen, Stevens and White2009). Goodness of fit of models was assessed split into marginal (variance explained by fixed effects) and conditional (variance explained by fixed + random effects) pseudo R2 components (Nakagawa & Schielzeth Reference Nakagawa and Schielzeth2013) in package ’MuMIn’ (Bartoń Reference Bartoń2016).
Results
Sampling efficiency
A total of 32,885 individuals from 199 bird species were recorded in this study, with 127 species occurring within the VNP, 100 species occurring outside the VNP, 129 species occurring in Buhanga eco-park and 108 species occurring outside Buhanga eco-park. Twenty-five species were recorded only within the VNP (Table S3), including the Endangered Albertine Rift endemics Shelley’s Crimsonwing Cryptospiza shelleyi and Grauer’s Swamp-warbler Bradypterus graueri. The Endangered Shelley’s Crimsonwing was recorded only in brush ridge (n = 11) and mixed forest (n = 1) within the VNP, and the Endangered Grauer’s Swamp-warbler was recorded only in waterbodies (n = 96) within the VNP (Table S2). The most abundant species was the Ruwenzori Double-collared Sunbird Cinnyris stuhlmanni, which was found in all localities except inside Buhanga, and in all vegetation types except Dracaena (inside Buhanga) (n = 2,624; Table S3). Species accumulation curves suggest that sampling effort was adequate to characterise the local bird community for all vegetation types, except for the herbaceous zone, meadow and brush ridge (Figure 2). The four common species richness estimators show that between 64% of species (in herbaceous zone) to 89 % of species (in crops) were sampled (Table 1).
Figure 2. Species accumulation curves constructed using sample-based rarefaction curves for the different vegetation types: bamboo/ mixed bamboo, Hagenia/Hypericum, meadow, crops, and Dracaeana (A); and brush ridge, herbaceous, mixed forest, sub-alpine, and waterbody (B).
Table 1. Summary of distance sampling abundance estimate (DAbun), total recorded abundance (RAbun), observed (Sobs) and estimated (Sest) species richness (± SE), and proportion of species detected (Sobs / Sest) in each vegetation type.
Effect of sampling year on bird diversity – trends in bird diversity
Both inside and outside the VNP, there was a significant decline in abundance (Inside VNP: χ2 = 286.36, df = 1, P < 0.001, Figure 3A; Outside VNP: χ2 = 35.647, df = 1, P < 0.001, Figure 3B) and species richness (Inside VNP: χ2 = 10.733, df = 1, P = 0.001, Figure 3E; Outside VNP: χ2 = 452.19, df = 1, P < 0.001, Figure 3F) over the sampling years, but only a small change in Shannon diversity (Inside VNP: χ2 = 3.192, df = 1, P = 0.074, Figure 3I; Outside VNP: χ2 = 3.309, df = 1, P = 0.069, Figure 3J). Inside the VNP, bird abundance declined from 5.70 ± 0.29 SE birds per visit in 2013 to 3.68 ± 0.19 SE birds per visit in 2017; and species richness declined from 3.71 ± 0.20 SE birds per visit in 2013 to 3.43 ± 0.19 SE species per visit in 2017. Within Buhanga eco-park, there was also a significant decline in abundance (χ2 = 36.598, df = 1, P < 0.001, Figure 3C), species richness (χ2 = 38.215, df = 1, P < 0.001, Figure 3G) and Shannon diversity (χ2 = 23.520, df = 1, P < 0.001, Figure 3K) over the sampling years. However, around Buhanga eco-park, there was an increase in abundance (χ2 = 5.705, df = 1, P = 0.0169, Figure 3D), but no change in species richness (χ2 = 0.191, df = 1, P = 0.662, Figure 3H) or Shannon diversity (χ2 = 0.218, df = 1, P = 0.641, Figure 3L) across sampling years.
Figure 3. Effect of sampling year on abundance (distance sampling estimate; A, B, C, D), species richness (E, F, G, H) and Shannon diversity (I, J, K, L), inside VNP, outside VNP, inside Buhanga eco-park and outside Buhanga eco-park, showing model-predicted mean (black line) ± SE (grey shade).
Importance of Volcanoes National Park for bird diversity
Locality (Inside VNP; Outside VNP; Inside Buhanga; Outside Buhanga) had a significant effect on abundance (χ2 = 11.277, df = 3, P = 0.010; Figure 4A), species richness (χ2 = 22.828, df = 3, P < 0.001; Figure 4B) and Shannon diversity (χ2 = 16.670, df = 3, P < 0.001; Figure 4C), with inside and outside Buhanga eco-park having higher abundance, species richness and Shannon diversity than inside the VNP. Species composition (Bray Curtis pairwise distances) differed significantly among localities (ADONIS: r 2 = 0.397, df = 3, P < 0.001; Figure 5A). The nMDS ordination represented 77.21% of the assemblage dissimilarity and showed that the sites within the VNP formed a closely grouped cluster and were distinct from those outside the VNP, inside Buhanga eco-park and outside Buhanga eco-park (Figure 5A). The pairwise permutational multivariate analysis of variance showed that the bird communities inside the VNP were significantly different from those outside the VNP, and both inside and outside Buhanga (Table 2), whereas the bird communities outside the VNP, inside Buhanga and outside Buhanga were not significantly different from one another (Table 2).

Figure 4. Mean ± SE bird abundance (distance sampling estimate; A), species richness (B) and Shannon diversity (C) for the different localities (inside VNP, outside VNP, inside Buhanga eco-park, outside Buhanga eco-park). Unlike letters indicate significant differences (P <0.05) determined through post-hoc Tukey contrasts (Multiple Comparisons of Means).
Figure 5. Non-metric multidimensional scaling (MDS) ordination of bird community assemblages between the different localities (A) at the site scale (r 2 = 0.77), and between the different vegetation types (B) at the year scale (r 2 = 0.77), based on abundance data.
Table 2. Summary of pairwise comparisons from permutational multivariate analysis of variance using distance matrices, showing the similarity of bird communities in the different localities, based on their Bray-Curtis similarity values.

* Differences significant at the 0.05 level
Importance of the different vegetation types in the VNP for bird diversity
Bird abundance (χ2 = 60.044, df = 7, P < 0.001; Figure 6A), species richness (χ2 = 135.40, df = 7, P < 0.001; Figure 6B) and Shannon diversity (χ2 = 146.72, df = 7, P < 0.001; Figure 6C) all varied significantly by broad vegetation type within the VNP, with the lowest abundance in bamboo/ mixed bamboo (2.53 ± 0.24 SE birds per visit) and the subalpine zone (2.18 ± 0.36 SE birds per visit). Species richness and Shannon diversity were both highest in the Hagenia/Hypericum zone (species richness: 4.42 ± 0.25 SE species per visit; Shannon diversity: 1.31 ± 0.06 SE per visit), followed by mixed forest (species richness: 4.26 ± 0.25 SE species per visit; Shannon diversity: 1.27 ± 0.06 SE per visit) and the herbaceous zone (species richness: 4.06 ± 0.44 SE species per visit; Shannon diversity: 1.21 ± 0.12 SE per visit), whilst the lowest species richness and diversity occurred in the subalpine zone (species richness: 2.49 ± 0.16 SE species per visit; Shannon diversity: 0.76 ± 0.06 SE species per visit). Species composition (Bray Curtis pairwise distances) differed significantly among vegetation types (ADONIS: r 2 = 0.613, df = 7, P < 0.001; Figure 5B). The nMDS ordination represented 77.17% of the assemblage dissimilarity and showed that each vegetation type formed a relatively closely grouped cluster, representing distinct bird communities within each vegetation type (Figure 5B).
Figure 6. Mean ± SE bird abundance (distance sampling estimate; A), species richness (B) and Shannon diversity (C) for the different vegetation types within the VNP. Unlike letters indicate significant differences (P <0.05) determined through post-hoc Tukey contrasts (Multiple Comparisons of Means).
Importance of habitat variables on bird diversity in the VNP
Significant collinearity was detected between temperature and humidity (Pearson’s r2 = 0.83), and basal area of dead trees and basal area of Hagenia (Pearson’s r2 = 0.86), so temperature and basal area of dead trees were selected to represent these variables in the models. The importance of 11 uncorrelated habitat variables was determined for bird abundance, species richness and Shannon diversity (Table 3). All three bird diversity indices (abundance, species richness and Shannon diversity) had significant negative relationships with altitude and leaf litter depth, whilst basal area of dead trees/Hagenia had a positive effect on abundance, and basal area of vines had a positive effect on species richness and Shannon diversity. Temperature had a significant positive effect on abundance. By contrast, dominant ground cover, canopy height and cover, understorey cover and basal area of trees were not important in any model and did not have any effect in the diversity indices.
Table 3. Importance of measured habitat variables on bird abundance (distance sampling estimate), species richness and Shannon diversity in the VNP. Degrees of freedom, strength of effect (χ2), effect direction and P-values are reported for habitat variables that had a significant effect on the three diversity indices at the < 0.05 level. NS indicates that the habitat variable was not significant at the 0.05 level and was not included in the model. Positive and negative effect directions are denoted by ↑ and ↓ respectively.
Discussion
This is the first study, to our knowledge, to investigate the status and trends of bird communities in the VNP, using a multi-year dataset. We found that the VNP hosts a unique bird community compared to other localities, with several Albertine Rift endemics and threatened species occurring in the VNP. We identified the most diverse vegetation types within the VNP as Hagenia/Hypericum woodland, herbaceous vegetation, mixed forest and brush ridge, whilst the VNP’s waterbodies provide key habitat for the ‘Endangered’ Albertine Rift endemic Grauer’s Swamp-warbler. We determined that bird diversity was negatively affected by leaf litter depth and elevation, whilst the basal area of dead standing trees, Hagenia and vines had a positive effect on bird diversity in the VNP. Moreover, our data suggest that there has been a decline in bird diversity over the study period (2013–2017) in the VNP as well as in surrounding localities; however, we recommend further monitoring to confirm these suspected trends.
Importance of the VNP for bird conservation
Our study recorded a total of 17,421 individuals from 127 bird species within the VNP, including 17 Albertine Rift endemics and four threatened species. These findings expand on previous work in the area and provide a more detailed species list and description of the different bird communities occurring in the VNP and surrounding areas. In addition to the 119 bird species, including 13 Albertine Rift endemic species recorded by Owuinji et al. (Reference Owiunji, Nkuutu, Kujirakwinja, Liengola, Plumptre, Nsanzurwimo, Fawcett, Gray and McNeilage2005) over 23 days in 2004, we also recorded: Handsome Francoline Pternistis nobilis, Ruwenzori/Montane Nightjar Caprimulgus poliocephalus, Dusky Crimsonwing Cryptospiza jacksoni and Grauer’s Swamp-warbler. Furthermore, Owuinji et al., (Reference Owiunji, Nkuutu, Kujirakwinja, Liengola, Plumptre, Nsanzurwimo, Fawcett, Gray and McNeilage2005) did not detect the ‘Endangered’ Grauer’s Swamp-warbler, the ‘Critically Endangered’ Hooded Vulture Necrosyrtes monachus, the ‘Vulnerable’ Martial Eagle Polemaetus bellicosus, and the ‘Endangered’ Shelley’s Crimsonwing from any point counts in the VNP, whereas the presence of the latter species was recorded through opportunistic observations. These findings highlight the value of rapid biological assessments in providing baseline data on bird occurrences, but also demonstrate the importance of thorough and repeated surveys to ensure that as many species as possible are detected, particularly rare and cryptic species.
Although we recorded higher abundance, species richness and diversity in Buhanga eco-park than both inside and outside the VNP, the species that made up the bird communities inside Buhanga were not found to be unique, as they were shared with sites outside the VNP and outside Buhanga. The bird communities inside the VNP, on the other hand, were distinct – they were significantly different from those recorded at other localities in the study (outside the VNP, inside Buhanga and outside Buhanga). In fact, there were significantly more Albertine Rift endemics (both in terms of abundance and species richness) recorded in the VNP than in any other locality in this study, which further highlights the importance of the VNP in the conservation of unique species assemblages and for Albertine Rift endemics.
Importance of different vegetation types for birds in the VNP
This study showed that each vegetation type in the VNP formed a relatively closely grouped cluster on an nMDS ordination, representing distinct bird assemblages. This demonstrates the importance of each of the park’s vegetation types for the conservation of different bird communities. Our detailed analyses of these vegetation types revealed that in particular, high bird abundance, species richness and diversity were found in the low-mid elevation Hagenia/Hypericum, herbaceous, brush ridge and mixed forest zones. Despite the herbaceous zone being the least surveyed vegetation type in this study, and not approaching an asymptote for sufficient sampling estimation, it was one of the most abundant and species-rich vegetation types in this study (from the model outputs), hosting a variety of threatened and Albertine Rift endemic species, including the highest numbers of Ruwenzori Double-collared Sunbird Cinnyris stuhlmanni than any other vegetation type. We therefore recommend increased sampling of this vegetation type in order to accurately describe the avifauna community and to ensure that all species within this habitat are recorded. Furthermore, effective management of this habitat zone is crucial in ensuring the conservation of bird diversity in the park.
The Hagenia/Hypericum zone is not only particularly important habitat for birds, but also for mountain gorillas (Sarmiento et al. Reference Sarmiento, Butynski and Kalina1996, Watts Reference Watts1998) and other elements of biodiversity in the VNP (Seburanga et al. Reference Seburanga, Nsanzurwimo and Folega2014, Milner and Harris Reference Milner and Harris1999; Sarmiento et al. Reference Sarmiento, Butynski and Kalina1996). However, it is suspected that the Hagenia/Hypericum zone may be decreasing, since Hagenia abyssinica may not be regenerating properly in the VNP (Kayitete et al. Reference Kayitete, van der Hoek, Nyirambangutse and Derhé2019). It is thought that Hagenia requires fire to initiate germination (Lange et al. Reference Lange, Bussmann and Beck1997) – a process which is limited in recent years in the VNP due to its protected area status. First reported in Virungas in the 1980s (Troupin Reference Troupin1982) and supported more recently in the VNP (Fischer and Killmann Reference Fischer and Killmann2008, Kayitete et al. Reference Kayitete, van der Hoek, Nyirambangutse and Derhé2019), research has shown that H. abyssinica is mainly represented by large and old trees, with many more adults than saplings or seedlings in the VNP. Furthermore, the past decline in the VNP’s area has caused the park’s large herbivore population, including mountain gorillas, to be concentrated into a smaller area. This, combined with an increasing mountain gorilla population (Gray et al. Reference Gray, Roy, Vigilant, Fawcett, Basabose, Cranfield, Uwingeli, Mburanumwe, Kagoda and Robbins2013), has led to increased herbivory pressure within the bamboo and Hagenia/Hypericum zones (Murererehe Reference Murererehe2000, Nsanzurwimo Reference Nsanzurwimo2004, Plumptre Reference Plumptre1993, Grueter et al. Reference Grueter, Ndamiyabo, Plumptre, Abavandimwe, Mundry, Fawcett and Robbins2013). Such damage through trampling from large herbivore predation has been shown to decrease or stop H. abyssinica germination completely (Lange et al. Reference Lange, Bussmann and Beck1997).
Waterbodies were found to be key habitat for Grauer’s Swamp-warbler, an Albertine Rift endemic which was found only within waterbodies in this study. This species is threatened with extinction due to it occurring in very small and severely fragmented habitat patches, many of which are being converted to cultivation or pasture across its limited range. As such, the waterbodies within the park are crucial for this species’ continued survival. However, during recent years there have been indications of wetland declines in the VNP, demonstrated by a decrease in the soil water level and colonization of wetlands by surrounding non-wetland vegetation (Runyambo Reference Runyambo2006, Reference Runyambo2009). Human activities, particularly agriculture, are a major cause of wetland declines, with drainage and water extraction being the main cause of wetland loss in agricultural regions (Zedler and Kercher Reference Zedler and Kercher2005, Böhme et al. Reference Böhme, Becker, Diekkrüger and Förch2016). The wetlands in the VNP are suspected to suffer from a high density of agricultural activities surrounding the park, including intensified establishment of eucalyptus plantings around the park in recent years, which are known to remove large amounts of water from streams and groundwater reservoirs (Dye and Versfeld Reference Dye and Versfeld2007, Kluthe Reference Kluthe2016). In addition to this, illegal water extraction within the park is likely to be imperilling water quality and quantity of the wetlands (Lane et al. Reference Lane, Morris, Ningnan, Guangyi, Guoyi and Daping2004). Furthermore, climate change is also expected to have a pronounced effect on wetlands, negatively impacting habitat structure and availability, local climate, water quality and water provision (Ramsar Reference Ramsar2002). In the East Africa region, climate change is predicted to increase temperatures and lead to more variability in rainfall (Hulme et al. Reference Hulme, Doherty, Ngara, New and Lister2001, IPCC 2007). These impacts are all likely to have serious knock-on consequences for the bird communities that depend on the VNPs’ wetlands, including Grauer’s Swamp-warbler.
Importance of habitat characteristics on birds in the VNP
We found a significant positive effect of temperature/humidity only on bird abundance, and no effect of dominant ground cover, canopy height and cover, understorey cover or basal area of trees on bird diversity. This is likely more an artefact of the analytical approach used rather than a true lack of relationship, since different guilds of birds (i.e. different functional groups, those from different feeding/ foraging guilds, those with different habitat specialisms) have different habitat requirements, thus confounding any effects when looking at bird abundance and richness as a whole. Furthermore, climatic data were collected over a very limited time period, so we recommend collecting hourly climatic data over a longer time period (≥ 3 months). However, overall, we found that the basal area of dead trees and/or Hagenia had a positive effect on bird abundance. Dead standing trees are known to provide important nesting sites for cavity nesting birds (Gibbs et al. Reference Gibbs, Hunter and Melvin1993, Samuelsson et al. Reference Samuelsson, Gustafsson and Ingelög1994), which are often limited by the availability of suitable nest sites (Newton Reference Newton1994, Reference Newton1998). Thus, sites in the VNP with a higher basal area of dead trees are likely to support higher numbers of cavity nesting birds. Furthermore, dead wood provides foraging opportunities for insectivorous birds, as many invertebrate species inhabit dead trees (Samuelsson et al. Reference Samuelsson, Gustafsson and Ingelög1994, Jonsell et al. Reference Jonsell, Weslien and Ehnström1998). Hagenia abyssinica is known to grow to an enormous girth, reaching heights of up to 25 m (Lange Reference Lange, Bussmann and Beck1997), and is a unique ecosystem in itself. Producing very thick boughs and branches that are often almost horizontal, with rough, flaking bark, it is favoured by an abundance of epiphytes (Niemelä et al. Reference Niemelä, Renvall and Hjortstam1998) and may provide habitat for invertebrates, a food source for insectivorous birds. Although the seeds of H. abyssinica are wind dispersed (and thus do not provide a large food resource for granivorous birds), this species produces large clusters of flowers which may be exploited by nectarivorous birds.
We found that basal area of vines had a positive effect on species richness and diversity of birds in the VNP. Large vines are typically associated with healthy, primary forest (Peres Reference Peres1999, Schnitzer and Bongers Reference Schnitzer and Bongers2002) and are known to provide many direct and indirect benefits to birds, including food, nesting sites, and protection from predators (Putz et al. Reference Putz, Sirot, Pinard, Fimbel, Grajal and Robinson2001, Michel et al. Reference Michel, Robinson, Sherry, Schnitzer, Bongers, Burnham and Putz2015). Many generalists and understorey frugivores depend on the fruits produced by these understorey shrubs and vines, while insectivores rely on vine tangles that trap leaf-litter to provide them with a foraging substrate. In addition, we found that leaf litter depth had a negative effect on the three bird diversity indices, which appears contradictory to conventional thought, since many understorey insectivores are known to forage in the leaf litter for invertebrates (Canaday Reference Canaday1996). However, this result may be caused by the large volume of leaf litter recorded in the sub-alpine zone, which had the lowest bird diversity.
Finally, we found higher bird diversity at lower elevations in the VNP, a finding that is supported by numerous studies from around the globe (McCain Reference McCain2009, Sanders and Rahbek Reference Sanders and Rahbek2012). Nevertheless, it should be noted that the lower elevations in the VNP (≥ 2,400m) represent mid-high elevations for Rwanda. Decreasing diversity with increasing elevation is seen across the world in a variety of taxa (Kluge et al. Reference Kluge, Kessler and Dunn2006, Rahbek Reference Rahbek1995, McCain Reference McCain2009), and there are a number of possible causes for this, including cooler climate and decreased productivity at higher elevations (Kluge et al. Reference Kluge, Kessler and Dunn2006, Rahbek Reference Rahbek1995, McCain Reference McCain2007, Rowe Reference Rowe2009, Wang et al. Reference Wang2009), biological processes (including mass effects, habitat heterogeneity; Rozenweig Reference Rosenzweig1995, Kattan and Franco Reference Kattan and Franco2004), isolation and evolutionary history (Machac et al. Reference Machac2011), and spatial factors (Rahbek Reference Rahbek1997), although it is likely that no single mechanism is responsible for elevational diversity gradients.
High elevation environments, like the VNP, are predicted to be among the most sensitive to future climate change (Öztürk et al. Reference Öztürk, Hakeem, Faridah-Hanum and Efe2015). Predictions have been made about how the climate may change in the Albertine Rift region in the coming century. Temperature increases of up to 3.9°C by 2090 are projected to occur, which would translate to a very large upward displacement of species’ ranges and vegetation zones, on the order of 600–720 m relative to 1990 levels (Picton Phillips and Seimon Reference Picton Phillipps and Seimon2010). Upland species, such as the birds of the VNP, may be very vulnerable to extinction induced by climate change (Şekercioğlu et al. Reference Sekercioglu, Schneider, Fay and Loarie2008, Harris et al. Reference Harris, Dwi Putra, Gregory, Brook, Prawiradilaga, Sodhi, Wei and Fordham2014), since warming temperatures may force these species to shift upslope, reducing their geographic ranges almost entirely, decreasing their population, and driving them to extinction (Shoo et al. Reference Shoo, Williams and Hero2005, Harris et al. Reference Harris, Dwi Putra, Gregory, Brook, Prawiradilaga, Sodhi, Wei and Fordham2014). In this study, 74.6% of all Scarlet-tufted Malachite Sunbirds Nectarinia johnstoni were recorded in the subalpine zone, suggesting that this species is altitudinally restricted to higher elevations and may thus be particularly vulnerable to climate change. Furthermore, range-restricted and endemic species are also projected to be vulnerable to climate change (Malcolm et al. Reference Malcolm, Liu, Neilson, Hansen and Hannah2006, IPCC 2007, Williams et al. Reference Williams, Jackson and Kutzbach2007, Ohlemüller et al. Reference Ohlemüller, Anderson, Araújo, Butchart, Kudrna, Ridgely and Thomas2008, Şekercioğlu et al. Reference Sekercioglu, Schneider, Fay and Loarie2008, Harris et al. Reference Harris, Dwi Putra, Gregory, Brook, Prawiradilaga, Sodhi, Wei and Fordham2014). As such, any ongoing threats faced by the birds of the VNP are likely to be further exacerbated by climate change.
Trends in bird populations in the VNP
This study detected a decline in both the number of individuals and species of birds over the survey years in the VNP, as well as in other localities surveyed in this study (outside the VNP and inside Buhanga eco-park). Declines in bird abundance and species richness in the VNP could be caused by a multitude of interacting factors, including fragmentation and edge effects, high human population density outside the VNP (Bush et al. Reference Bush, Ikirezi, Daconto, Gray and Fawcett2010), a decline in certain key habitats within the VNP (e.g. Hagenia/Hypericum forest, wetlands), disturbance by (legal and illegal) park visitors, increasing population densities of large herbivore populations in the park (Plumptre 1995, Robbins et al. Reference Robbins, Gray, Fawcett, Nutter, Uwingeli, Mburanumwe, Kagoda, Basabose, Stoinski, Cranfield, Byamukama, Spelman and Robbins2011), and potential effects of climate change (Picton Phillipps and Seimon Reference Picton Phillipps and Seimon2010). Although it is a protected area, the VNP (as well as Buhanga eco-park) is a relatively small, isolated forest patch, and is therefore sensitive to fragmentation and edge effects, as well as pressure from human and natural disturbances, which are known to affect species immigration and extinction rates (Lomolino Reference Lomolino2000).
These findings should be interpreted with caution, however, as this study was conducted over a relatively short time period. In order to confirm any possible changes in bird populations in the VNP, we recommend continued annual monitoring in the study sites, ensuring consistent survey effort between years. We recommend research into the functional diversity of birds in the VNP, including investigating the status and trends of different feeding/ foraging guilds and habitat specialisms. Since birds are known to be bio-indicators, we also suggest further studies to determine whether the patterns and trends reported here are indicative of those occurring in other taxonomic groups. In the interim period as long-term trend data is collected, we recommend effective and targeted management of key habitats and vegetation types for birds within the park, including those identified in this study, in order to mitigate any potential ongoing and future bird declines and conserve the unique bird communities in the VNP.
Supplementary Material
To view supplementary material for this article, please visit https://doi.org/10.1017/S0959270919000121
Acknowledgements
Funding for this research was provided by the Dian Fossey Gorilla Fund International, with all equipment, resources and field staff provided by the Karisoke Research Centre. Permission to conduct this research was given by the Rwanda Development Board. Many thanks to F. Emmanuel, V. Musemakweli, J. D. Nsengiyumva, I. Kwizera and P. Mutuyimana for data collection and fieldwork, and to M. Miller for analytical assistance and advice.