


INTRODUCTION
Heinrich Events (H Events) are periods of collapses of ice sheets bordering the North Atlantic during the glacials (Ruddiman, Reference Ruddiman1977; Heinrich, Reference Heinrich1988; Grousset et al., Reference Grousset, Labeyrie, Sinko, Cremer, Bond, Cortijo and Huon1993; Andrews, Reference Andrews2000). Marine archives show that in these periods ice-rafted debris (IRD) was deposited throughout the North Atlantic down to about 42°–45° N (Ruddiman, Reference Ruddiman1977; Grousset et al., Reference Grousset, Labeyrie, Sinko, Cremer, Bond, Cortijo and Huon1993; Andrews, Reference Andrews2000). Originally, during the last interglacial-glacial cycle, eleven events represented by IRD were identified in the northeast Atlantic (Chapman and Shackleton, Reference Chapman and Shackleton1998; McManus et al., Reference McManus, Oppo and Cullen1999; Wright and Flower, Reference Wright and Flower2002; de Abreu et al., Reference de Abreu, Shackleton, Schönfeld, Hall and Chapman2003; Voelker and de Abreu, Reference Voelker, de Abreu, Rashid, Polyak and Mosley-Thompson2011). The most intensive events occurred during the main phase of the Weichselian/Wisconsin glaciation (Marine Oxygen Isotope Stages 4–2).
The oceanographic conditions of the glacial North Atlantic are well documented (Chapman and Shackleton, Reference Chapman and Shackleton1998; McManus et al., Reference McManus, Oppo and Cullen1999; Wright and Flower, Reference Wright and Flower2002; de Abreu et al., Reference de Abreu, Shackleton, Schönfeld, Hall and Chapman2003; Voelker and de Abreu, Reference Voelker, de Abreu, Rashid, Polyak and Mosley-Thompson2011). Here, the lowest sea surface temperatures were found during H Events (McManus et al., Reference McManus, Bond, Broecker, Johnsen, Labeyrie and Higgins1994; Hemming, Reference Hemming2004). The sudden releases of large armadas of icebergs into the North Atlantic led not only to cooling but also to disturbances of the Atlantic Meridional Overturning Circulation (AMOC) (McManus et al., Reference McManus, Bond, Broecker, Johnsen, Labeyrie and Higgins1994; Hemming, Reference Hemming2004) and, as a consequence, to abrupt and massive changes in the oceanic and atmospheric climate (McManus et al., Reference McManus, Bond, Broecker, Johnsen, Labeyrie and Higgins1994; Hemming, Reference Hemming2004). The cold and less saline waters originating from the melting of iceberg armadas left the northern North Atlantic along the Iberian Peninsula and the northwest African coast towards the subtropical gyre passing the Canary Islands (Koopmann, Reference Koopmann1981; Holz et al., Reference Holz, Stuut and Henrich2004; Mulitza et al., Reference Mulitza, Prange, Stuut, Zabel, von Dobeneck, Itambi, Nizou, Schulz and Wefer2008; Tjallingii et al., Reference Tjallingii, Claussen, Stuut, Fohlmeister, Jahn, Bickert, Lamy and Röhl2008; Naughton et al., Reference Naughton, Sánchez Goñi, Kageyama, Bard, Duprat, Cortijo, Desprat, Malaizé, Joly and Rostek2009).
The strong cooling during H Events led to an expansion of the Arctic climate in the North Atlantic region far south to 39°N (Koopmann, Reference Koopmann1981; Holz et al., Reference Holz, Stuut and Henrich2004; Mulitza et al., Reference Mulitza, Prange, Stuut, Zabel, von Dobeneck, Itambi, Nizou, Schulz and Wefer2008; Naughton et al., Reference Naughton, Sánchez Goñi, Kageyama, Bard, Duprat, Cortijo, Desprat, Malaizé, Joly and Rostek2009). As a result, significant environmental changes occurred on the Iberian Peninsula and in northwest Africa (Koopmann, Reference Koopmann1981; Holz et al., Reference Holz, Stuut and Henrich2004; Mulitza et al., Reference Mulitza, Prange, Stuut, Zabel, von Dobeneck, Itambi, Nizou, Schulz and Wefer2008; Tjallingii et al., Reference Tjallingii, Claussen, Stuut, Fohlmeister, Jahn, Bickert, Lamy and Röhl2008; Naughton et al., Reference Naughton, Sánchez Goñi, Kageyama, Bard, Duprat, Cortijo, Desprat, Malaizé, Joly and Rostek2009). During these times this region suffered from severe droughts accompanied by an increase in wind force (Koopmann, Reference Koopmann1981; Holz et al., Reference Holz, Stuut and Henrich2004; Mulitza et al., Reference Mulitza, Prange, Stuut, Zabel, von Dobeneck, Itambi, Nizou, Schulz and Wefer2008; Tjallingii et al., Reference Tjallingii, Claussen, Stuut, Fohlmeister, Jahn, Bickert, Lamy and Röhl2008; Naughton et al., Reference Naughton, Sánchez Goñi, Kageyama, Bard, Duprat, Cortijo, Desprat, Malaizé, Joly and Rostek2009). The southern margin of the Sahara shifted into the present Sahel zone down to 14°N (Collins et al., Reference Collins, Govin, Mulitza, Heslop, Zabel, Hartmann, Röhl and Wefer2013).
The sediment deposition on the Canary Islands, especially on Lanzarote and Fuerteventura, should therefore be strongly influenced by climate changes during the glacial periods of the Quaternary. From marine archives of the surrounding Atlantic Ocean it is known that H Events led to strong dust events (Holz et al., Reference Holz, Stuut and Henrich2004; Jullien et al., Reference Jullien, Grousset, Malaizé, Duprat, Sanchez-Goñi, Eynaud, Charlier, Schneider, Bory and Bout2007; Mulitza et al., Reference Mulitza, Prange, Stuut, Zabel, von Dobeneck, Itambi, Nizou, Schulz and Wefer2008; Naughton et al., Reference Naughton, Sánchez Goñi, Kageyama, Bard, Duprat, Cortijo, Desprat, Malaizé, Joly and Rostek2009; McGee et al., Reference McGee, DeMenocal, Winckler, Stuut and Bradtmiller2013; Williams et al., Reference Williams, McGee, Kinsley, Ridley, Hu, Fedorov, Tal, Murray and DeMenocal2016; Rodrigues et al., Reference Rodrigues, Alonso-García, Hodell, Rufino, Naughton, Grimalt, Voelker and Abrantes2017; Middleton et al., Reference Middleton, Mukhopadhyay, Langmuir, McManus and Huybers2018). Thus, it can be expected that due to their location in the southeastern corner of the northeast Atlantic and because of their short distance from Africa, these islands are climatically influenced by both the surrounding ocean and the nearby African continent.
The eolian deposits that cover large parts of Lanzarote and Fuerteventura are well described (Meco et al., Reference Meco, Petit-Maire, Fontugne, Shimmield and Ramos1997; von Suchodoletz et al., Reference von Suchodoletz, Faust and Zöller2009; Muhs et al., Reference Muhs, Budahn, Skipp, Prospero, Patterson and Bettis2010; Faust et al., Reference Faust, Yanes, Willkommen, Roettig, Richter, Suchodoletz and Zöller2015; Roettig et al., Reference Roettig, Kolb, Wolf, Baumgart, Richter, Schleicher, Zöller and Faust2017; Roettig et al. Reference Roettig, Varga, Sauer, Kolb, Wolf, Makowski, Espejo, Zöller and Faust2019). The general influence of climatic processes on sedimentation has been known for a long time. However, the detailed timing of the sedimentary processes responsible for the formation of eolian dune deposits on the Eastern Canary Islands has been a matter of research for many years. Ortiz et al. (Reference Ortiz, Torres, Yanes, Castillo, de la Nuez, Ibáñez and Alonso2006) presented a correlation based on amino acid racemization postulating Late Pleistocene ages of most of the sequences (Fuerteventura, Lanzarote, and the Chinijo Archipelago). Edwards and Meco (Reference Edwards and Meco2000) and Bouab and Lamothe (Reference Bouab and Lamothe1995) discussed a middle- to late Pleistocene dune formation. Until today, the most comprehensive correlation based on stratigraphic findings and luminescence dating includes different dune fields spanning from the western to the eastern coast on northern Fuerteventura (Roettig et al., Reference Roettig, Kolb, Zöller, Zech and Faust2020). Three predominant processes (deposition of carbonate sand, deposition of dust, and water-induced erosion) form a climatological cycle which in their paper is defined as a stratigraphic unit (Roettig et al., Reference Roettig, Varga, Sauer, Kolb, Wolf, Makowski, Espejo, Zöller and Faust2019). Their chrono-stratigraphic correlation encompasses 15 units and dates to ~450 ka. Roettig et al. (Reference Roettig, Varga, Sauer, Kolb, Wolf, Makowski, Espejo, Zöller and Faust2019) derived a sea-level dependency of the dune archives. They attribute highest sand supply to starting sea-level drops and increased dust deposition during periods of rising sea level. On Lanzarote a stratigraphic description exists only from the Mala dune complex (von Suchodoletz et al., Reference von Suchodoletz, Zöller, Hilgers, Radtke, Faust, Fernández-Palacios, de Nascimento, Hernández, Clemente, González and Diaz-González2013). Von Suchodoletz et al. (Reference von Suchodoletz, Zöller, Hilgers, Radtke, Faust, Fernández-Palacios, de Nascimento, Hernández, Clemente, González and Diaz-González2013) discussed middle- to late Pleistocene ages (the dating ranges from ~500 ka to ~50 ka) of the whole Mala dune complex, which encompasses eight so-called palaeosurfaces which are layers that seem related to periods of higher dust supply.
In order to put the sedimentary processes on the Eastern Canary Islands into a context with the well-known late Pleistocene climate development of the northeast Atlantic region, we investigate in this article eolian sediments of Lanzarote to identify possible influences of climatic changes on millennial time scales, such as H Events. The focus of the study is on the multiple dark brown layers rich in dust and iron oxides which initially and for a long time were interpreted as a product of soil formation. This article presents a new interpretation based on new infrared stimulated luminescence (IRSL) age determinations and grain size analyses from a newly sampled Pleistocene dune profile close to the village of Muñique in northern Lanzarote (Fig. 1) and a revision of already published information.
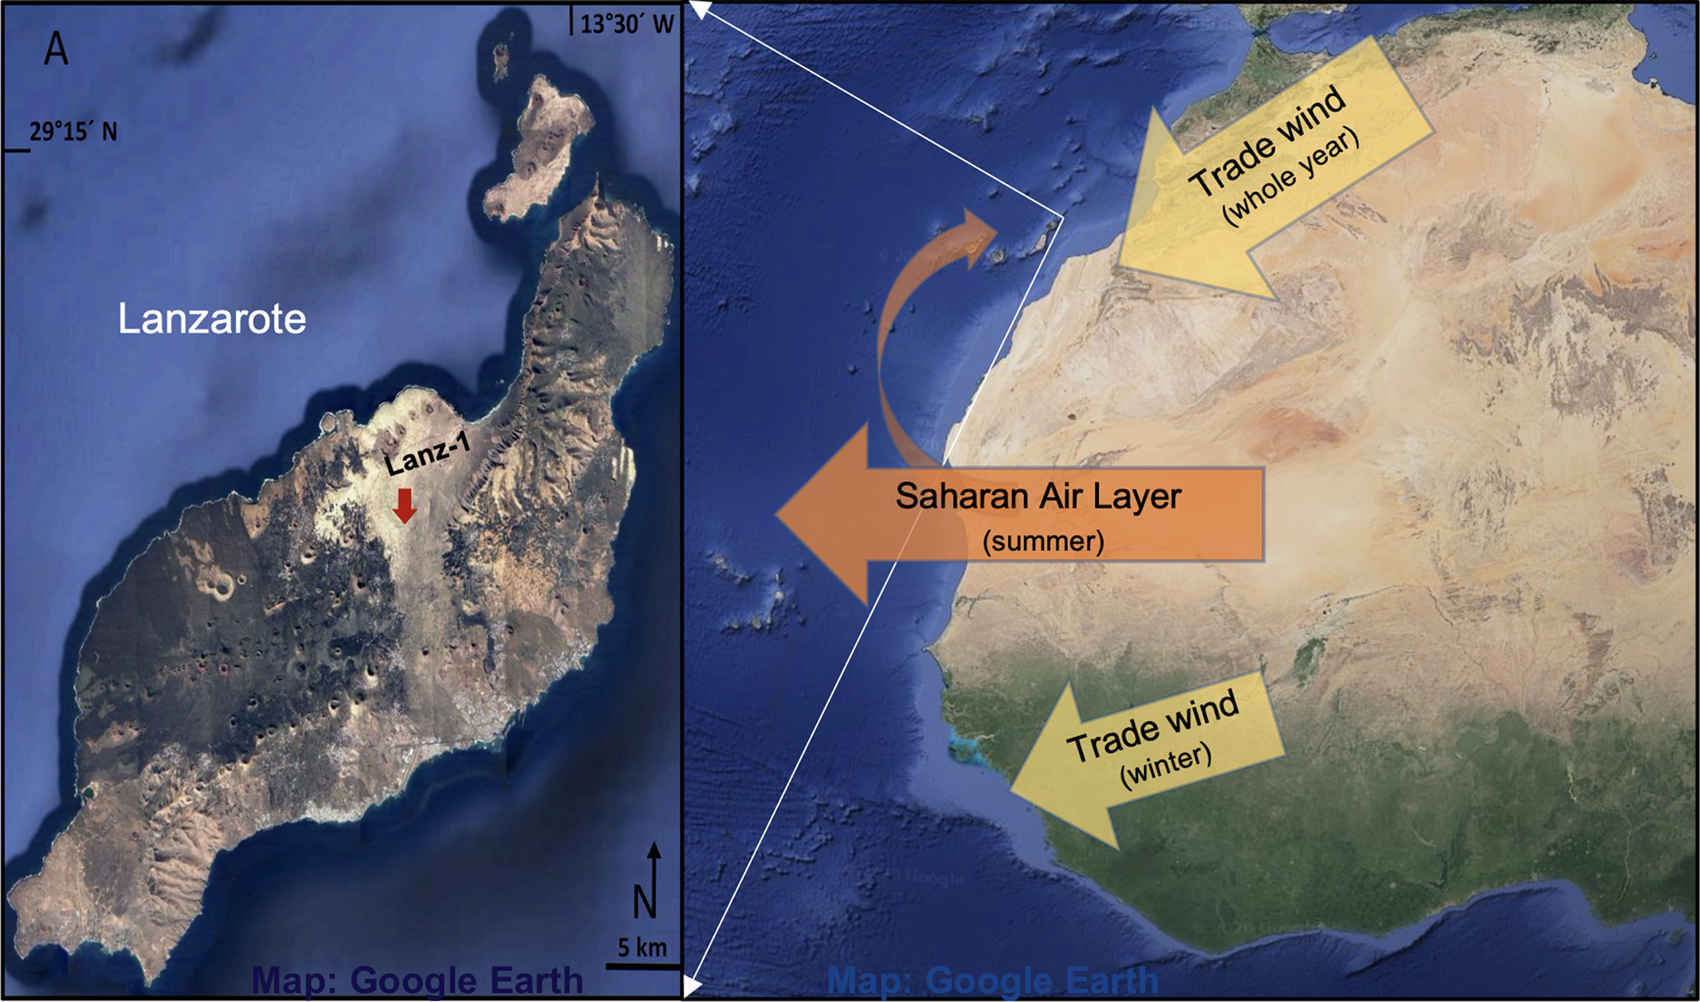
Figure 1. (colour online) Locations of Lanzarote and sampling site Muñique and generalized modern wind system of northwest Africa that supplies dust to the Eastern Canary Islands.
MATERIAL
The eolian dune deposits on the Eastern Canary Islands mainly consist of generations of a variable mixture of biogenic calcareous marine sediments from the island's shelf area and siliceous eolian dusts from Africa (Muhs et al., Reference Muhs, Budahn, Skipp, Prospero, Patterson and Bettis2010; Meco et al., Reference Meco, Muhs, Fontugne, Ramos, Lomoschitz and Patterson2011; Faust et al., Reference Faust, Yanes, Willkommen, Roettig, Richter, Suchodoletz and Zöller2015; Roettig et al., Reference Roettig, Kolb, Wolf, Baumgart, Richter, Schleicher, Zöller and Faust2017; Roettig et al., Reference Roettig, Varga, Sauer, Kolb, Wolf, Makowski, Espejo, Zöller and Faust2019). Volcanic eruptions on the island sometimes added ash. The existence of several sequences of the same type gives an indication of recurring climatic conditions (Damnati, Reference Damnati1997; Roettig et al., Reference Roettig, Kolb, Wolf, Baumgart, Richter, Schleicher, Zöller and Faust2017; Roettig et al., Reference Roettig, Varga, Sauer, Kolb, Wolf, Makowski, Espejo, Zöller and Faust2019).
In spring 2018, a stacked 10 m profile (“Lanz-1”) of eolian deposits was sampled in a sand pit near the village of Muñique on Lanzarote (29°03′56″N, 13°37′02″W) for a new age determination (Figs. 1 and 2). A number of sedimentary sequences can be observed. In general, a sequence consists of three types of deposits (DepoTypes) that are visually different (Ellis and Ellis-Adam, Reference Ellis and Ellis-Adam1993; Edwards and Meco, Reference Edwards and Meco2000; Genise et al., Reference Genise, Alonso-Zarza, Verde and Meléndez2013). The lower two DepoTypes (DepoTypes 1 and 2) of a sequence consist almost exclusively of light yellowish-brown marine biogenic carbonate silts and sands from the adjacent shelf and small amounts of siliceous dust (10YR, Munsell Colour Chart, 1975). The upper of these two layers (DepoType 2) is characterized by a high proportion of terrestrial gastropods and by calcified brood cells of insects (Ellis and Ellis-Adam, Reference Ellis and Ellis-Adam1993; Edwards and Meco, Reference Edwards and Meco2000; Genise et al., Reference Genise, Alonso-Zarza, Verde and Meléndez2013). The top DepoType 3 is a strong brown layer (7.5YR, Munsell Colour Chart, 1975) with land snails and brood cells. Its carbonate content is visibly lower than in the DepoTypes 1 and 2, and the dust content is correspondingly higher. In the profile investigated, only one sequence seems to be complete. DepoType 3 forms prominent hard banks in the outcrop, which are marked as Banks A–C in Figure 2.
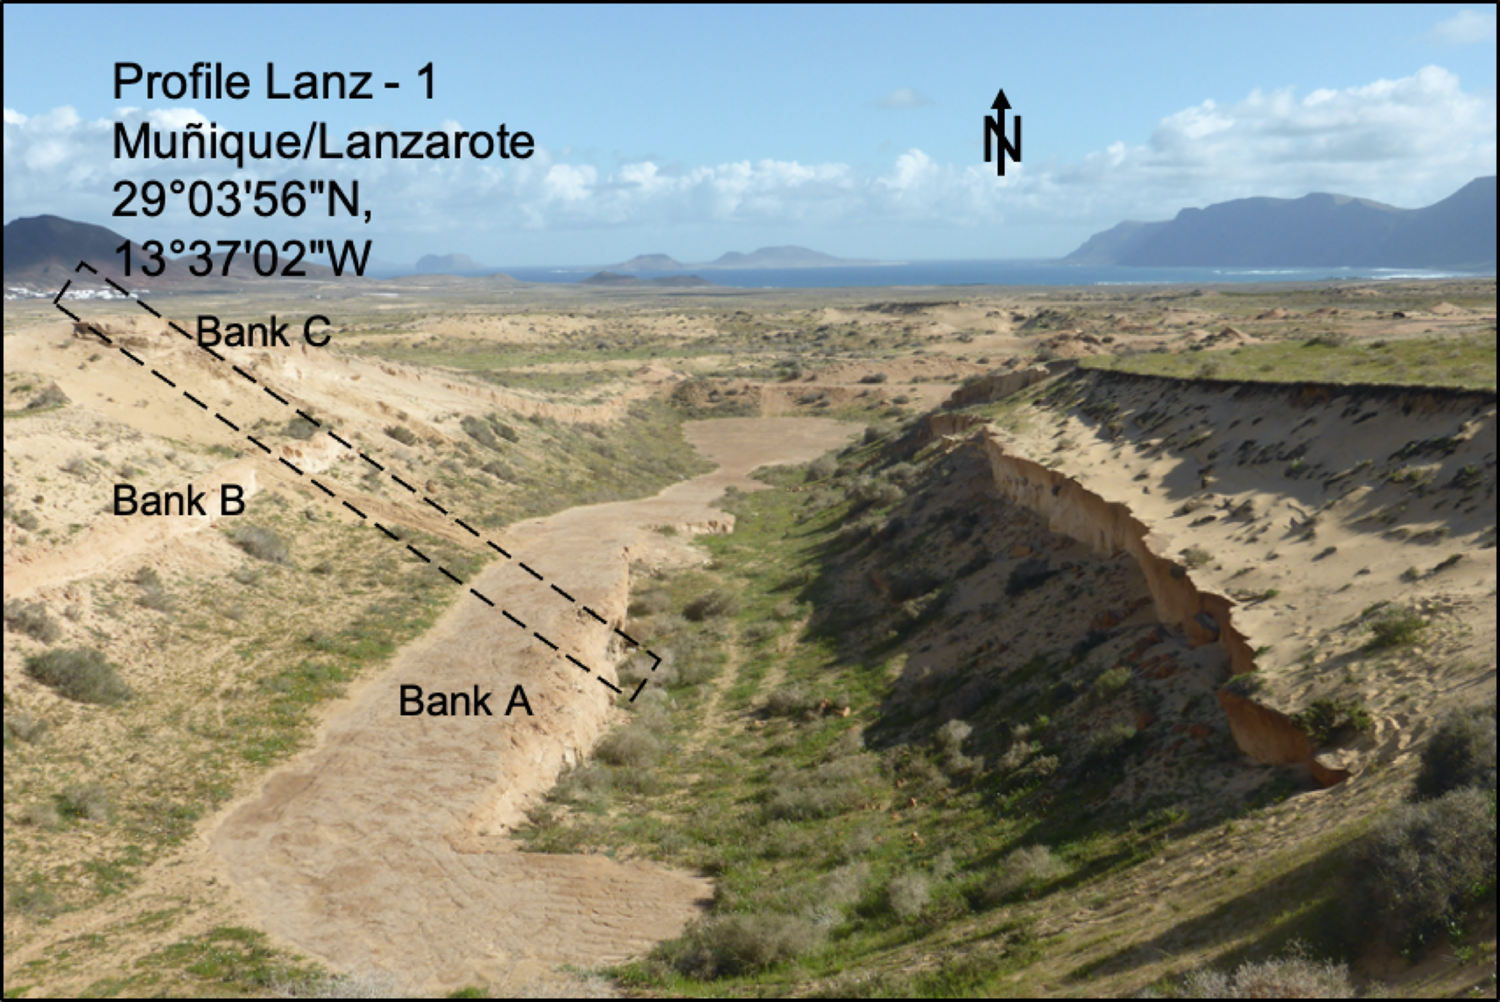
Figure 2. (colour online) Muñique outcrop and position of the stacked profile Lanz-1.
Twenty-four samples were taken from the stacked profile for carbonate content and grain-size analyses. For IRSL dating, three samples were taken from the strong brown layers– samples 6 (BT1707), 13 (BT1708), and 16 (BT1709)–and two samples from the light yellowish-brown parts of the profile– samples 2 (BT1706) and 21 (BT1710).
METHODS
Sediment Colours
Colour description was carried out on wet samples with the Munsell Colour Chart (Munsell Color, 1975).
Determination of carbonate content
The carbonate content of 24 samples was determined with a Scheibler Calcimeter (DIN 18129) after treatment of the air-dried and 2-mm-sieved samples with hydrochloric acid.
Grain size determination
The measurements of grain size distributions of the 24 samples were performed on bulk sediment with the Horiba LA-950 laser diffraction particle size distribution analyser at the GFZ German Research Centre for Geoscience Potsdam. The air-dried samples were suspended with sodium pyrophosphate for 24 hours. Each sample was measured five times. For this study we used the medians of the fivefold measurements per sample. The values encompass 80 classes ranging from 0.058 to 2500 μm.
Infrared stimulated luminescence (IRSL) dating
Both the detrital carbonate sediments and the land snails embedded in the sediment profile cannot be described with certainty as being autochthonous. For each of the components there is a higher probability that older material has been relocated. Thus, using the 14C method for dating would not give reliable ages for the deposition of the DepoType 3 type sediments. Therefore, IRSL dating, which documents the time elapsed since the last exposure of the sediment surface to daylight, was chosen to determine their deposition age. The main caveat of IRSL signals from feldspar is that they are reported to fade over time ('anomalous fading') (Wintle, Reference Wintle1973), causing age underestimation. In this study, however, we employed an IRSL protocol for equivalent dose (D e) estimation for which we could not detect any substantial fading over laboratory time scales.
Samples and sample preparation
Five sediment samples from profile Lanz-1 were taken for luminescence dating to determine their burial age. Sampling was realized by hammering steel tubes horizontally into the cleaned profile and collecting representative material in the surrounding (<30 cm) of the luminescence sample for assessing the environmental dose rate. In the laboratory, sample material extracted from the center of the steel tube was further processed under subdued red light (640 ± 20 nm) conditions following routine methods to isolate polymineral grains in the ~4–11 μm range ('fine grains'; see Supplementary Materials for details).
Dose rate determination
The dose rate was determined on milled (<63 μm) sediment taken from the surrounding of the IRSL sampling holes using thick-source α-counting analysis (Aitken, 1985; Zöller and Pernicka, Reference Zöller and Pernicka1989) for the U and Th concentration as well as inductively coupled plasma - optical emission spectrometry (ICP-OES) for the K concentration. The final dose rate was calculated with the DRAC software (v1.2; Durcan et al., Reference Durcan, King and Duller2015) using parameters as specified in the Supplementary Materials.
Instrumentation and protocols for equivalent dose determination
IRSL was measured with a Risø DA15 TL/OSL reader featuring a DA20 control unit (Bøtter-Jensen et al., Reference Bøtter-Jensen, Andersen, Duller and Murray2003). (See Supplementary Materials for further details).
The protocol applied here to determine the D e was used in an earlier study on Fuerteventura (Faust et al., Reference Faust, Yanes, Willkommen, Roettig, Richter, Suchodoletz and Zöller2015) and builds on previous experience by Preusser (Reference Preusser2003), von Suchodoletz et al. (Reference von Suchodoletz, Fuchs and Zöller2008) and Rother et al. (Reference Rother, Shulmeister and Rieser2010). It is based on a single-aliquot regenerative (SAR) routine (Murray and Wintle, Reference Wintle and Murray2006), including a preheat of 270°C for 120 s prior to IRSL readout for 300 s at 90% LED power. A resting period of 20 minutes between the preheat after artificial irradiation and IRSL measurement aims to minimize or even avoid the problem of anomalous fading (Wintle, Reference Wintle1973) of the feldspar component in the polymineral samples (Faust et al., Reference Faust, Yanes, Willkommen, Roettig, Richter, Suchodoletz and Zöller2015). The protocol with all relevant parameters is shown in Supplementary Table S1.
To test this protocol for its suitability to reproduce known doses with the studied samples, a dose recovery test (DRT) was conducted on sample BT1709. Likewise, fading tests were carried out on the same sample to assess the impact of potential anomalous fading on the D e results. Protocol parameters are described in the Supplementary Materials.
Data reduction to obtain D e values was done using the Analyst program (v4.31.9; Durcan et al., Reference Durcan, King and Duller2015) and taking the first 2 s of the IRSL decay curve minus a background averaged from the last 50 s to construct dose-response curves. These were obtained by fitting a single saturating exponential function to the data points. All aliquots not meeting the acceptance criteria of a recycling ratio within 10% deviation from unity, a recuperation rate <5%, a test dose error <10%, and a signal larger than three times the background were rejected. A systematic uncertainty of 3% was added to the D e value to account for uncertainties in β-source calibration.
Climate Modelling
In a set of glacial/deglacial simulations by Ziemen et al. (Reference Ziemen, Kapsch, Klockmann and Mikolajewicz2019), H Events occurred as internal model. Zieman et al. used a periodically synchronous version of the coupled model system consisting of the coarse resolution climate/dynamical vegetation model ECHAM5 (T31L19)/MPIOM(GR30L40)/LPJ (Mikolajewicz et al., Reference Mikolajewicz, Vizcaíno, Jungclaus and Schurgers2007) coupled to a northern hemisphere set-up of the ice sheet model mPISM (20 km, Ziemen et al., Reference Ziemen, Rodehacke and Mikolajewicz2014). Land sea mask and ocean topography were fixed at 21 ky state; orography, glacier mask, and river routing were interactively coupled. To derive the pattern of a typical H Event, the composite of five individual H Events was computed (Ziemen et al., Reference Ziemen, Kapsch, Klockmann and Mikolajewicz2019).
The composite analysis of wind directions, wind strengths, and precipitation were analysed from a long glacial simulation with a coupled atmosphere–ocean–vegetation–ice sheet model (Ziemen et al., Reference Ziemen, Kapsch, Klockmann and Mikolajewicz2019). In this article, we focus on three different atmospheric pressure levels (925, 775, and 500 hPa) and on precipitation during three phases of the ice shield surges identified (pre-surge, surge, post-surge) which are representative for the two major wind systems that deliver dust to the Canary Islands: the trade wind system close to the ground and the higher Saharan Air Layer. In this study we use only the summer situation (June, July, and August) because dust mobilization in the Sahel occurs mostly during summerly convective weather events (thunderstorms).
RESULTS
Soil Colours
The soil colours according to Munsell (Munsell, 1975) range from a light-yellow brown in the carbonate sands to a dark brown in the clayey dust layers (Table 1).
Table 1. Munsell colours of profile Lanz-1. The characters in the first column indicate the sediment DepoTypes 1 (standard), 2 (standard italics) and 3 (bold).

Carbonate content and grain size
The sediment of Lanz-1 consists mainly of marine biogenic calcareous silt and sands and siliceous eolian dust. Carbonate contents are shown in Table 2 and Figure 4.
Table 2. CaCO3 content and accumulated size classes 0.1–1.0 μm, 1–60 μm and 60–2500 μm (based on Fig. 3). The characters in the first column indicate the sediment DepoTypes 1 (standard), 2 (standard italics) and 3 (bold).


Figure 3. (colour online) Spectra of 80 grain size classes from profile Lanz-1. The size classes can be grouped into three main classes (0.1–1.0, 1–60 and 60–2500 μm) which are separated by grain size classes close to zero. DepoType 1 red lines, DepoType 2 green lines, DepoType 3 blue lines. Gray lines mark DepoType 1 samples 1–3 containing volcanic ash.
The measured 80 size fractions of grain size in the bulk sediment samples can be summarized into three size classes: 0.1–1.0 μm, 1–60 μm, and > 60 μm (Fig. 3). Classes are separated by stretches of concentration close to zero percent. Figure 4 and Table 1 show the grain size distributions of the three classes in all samples. The smallest class (0–1 μm) occurs in all samples and ranges between 0.3 and 11%. The silt class (1–60 μm) is largely lacking in the light-coloured parts of the profile. Within this class the highest amounts of up to 40% occur in the dark brown sediment layers. In the coarsest class (60–2500 μm), minimum values of about 60% occur in the dark brown layers and close to 100% in the lightest part of the profile. The percentages in the three individual classes clearly depend on the type of sediment. With increasing red colouring, i.e., decreasing CaCO3 content, the percentages of the two small classes increase and the coarsest class decreases (Fig. 5). In the lowest part of the profile (samples 1–3), the two classes < 60 μm obviously contain a higher proportion of coarse volcanic ash, so that the carbonate content is significantly reduced. Comparing the sizes of the dominant fraction of a sample, i.e., the measured fraction with the highest amount (%), one observes a coarsening within grain size class 3 from the bottom of the profile towards its top (Fig. 6). Overall, the values in this profile correspond to those usually found in the eolian sediments of Lanzarote and Fuerteventura (von Suchodoletz et al., Reference von Suchodoletz, Oberhänsli, Faust, Fuchs, Blanchet, Goldhammer and Zöller2009; Muhs et al., Reference Muhs, Budahn, Skipp, Prospero, Patterson and Bettis2010; Faust et al., Reference Faust, Yanes, Willkommen, Roettig, Richter, Suchodoletz and Zöller2015; Roettig et al., Reference Roettig, Kolb, Wolf, Baumgart, Richter, Schleicher, Zöller and Faust2017; Roettig et al., Reference Roettig, Varga, Sauer, Kolb, Wolf, Makowski, Espejo, Zöller and Faust2019).


Figure 5. Volume–% of grain size classes 0.1–1.0 μm (squares), 1–60 μm (diamonds) and 60–2500 μm (balls) vs. CaCO3 content (watch the reverse scale of CaCO3). Colours mark sediment DepoTypes 1 (red), 2 (green), and 3 (blue). Gray symbols mark samples with high ash content. Same three numbers sum up to 100%. With increasing volume of the two smaller classes the CaCO3 content decreases. Consequently, the CaCO3 content decreases with decreasing volume of the coarsest class. (For interpretation of the references to colour in this figure legend, the reader is referred to the web version of this article.)

Figure 6. (colour online) The dominant grain size class in the profile Lanz-1 increases from the bottom towards the top. However, this does not necessarily mean an increase in wind speed during deposition.
IRSL dating
The results of the DRT indicate that for sample BT1709 a known dose can be well recovered within 3% deviation for the five aliquots analyzed, and therefore the chosen protocol seems to be appropriate for accurate dose measurements from the sampled sediments at Lanzarote.
The fading test conducted on sample BT1709 indicates that on laboratory time scales there is no detectable IRSL signal loss, or only minor IRSL signal loss, since the fading rates of four out of five analyzed aliquots are <1.2%/decade (see Supplementary Figure S2). The averaged g-value from the five measured aliquots is 1.2 ± 0.7%/decade. These low fading rates and the inherent uncertainties related to the fading correction procedures do not justify the application of such routines for the samples under study. Furthermore, fading rates in the order as determined in this investigation are frequently considered as laboratory artefacts (e.g., Thiel et al., Reference Thiel, Buylaert, Murray, Terhorst, Hofer, Tsukamoto and Frechen2011). Therefore, we infer that the chosen SAR protocol produces IRSL signals with sufficient stability for accurate dating results.
The application of the aliquot acceptance criteria (see the section on instrumentation and protocols, above) leads to acceptance ratios between 36% (BT1706) and 100% (BT1707 and BT1709). Sample BT1710 is an exception, for which about 2/3 of all analyzed aliquots passed the recycling ratio test, but none of them passed the recuperation test with recuperation ratios consistently >6.5%. Therefore, the resulting age has to be treated with caution, and the age inversion in relation to underlying samples might be caused by the poor performance of the SAR protocol for this sample. Overdispersion values for all samples range between 0% and 12%, the latter value being surprising for fine grain separates where averaging effects are supposed to lead to narrow dose distributions (Duller, Reference Duller2008). However, since the reason for this comparatively large spread in D e values remains unclear and cannot be unequivocally attributed to different degrees of bleaching of individual grains, no age model was applied. Instead, the D e value used for age calculation was obtained by calculating the unweighted average of all accepted aliquots. These dose values vary between 27.7 ± 1.3 Gy (BT1710) and 88.0 ± 3.1 Gy (BT1707). A representative D e distribution is shown as an abanico plot (Dietze et al., Reference Dietze, Kreutzer, Burow, Fuchs, Fischer and Schmidt2016) in Supplementary Figure S1b, together with exemplary IRSL decay and dose response curves.
Environmental dose rates are comparatively low with values between 0.83 and 1.53 Gy ka-1, owing to the high content of primary carbonates in the sediments. Resulting ages are listed in Table 3. Lanz-1 profile starts with 58.8 ± 4.6 ka for the lowermost sample BT1706 taken from the lowest part of the profile. Considering 1σ uncertainty levels, this age is younger than that obtained for the overlying sample BT1707 (71.6 ± 4.6 ka; though statistically indistinguishable within 2σ) which derives from a laterite-like layer rich in dust. The following two samples BT1708 and BT1709 are in stratigraphic order and document that the two layers of dark brown sediments accumulated around 36 ka and 24 ka, respectively. The uppermost sample BT1710 showed IRSL characteristics (see above) rendering the obtained age of 33.3 ± 2.4 ka probably unreliable, which might be the cause for the observed age inversion in the upper part of the Lanz-1 section.
Table 3. IRSL ages from profile Lanz-1 and the ages of the respective Heinrich Events.

Wind directions and wind speed
In Ziemen et al. (Reference Ziemen, Kapsch, Klockmann and Mikolajewicz2019), long glacial simulations with the coupled ice sheet–climate–vegetation model mPISM/ECHAM5/MPI-OM/LPJ showed recurring ice-sheet collapses (referred to as H Events in the following text). To describe the typical behaviour of these events, Ziemen et al. performed a composite analysis of several events. Three typical phases of a surge event were identified. The pre-surge phase (maximum ice volume, pre-H Event), the surge phase (maximum ice discharge in the Hudson Strait, H Event), and the post-surge phase (minimal ice-sheet volume in northeastern Canada, post-H Event). Since for all three phases and all events 200-year long time slices were selected and for each of the phases a climatology was computed, the sequences of these climatologies thus represents the climatic behaviour of a typical event in the model.
During the H Events, the model showed a weakening of the AMOC by 3.5 Sv, a general cooling of the northern hemisphere with maximal amplitude in the northern North Atlantic and Europe, a southward shift of the Intertropical Convergence Zone (ITCZ) over the Atlantic, and drier conditions over the Sahel. The atmospheric circulation before, during and after the H Events is shown in three different altitude levels: 925 hPa, 775 hPa, 500 hPa (Fig. 7). The left column shows the metric altitudes of these air pressure levels and the resulting wind vectors before an H Event (Fig. 7a1–a3). The middle (Fig. 7b1–b3) and the right column (Fig. 7c1–c3) show the anomalies in the altitude of the respective air pressure, wind vector against the pre-H Event. Although the differences of H Event and post-H Event relative to the pre-H Event situation are rather small, there are visible signals in both upper layers (Fig. 7b2, c2, and c3) that enhance the likelihood for dust transport events from the subtropical-tropical Sahel towards the Canary Islands to occur. The reason for the weak signals might be that the atmospheric model was not tuned to dust transport. The modelled precipitation during these three stages shows this area of the Sahel zone before an H Event being humid, and during and after an H Event being drier (Fig. 8). The latter reveals this region as a potential source of dust rich in kaolinite and iron oxides.

Figure 7. (colour online) Geopotential heights and wind vectors in three different altitudes of the three ice shield surging phases (H Events) during summer (JJA). Columns a1 –a3 show the geopotential height of three different atmospheric pressure levels and wind vectors. Columns b1–b3 and c1–c3 show the anomalies of all parameters relative to the “pre-H Event” situations during “H Event” and “post-H Event”.

Figure 8. (colour online) Summer season (JJA) precipitation before the H Event, and JJA precipitation changes during and after the H Event. In the change plots, the black outline marks 100 mm/month precipitation before the event.
DISCUSSION
Basically, the Pleistocene dune sediments of Lanzarote (and Fuerteventura) consist of multiple sequences with a three-stage structure (DepoTypes 1–3). DepoType 1 forms the base of a sequence with the highest content of CaCO3 and the lowest dust content. Although there are (uncalcified) brood cells, no other hints of vegetation exist in this DepoType. The lack of traces of vegetation and of dust from the African continent points obviously to rather dry conditions. Unfortunately, the dating in this sediment type with IRSL, as well as with the aminostratigraphical method (Ortiz et al., Reference Ortiz, Torres, Yanes, Castillo, de la Nuez, Ibáñez and Alonso2006), is very problematic, so that no statement can be made about the time or timing of their deposition. In DepoType 2, the granulometric composition of the coarse detrital sediment (i.e., biogenic carbonate sands) remains about the same as in DepoType 1 (Figs. 3–6). The onset of DepoType 2 is indicated by the abrupt appearance of land snails and calcified brood cells, the increase of the dust class (0.1–1 μm) and the appearance of the class with 1–60 μm. In DepoType 2 sediments on Lanzarote and Fuerteventura, the dust fraction consists mainly of illites, with a small amount of kaolinite (5–10%) and iron (Roettig et al., Reference Roettig, Kolb, Wolf, Baumgart, Richter, Schleicher, Zöller and Faust2017). Possibly, a sparse shrub vegetation similar to the present vegetation formed the habitat of the land snails. This type of vegetation presently exists with an average annual precipitation of 116 mm/a and 19 days with rainfall >1 mm (Spanish State Meteorological Agency; Menéndez et al., Reference Menéndez, Pérez-Chacón, Mangas, Tauler, Engelbrecht, Derbyshire, Cana and Alonso2014). Thus, both the gastropod fauna, the lithified brood cells, and the appearance of siliceous dust indicate an increase towards some but still very low precipitation, possibly through changes in the wind system. Since no other calcification than lithified brood cells can be observed in DepoType 2, calciferous pore water flow occurred only over extremely short distances, so that solution and precipitation happened at virtually the same place (see Roettig et al., Reference Roettig, Varga, Sauer, Kolb, Wolf, Makowski, Espejo, Zöller and Faust2019).
The brown clayey DepoType 3 deposits on Lanzarote and Fuerteventura are characterized on average by high contents of iron, quartz, and kaolinite (15–20%). This is much higher than in DepoTypes 1 and 2 (Menéndez et al., Reference Menéndez, Díaz-Hernández, Mangas, Alonso and Sánchez-Soto2007; Muhs et al., Reference Muhs, Budahn, Skipp, Prospero, Patterson and Bettis2010; Menéndez et al., Reference Menéndez, Pérez-Chacón, Mangas, Tauler, Engelbrecht, Derbyshire, Cana and Alonso2014; Roettig et al., Reference Roettig, Kolb, Wolf, Baumgart, Richter, Schleicher, Zöller and Faust2017). Muhs et al. (Reference Muhs, Budahn, Skipp, Prospero, Patterson and Bettis2010) and Roettig and Faust (Reference Roettig and Faust2018) exclude the occurrence of kaolinite on Lanzarote being from soil formation and assumed a higher dust supply from adjacent Africa. A stronger post-depositional soil formation has been unlikely under the relatively dry atmospheric conditions prevailing during the last glacial period in the northeast Atlantic region and in northwest Africa (Mulitza et al., Reference Mulitza, Prange, Stuut, Zabel, von Dobeneck, Itambi, Nizou, Schulz and Wefer2008; Tjallingii et al., Reference Tjallingii, Claussen, Stuut, Fohlmeister, Jahn, Bickert, Lamy and Röhl2008). As in DepoType 2, this is also supported by the general lack of concurrently pedogenic decalcification and CaCO3 enrichment.
Although the grain size measurements were carried out on the total sediment, conclusions on the input of silicate dust can be drawn from the changes in CaCO3 content and grain size classes since no other material exists in the samples. In particular, the size classes 0.1–1 and 1–60 μm are likely to be of completely allochthonous origin, as they do not occur in the profile sections with the highest CaCO3 contents (Figs. 4 and 5). A number of grain size analyses were carried out on marine sediment cores near the Canary Islands (Koopmann, Reference Koopmann1981; Grousset et al., Reference Grousset, Parra, Bory, Martinez, Bertrand, Shimmield and Ellam1998; Holz et al., Reference Holz, Stuut and Henrich2004; McGee et al., Reference McGee, DeMenocal, Winckler, Stuut and Bradtmiller2013; Skonieczny et al., Reference Skonieczny, McGee, Winckler, Bory, Bradtmiller, Kinsley, Polissar, de Pol-Holz, Rossignol and Malaizé2019). Grain sizes of dust range mostly from 2 to 60 μm. Holz et al. (Reference Holz, Stuut and Henrich2004) distinguished three endmembers: 2–20 μm (EM3), 5–60 μm (EM2), and 20–60 μm (EM1). These can be traced to some extent in the particle size spectra of the Lanzarote profile (Fig. 3). EM1 obviously does not exist as a separate class in the Lanzarote profile. In the profile sections with a high proportion of class 1–60 μm, a bimodality can be observed, with a peak at ~2–3 μm and a peak at 10–20 μm. The size class 1–60 μm can therefore be clearly assigned to a wind transport from Africa, analogous to the marine observations. The particle size class 0.1–1 μm was not detected in marine sediments, but this is possibly due to a lack of appropriate measurement technology. We assume that this class is mainly formed by allochthonous kaolinite dust. Authigenous kaolinite is preferably found in this grain size class (Zou and Boley, Reference Zou, Boley and Boley2019). In the Lanz-1 profile, there is a relatively clear assignment of the dust supply to the stratigraphic units. In DepoType 1 deposits, there are only small fractions of the class 0.1–1 μm. With the insertion of DepoType 2, the class 0.1–1 μm increases steadily and the class 1–60 μm becomes visible. Both classes then culminate in DepoType 3, and the change from DepoType 3 to the overlying DepoType 1 is abrupt. However, the increase in dust as well as the rise of the dominant grain size fraction towards the top of the profile cannot necessarily be attributed to an increase in wind speed. The corresponding increase in kaolinite and iron is more indicative of changes in the source area and in the atmosphere.
Roettig et al. (Reference Roettig, Varga, Sauer, Kolb, Wolf, Makowski, Espejo, Zöller and Faust2019) designated these dark brown layers of DepoType 3 as paleosurfaces which were formed during periods of rising sea level with reduced or even stopped carbonate sand deposition. In accordance to Moreno et al. (Reference Moreno, Targarona, Henderiks, Canals, Freudenthal and Meggers2001), they attribute best conditions for dust imprint and weak soil formation to terminations of glacials. Moreno et al. (Reference Moreno, Targarona, Henderiks, Canals, Freudenthal and Meggers2001) identified the influence of the Earth's orbital parameters on the dust supply to the Canary Islands region. However, the new IRSL ages in profile Lanz-1 attach the formation of DepoType 3-type layers to H Events (Table 3). The ages in these layers are clearly consistent with the ages of the H Events HE2, HE4 and HE7a in northeast Atlantic marine deposits and elsewhere (Table 3 and Fig. 9). An age from a nearby, still unprocessed profile Lanz-2 reveals 21.4 ± 1.4 ka that is in good agreement with HE2. There are more publications with age dating of massive dust layers, but these have not been assigned to H Events. For example, at Melián (Fuerteventura), the lower and upper limits of a dust layer were dated 16.6 ± 1.2 and 14.9 ± 1.2 ka, which encloses quite exactly to the period of HE1 (Roettig et al., Reference Roettig, Varga, Sauer, Kolb, Wolf, Makowski, Espejo, Zöller and Faust2019). Aminostratigraphic age determinations carried out on snails in dune sediments of the eastern Canary Islands have revealed similar ages (Ortiz et al., Reference Ortiz, Torres, Yanes, Castillo, de la Nuez, Ibáñez and Alonso2006). Although these ages are under discussion (Meco et al., Reference Meco, Muhs, Fontugne, Ramos, Lomoschitz and Patterson2011), some of the dust layers have approximately the same ages as the H Events 1 to 4, but with relatively large uncertainty ranges. However, an assignment to H Events did not take place. Neither study reveals any signs of higher-frequent climatic information, such as Dansgaard-Oeschger events, although the latter occur in marine sediments on northwest Africa and the African continental margin (Carlson and Prospero, Reference Carlson and Prospero1972; Prospero and Mayol-Bracero, Reference Prospero and Mayol-Bracero2013; Jaramillo-Vélez et al., Reference Jaramillo-Vélez, Menéndez, Alonso, Mangas and Hernández-León2016; Weinzierl et al., Reference Weinzierl, Ansmann, Prospero, Althausen, Benker, Chouza, Dollner, Farrell, Fomba and Freudenthaler2017) Interestingly, although the amino ages of Ortiz et al. (Reference Ortiz, Torres, Yanes, Castillo, de la Nuez, Ibáñez and Alonso2006) were determined on snails, the ages between the dust horizons are mostly younger than the ages retrieved from the dust layers above, comparable to the IRSL ages. One possible explanation could be that DepoTypes 1 and 2 contain much older, relocated material.

Figure 9. IRSL ages and their relation to H Events. The two vertical colour bars propose a sedimentary (dust: brown high content) and climatological (humidity: green higher humidity) evolution of the profile Lanz-1. The colour bar on the left marks DepoType 1 (red), DepoType 2 (green) and DepoType 3 (blue). H Events 3 to 6 are not detectable at this site. The graph exhibits a saw-toothed sedimentary and climatological evolution rather than a sinoidal evolution. (For interpretation of the references to colour in this figure legend, the reader is referred to the web version of this article.)
The wind regime in the Canary Islands is determined by the trade wind that blows close to the surface from north-east and by the Saharan Air Layer which results in easterly winds (Fig. 1; Carlson and Prospero, Reference Carlson and Prospero1972; Prospero and Mayol-Bracero, Reference Prospero and Mayol-Bracero2013; Jaramillo-Vélez et al., Reference Jaramillo-Vélez, Menéndez, Alonso, Mangas and Hernández-León2016; Weinzierl et al., Reference Weinzierl, Ansmann, Prospero, Althausen, Benker, Chouza, Dollner, Farrell, Fomba and Freudenthaler2017). The Calima is a component of the Saharan Air Layer. In the summer it mainly brings dry, hot air and silty dust (Carlson and Prospero, Reference Carlson and Prospero1972; Prospero and Mayol-Bracero, Reference Prospero and Mayol-Bracero2013; Jaramillo-Vélez et al., Reference Jaramillo-Vélez, Menéndez, Alonso, Mangas and Hernández-León2016; Weinzierl et al., Reference Weinzierl, Ansmann, Prospero, Althausen, Benker, Chouza, Dollner, Farrell, Fomba and Freudenthaler2017). The source areas of the dust can be identified by its mineral composition; dust from the Sahara is dominated by illite, dust from the Sahel by kaolinite (Stager et al., Reference Stager, Ryves, Chase and Pausata2011; Bouimetarhan et al., Reference Bouimetarhan, Prange, Schefuß, Dupont, Lippold, Mulitza and Zonneveld2012). The particle size distributions of the dust depend essentially on the particle size, the length of the transport path, and the wind force (Stager et al., Reference Stager, Ryves, Chase and Pausata2011; Bouimetarhan et al., Reference Bouimetarhan, Prange, Schefuß, Dupont, Lippold, Mulitza and Zonneveld2012).
During the last glacial maximum (LGM), the transport of dust is estimated to have been up to 90% greater than it is today (Stager et al., Reference Stager, Ryves, Chase and Pausata2011; Bouimetarhan et al., Reference Bouimetarhan, Prange, Schefuß, Dupont, Lippold, Mulitza and Zonneveld2012). For the area of the Canary Islands, Stager et al. and Bouimetarhan et al. modelled a dust deposition of about 10 g/m2/year. McGee et al. (Reference McGee, DeMenocal, Winckler, Stuut and Bradtmiller2013), Williams et al. (Reference Williams, McGee, Kinsley, Ridley, Hu, Fedorov, Tal, Murray and DeMenocal2016) and Skonieczny et al. (Reference Skonieczny, McGee, Winckler, Bory, Bradtmiller, Kinsley, Polissar, de Pol-Holz, Rossignol and Malaizé2019) estimated the dust during LGM to be two to four times higher than today. Stager et al. (Reference Stager, Ryves, Chase and Pausata2011) and Bouimetarhan et al. (Reference Bouimetarhan, Prange, Schefuß, Dupont, Lippold, Mulitza and Zonneveld2012) identified no difference in the spatial structure of dust transport during the LGM. However, it is important to mention that the LGM is not equivalent to a H Event. Especially during H Events 1 and 2, the climate in the northern hemisphere was more extreme than during the LGM (McGee et al., Reference McGee, DeMenocal, Winckler, Stuut and Bradtmiller2013; Williams et al., Reference Williams, McGee, Kinsley, Ridley, Hu, Fedorov, Tal, Murray and DeMenocal2016; Skonieczny et al., Reference Skonieczny, McGee, Winckler, Bory, Bradtmiller, Kinsley, Polissar, de Pol-Holz, Rossignol and Malaizé2019). Consequently, the climatic conditions of the LGM cannot easily be compared with those of a H Event.
McGee et al. (Reference McGee, DeMenocal, Winckler, Stuut and Bradtmiller2013), Williams et al. (Reference Williams, McGee, Kinsley, Ridley, Hu, Fedorov, Tal, Murray and DeMenocal2016), and Skonieczny et al. (Reference Skonieczny, McGee, Winckler, Bory, Bradtmiller, Kinsley, Polissar, de Pol-Holz, Rossignol and Malaizé2019) presumed dust transport from the Sahel to the Canary Islands within a glaciation through a high-pressure cell above the Sahara which formed during winter times. However, in the Sahel zone dust is mobilized during summer by convective weather events (thunderstorms) that lift dust to greater heights; the dust is then transported across the Atlantic Ocean (von Suchodoletz et al., Reference von Suchodoletz, Fuchs and Zöller2008, Reference von Suchodoletz, Oberhänsli, Hambach, Zöller, Fuchs and Faust2010). The enhanced dust mobilization and deposition during H Events is supported by elevated dust deposition on the marine northwest African continental margin (McGee et al., Reference McGee, DeMenocal, Winckler, Stuut and Bradtmiller2013; Williams et al., Reference Williams, McGee, Kinsley, Ridley, Hu, Fedorov, Tal, Murray and DeMenocal2016; Skonieczny et al., Reference Skonieczny, McGee, Winckler, Bory, Bradtmiller, Kinsley, Polissar, de Pol-Holz, Rossignol and Malaizé2019) and in the Mid-Atlantic Ocean (Middleton et al., Reference Middleton, Mukhopadhyay, Langmuir, McManus and Huybers2018). Von Suchodoletz et al. (Reference von Suchodoletz, Fuchs and Zöller2008 and Reference von Suchodoletz, Oberhänsli, Hambach, Zöller, Fuchs and Faust2010) have identified a link between dust supply from the Sahel and the climatic variability in northeast Atlantic region during glaciations. Roettig et al. (Reference Roettig, Varga, Sauer, Kolb, Wolf, Makowski, Espejo, Zöller and Faust2019) interpreted the elevated contents of iron, quartz, illite, and especially kaolinite in the DepoType 3 deposits as an increased dust supply from the Sahara. The content of kaolinite and iron in African soils increases from the Sahara towards the subtropical-tropical Sahel (Ojanuga, Reference Ojanuga1979; Caquineau et al., Reference Caquineau, Gaudichet, Gomes, Magonthier and Chatenet1998; Muhs et al., Reference Muhs, Budahn, Skipp, Prospero, Patterson and Bettis2010; Scheuvens et al., Reference Scheuvens, Schütz, Kandler, Ebert and Weinbruch2013; Formenti et al., Reference Formenti, Caquineau, Desboeufs, Klaver, Chevaillier, Journet and Rajot2014; Ravelo-Pérez et al., Reference Ravelo-Pérez, Rodríguez, Galindo, García, Alastuey and López-Solano2016). Thus, while at present the Saharan dust is generally richer in mica than in kaolinite (McManus et al., Reference McManus, Oppo and Cullen1999; Bard et al., Reference Bard, Rostek, Turon and Gendreau2000; de Abreu et al., Reference de Abreu, Shackleton, Schönfeld, Hall and Chapman2003; Naughton et al., Reference Naughton, Sánchez Goñi, Kageyama, Bard, Duprat, Cortijo, Desprat, Malaizé, Joly and Rostek2009; Voelker et al., Reference Voelker, de Abreu, Schönfeld, Erlenkeuser and Abrantes2009; Rodrigues et al., Reference Rodrigues, Alonso-García, Hodell, Rufino, Naughton, Grimalt, Voelker and Abrantes2017), there must have been a modification in the source area of the dust during H Events. Therefore, it seems plausible that beginning with DepoType 2, the subtropical/tropical Sahel zone with its latosols is a dust source area of growing importance, reaching maximum importance during H Events. The onset of a vegetational cover in DepoType 2 and into DepoType 3 could be a joint effect of increasing precipitation and an increasing supply of dust, which included fertilizing iron and phosphate (McManus et al., Reference McManus, Oppo and Cullen1999; Bard et al., Reference Bard, Rostek, Turon and Gendreau2000; de Abreu et al., Reference de Abreu, Shackleton, Schönfeld, Hall and Chapman2003; Naughton et al., Reference Naughton, Sánchez Goñi, Kageyama, Bard, Duprat, Cortijo, Desprat, Malaizé, Joly and Rostek2009; Voelker et al., Reference Voelker, de Abreu, Schönfeld, Erlenkeuser and Abrantes2009; Rodrigues et al., Reference Rodrigues, Alonso-García, Hodell, Rufino, Naughton, Grimalt, Voelker and Abrantes2017). To what extent sediment from the African continental shelf contributed to the dust deposition on the Canary Islands during low sea levels can be determined neither from the literature nor from our own investigations. Air-borne and river-borne sediments from the Sahel were deposited on the shelf and there is a similarity in the grain size distribution in the <100 μm fraction of dust on the Canary Islands (this study) and in marine deposits (McManus et al., Reference McManus, Oppo and Cullen1999; Bard et al., Reference Bard, Rostek, Turon and Gendreau2000; de Abreu et al., Reference de Abreu, Shackleton, Schönfeld, Hall and Chapman2003; Naughton et al., Reference Naughton, Sánchez Goñi, Kageyama, Bard, Duprat, Cortijo, Desprat, Malaizé, Joly and Rostek2009; Voelker et al., Reference Voelker, de Abreu, Schönfeld, Erlenkeuser and Abrantes2009; Rodrigues et al., Reference Rodrigues, Alonso-García, Hodell, Rufino, Naughton, Grimalt, Voelker and Abrantes2017). However, the African shelf is dominated by silicate sediment, making it less of a source of dust for the Canary Islands, especially in DepoTypes 1 and 2 (Jullien et al., Reference Jullien, Grousset, Malaizé, Duprat, Sanchez-Goñi, Eynaud, Charlier, Schneider, Bory and Bout2007; Deplazes et al., Reference Deplazes, Lückge, Peterson, Timmermann, Hamann, Hughen, Röhl, Laj, Cane and Sigman2013; Handiani et al. Reference Handiani, Paul, Prange, Merkel, Dupont and Zhang2013; Blazey et al., Reference Blazey, Paul, Liu and Prange2014).
The oceanic archives indicate colder climatic conditions in the northeastern Atlantic Ocean during the last glacial than are present today (McManus et al., Reference McManus, Oppo and Cullen1999; Bard et al., Reference Bard, Rostek, Turon and Gendreau2000; de Abreu et al., Reference de Abreu, Shackleton, Schönfeld, Hall and Chapman2003; Naughton et al., Reference Naughton, Sánchez Goñi, Kageyama, Bard, Duprat, Cortijo, Desprat, Malaizé, Joly and Rostek2009; Voelker et al., Reference Voelker, de Abreu, Schönfeld, Erlenkeuser and Abrantes2009; Rodrigues et al., Reference Rodrigues, Alonso-García, Hodell, Rufino, Naughton, Grimalt, Voelker and Abrantes2017). Based on the available information, a basic picture of the development of dune sedimentation during abruptly changing Pleistocene climatic conditions on Lanzarote can now be constructed (Fig. 10). The cold atmospheric conditions above the very cold North Atlantic Ocean shifted during these periods down to the southern limit of the Sahara, creating stadial climatic conditions (Collins et al., Reference Collins, Govin, Mulitza, Heslop, Zabel, Hartmann, Röhl and Wefer2013). During the H Events, the tropical rain belt (ITCZ) was more southern than it is today (Jullien et al., Reference Jullien, Grousset, Malaizé, Duprat, Sanchez-Goñi, Eynaud, Charlier, Schneider, Bory and Bout2007; Deplazes et al., Reference Deplazes, Lückge, Peterson, Timmermann, Hamann, Hughen, Röhl, Laj, Cane and Sigman2013; Handiani et al., Reference Handiani, Paul, Prange, Merkel, Dupont and Zhang2013; Blazey et al., Reference Blazey, Paul, Liu and Prange2014). The increase in the grain size class 1–60 μm in DepoTypes 2 and 3 in profile Lanz-1 could be an indicator of an increasing storminess (Bozzano et al., Reference Bozzano, Kuhlmann and Alonso2002; Bouimetarhan et al., Reference Bouimetarhan, Prange, Schefuß, Dupont, Lippold, Mulitza and Zonneveld2012). A more southerly track of the Westerlies could be responsible for the slightly more humid conditions during DepoTypes 2 and 3, too (Naughton et al., Reference Naughton, Sánchez Goñi, Kageyama, Bard, Duprat, Cortijo, Desprat, Malaizé, Joly and Rostek2009). However, the annual precipitation arriving on Lanzarote probably has been rather low. The polar jet stream, which marks the boundary between the polar and the subtropical atmosphere, reached its most southerly position during the H Events (Naughton et al., Reference Naughton, Sánchez Goñi, Kageyama, Bard, Duprat, Cortijo, Desprat, Malaizé, Joly and Rostek2009; Ziemen et al., Reference Ziemen, Kapsch, Klockmann and Mikolajewicz2019). According to Ziemen et al. (Reference Ziemen, Kapsch, Klockmann and Mikolajewicz2019), during and after H Events wind vectors at the 775 hPa and 500 hPa levels representative for the Saharan Air Layer (SAL) allowed dust transport from the subtropical-tropical Sahel zone towards the Canary Islands only in summer. Although the change in the wind vectors at the 775 hPa and 500 hPa levels (relative to the pre-H Event situation) during and past a H Event is not particularly pronounced (Figs. 7b1, b2, c1, c2), there is a high probability of this transportation route as can be inferred from the general mineralogical and chemical composition of the DepoType 3-type deposits on the Canary Islands. Thus, according to the model results of Ziemen et al. (Reference Ziemen, Kapsch, Klockmann and Mikolajewicz2019), it seems evident that during H Events the atmospheric dynamics with respect to dust mobilization by summer thunderstorms were quite similar to the present-day observations of Gasse (Reference Gasse2000), Mulitza et al. (Reference Mulitza, Prange, Stuut, Zabel, von Dobeneck, Itambi, Nizou, Schulz and Wefer2008), Tjallingii et al. (Reference Tjallingii, Claussen, Stuut, Fohlmeister, Jahn, Bickert, Lamy and Röhl2008), Itambi et al. (Reference Itambi, von Dobeneck, Mulitza, Bickert and Heslop2009), Naughton et al. (Reference Naughton, Sánchez Goñi, Kageyama, Bard, Duprat, Cortijo, Desprat, Malaizé, Joly and Rostek2009), and Bouimetarhan et al. (Reference Bouimetarhan, Prange, Schefuß, Dupont, Lippold, Mulitza and Zonneveld2012), but with a more southerly source area of dust than today. In addition, due to the modelled dryer conditions during and perhaps directly after a surge event (Fig. 8), together with stronger trade winds and an intensified African Easterly Jet (AEJ), the Sahel had been a much larger source of dust than during the humid periods prior to H Events (Gasse, Reference Gasse2000; Mulitza et al., Reference Mulitza, Prange, Stuut, Zabel, von Dobeneck, Itambi, Nizou, Schulz and Wefer2008; Tjallingii et al. Reference Tjallingii, Claussen, Stuut, Fohlmeister, Jahn, Bickert, Lamy and Röhl2008; Itambi et al., Reference Itambi, von Dobeneck, Mulitza, Bickert and Heslop2009; Naughton et al., Reference Naughton, Sánchez Goñi, Kageyama, Bard, Duprat, Cortijo, Desprat, Malaizé, Joly and Rostek2009; Bouimetarhan et al., Reference Bouimetarhan, Prange, Schefuß, Dupont, Lippold, Mulitza and Zonneveld2012). A generalized scheme of the wind situation and the mineralogy of the source areas is given in Figure 10. Subsequent to a H Event, when the AMOC resumed and the North Atlantic Ocean became warmer, the atmospheric system moved back to its most northerly interstadial position. This was obviously a phase of stronger trade winds and the driest climatic conditions on the Canary Islands responsible for the formation of DepoType 1, as can also be seen on the Iberian Peninsula (Naughton et al., Reference Naughton, Sánchez Goñi, Kageyama, Bard, Duprat, Cortijo, Desprat, Malaizé, Joly and Rostek2009).

Figure 10. (colour online) Generalized wind system supplying dust to Lanzarote during H Events and mineralogical composition of the source areas (compare with Figure 1).
CONCLUSION
With the help of new age determinations, grain size analyses from the Lanz-1 profile, atmospheric data extracted from a published model study, and support provided by data from earlier works on the Pleistocene dune sediments, a new interpretation of the dunes’ depositional conditions can be justified. The genesis of the dark brown, highly dusty sediment layers (DepoType 3 in this paper) does not appear to be the result of autochthonous soil or surface formation (Criado et al., Reference Criado, Torres, Hansen, Lillo and Naranjo2012; Roettig et al., Reference Roettig, Varga, Sauer, Kolb, Wolf, Makowski, Espejo, Zöller and Faust2019). The sediment layers are now interpreted as the consequence of changes in atmospheric conditions over northwest Africa and the North Atlantic during H Events that led to a strong dust transport rich in kaolinite and iron compounds from the Sahel towards the Eastern Canary Islands.
The strongly changing climatic conditions on millennial time scales during the glaciations obviously had a major influence on the eolian sedimentary conditions and the source areas of the dust delivered to the Canary Islands. The alternation of Heinrich stadials and interstadials, which originated from repetitive collapses of the North Atlantic ice sheets producing very cold North Atlantic surface water and the successive resumption of the AMOC with its temperate surface water led obviously to a three-stage sequential depositional history of eolian sediments on the Canary Islands. Recent dating of Pleistocene eolian sediments from an outcrop near Muñique/Lanzarote clearly shows that in a depositional sequence the dust content in the DepoType 3-type deposits mainly originated from elevated supplies from the subtropical/tropical Sahel zone during H Events rather than from soil formation. From the results of the particle size analysis it can be concluded that, with the start of DepoType 2, dust was increasingly transported from the Sahel towards the Canary Islands. The peak was reached in DepoType 3. Wind data extracted from a modelling study on the behaviour of the polar jet before, during and after a H Event provide supporting evidence for a modified atmospheric system that allows dust transport during and after ice sheet collapses from the Sahel towards the Canary Islands. Except for DepoType 3, the internal timing of the eolian sequences is difficult or even impossible to achieve when using IRSL dating because of the lack of sufficient dust in DepoTypes 1 and 2 for dating. Thus, based on the IRSL ages collected on Lanzarote it remains unclear to which particular climatic states DepoTypes 1 and 2 can be attributed. DepoType 1 seems to be the driest phase, since neither gastropods nor calcified brood cells occur. Assuming a climatic development similar to the western Iberian Peninsula, the climatic conditions at Lanzarote's DepoType 1 could be attributed to the northward retreat of the polar jet after a H event. In DepoType 2 the occurrence of terrestrial gastropods, similar to those living today on a sparse shrub vegetation, indicates slightly increased precipitation as a consequence of an increasing cooling of the North Atlantic prior to a H Event and a successive southward migration of the polar jet. The peak of the southern shift of climate zones that enables Latosol dust transport from the southern Sahel to the Canary Islands is in DepoTypes 3 during H Events. The absence of H Events between 36 and 71 ka, either due to erosion or non-deposition, cannot be explained from the Lanz-1 profile.
ACKNOWLEDGMENTS
The fieldwork was supported by Julia Schlösser and Luisa Zenker (Technische Universität Dresden). The grain size analyses were carried out by Michael Dietze and Carolin Zorn (GeoForschungsZentrum Potsdam). We thank Dominik Faust (Technische Universität Dresden), Inmaculata Menéndez González and Laura Cabrera Vega (Universidad de Las Palmas de Gran Canaria) for fruitful discussions.
This work was financially supported by the German Research Foundation (FA 239/23-1; TU Dresden) and by the German Federal Ministry of Education and Research (BMBF) as a Research for Sustainability initiative (FONA) through the project PalMod (FKZ: 01LP1502A; MPI Hamburg).
SUPPLEMENTARY MATERIAL
The supplementary material for this article can be found at https://doi.org/10.1017/qua.2020.100


