


INTRODUCTION
Although several hypotheses have been proposed to explain how seasonality affects the population cycles of tropical insects, this subject is still not fully understood (Kishimoto-Yamada & Itioka Reference KISHIMOTO-YAMADA and ITIOKA2015, Wolda Reference WOLDA1988). In tropical areas, the abundance of insects is principally determined by abiotic factors such as photoperiod, temperature and rainfall (Wolda Reference WOLDA1988). Rainfall is considered an important factor influencing insect populations even in non-tropical sites (Kishimoto-Yamada & Itioka Reference KISHIMOTO-YAMADA and ITIOKA2015). This is particularly evident in fauna that exhibit seasonal cycles in abundance, which are primarily the product of alternating dry and wet seasons (Dingle et al. Reference DINGLE, ROCHESTER and ZALUCKI2000, Pearson & Carroll Reference PEARSON and CARROLL1998). Nevertheless, seasonality of temperature increases as we move away from the tropics and few studies have attempted to disentangle the relative importance of temperature and rainfall in determining richness and abundance of insects in these areas.
In tall forests, canopy and understorey have been shown to present distinct microclimate (e.g. temperature, solar exposure, humidity) and food resources (Smith Reference SMITH1973). This difference, together with ecological interactions such as predation and competition, may explain the differential distributions of species from ground level up to the canopy (Basset et al. Reference BASSET, NOVOTNY, MILLER and KITCHING2003, Stork & Grimbacher Reference STORK and GRIMBACHER2007). Vertical stratification has already been reported for several animal groups (Bernard Reference BERNARD2001, Vieira & Monteiro-Filho Reference VIEIRA and MONTEIRO-FILHO2003, Walther Reference WALTHER2002), especially insects (Brehm Reference BREHM2007, Charles & Basset Reference CHARLES and BASSET2005, McKey Reference MCKEY, Hallé and Pascal1991, Roisin et al. Reference ROISIN, DEJEAN, CORBARA, ORIVEL, SAMANIEGO and LEPONCE2006, Tregidgo et al. Reference TREGIDGO, QIE, BARLOW, SODHI and LIM2010).
Fruit-feeding butterflies (sensu DeVries Reference DEVRIES1987, Freitas et al. Reference FREITAS, ISERHARD, SANTOS, CARREIRA, RIBEIRO, MELO, ROSA, MARINI-FILHO, ACCACIO and UEHARA-PRADO2014) have been shown to exhibit vertically stratified distributions in several tropical forests (DeVries Reference DEVRIES1988, DeVries & Walla Reference DEVRIES and WALLA2001, Fermon et al. Reference FERMON, WALTERT, VANE-WRIGHT and MÜHLENBERG2005, Molleman et al. Reference MOLLEMAN, ARJAN, BRAKEFIELD, DEVRIES and ZWAAN2006, Ribeiro & Freitas Reference RIBEIRO and FREITAS2012). The guild can be easily captured using traps baited with rotten fruit, allowing standardized sampling and comparable results across different surveys (Freitas et al. Reference FREITAS, ISERHARD, SANTOS, CARREIRA, RIBEIRO, MELO, ROSA, MARINI-FILHO, ACCACIO and UEHARA-PRADO2014). Fruit-feeding butterflies are thus considered an excellent model for ecological studies, environmental monitoring and conservation practices (Bonebrake et al. Reference BONEBRAKE, PONISIO, BOGGS and EHRLICH2010, Brown Reference BROWN, Collins and Thomas1991, Santos et al. Reference SANTOS, MARINI-FILHO, FREITAS and UEHARA-PRADO2016, Uehara-Prado et al. Reference UEHARA-PRADO, BROWN and FREITAS2007). Previous research indicates that species composition is consistently partitioned between canopy and understorey, but these studies were mostly performed in tropical forests at low latitudes (DeVries Reference DEVRIES1988, DeVries & Walla Reference DEVRIES and WALLA2001, Ribeiro & Freitas Reference RIBEIRO and FREITAS2012). Forests at the edge of the tropics, where the influence of temperature is more pronounced, have yet to be studied.
In the present study, we describe the stratification of fruit-feeding butterflies in a seasonal tropical forest, and test whether heterogeneity of climatic conditions between canopy and understorey and the seasonal variation of abiotic factors predict local community diversity. Specifically, we address the following hypotheses: (1) Fruit-feeding butterfly assemblages will be distinct between canopy and understorey in the Atlantic Forest, and there will be differences in abundance and species composition between the two vertical strata. (2) If rainfall determines temporal variability in species cycles, we expect the canopy to exhibit higher species turnover through time due to harsh conditions in dry seasons. However, if temperature determines species cycles, we expect the understorey to exhibit higher species turnover, due to lower temperatures in the cold season.
METHODS
Study area
The Atlantic Forest encompasses significant latitudinal and altitudinal gradients, and includes several different physiognomies, from evergreen to seasonally dry forests (Morellato & Haddad Reference MORELLATO and HADDAD2000). Fieldwork was carried out in the Serra do Japi Biological Reserve (centred at 23°13′52″S, 46°56′08″W), Jundiaí, in the state of São Paulo, south-eastern Brazil. Comprising nearly 28000 ha, it is among the last extensive areas of continuous forest in the interior of the state (Morellato Reference MORELLATO and Morellato1992a). The study site is mostly covered by semideciduous mesophytic forest in different stages of succession, and ranges in altitude from 700 m to 1300 m asl. The semideciduous forest has trees of about 20 m high, with some emergent trees reaching up to 30 m high. The understorey is a dense stratum composed of shade-tolerant species of shrubs and herbaceous plants (Morellato Reference MORELLATO1992b). The climate is seasonal, with a cold-dry season from April to September and a warm-wet season from October to March (Morellato & Leitão-Filho Reference MORELLATO, LEITÃO-FILHO and Morellato1992), and with an average annual rainfall of ~1500 mm and mean temperature of 19°C (Pinto Reference PINTO and Morellato1992).
Butterfly sampling
The sampling protocol is similar to that of DeVries et al. (Reference DEVRIES, WALLA and GREENEY1999) and Ribeiro & Freitas (Reference RIBEIRO and FREITAS2012). Sampling was carried out monthly over 1 y (October 2011–September 2012). Six transects were selected, with each transect comprising a sampling unit (SU). Ten traps were installed at 20 m intervals along each transect (a total of 60 traps), alternating between understorey (1.5 m above the ground) and canopy (~12 m above the ground, inside canopy tree crowns). Traps within the same stratum were thus separated by 40 m, in order to avoid interference due to attractiveness of neighbouring traps. The bait consisted of a mixture of banana and sugar cane juice, which was fermented for 48 h before sampling. Traps were checked every 48 h, with baits replaced at each visit. All traps were kept open simultaneously in the field (four complete sampling days for each trap per month), totalling 2880 trap days (10 traps × 6 transects × 4 d × 12 mo). The temperature of the base of each trap was measured on every sampling day with an infrared thermometer (Scan Temp ST-600, Incoterm®) to estimate the variation in temperature between canopy and understorey. The majority of butterflies were identified to subfamily, tribe and species in the field and had their gender recorded. They were then assigned a unique number on the forewing in case of recapture, before being released. However, butterflies with uncertain species identity or those representing new records for the study site were collected for later identification (less than 2% of the total), and subsequently deposited in the Museu de Zoologia ‘Adão José Cardoso’, at Universidade Estadual de Campinas (Unicamp).
Data analysis
Diversity parameters, including species richness, abundance, diversity and species composition, were used to assess the differences of butterfly assemblages between vertical strata. Species richness was compared by a combined individual-based interpolation and extrapolation approach (Colwell et al. Reference COLWELL, CHAO, GOTELLI, LIN, MAO, CHAZDON and LONGINO2012). Extrapolating the species-accumulation curve (SAC) of the less-complete sample allows more robust inferences than rarefying the curve of more complete samples (Chao & Jost Reference CHAO and JOST2012, Colwell et al. Reference COLWELL, CHAO, GOTELLI, LIN, MAO, CHAZDON and LONGINO2012). SAC analyses were performed with 300 bootstrap re-samplings, using iNext software. In addition, sample coverage was adopted as an indicator of sample quality (Chao et al. Reference CHAO, GOTELLI, HSIEH, SANDER, MA, COLWELL and ELLISON2013) and species richness estimators were used as a parameter to evaluate the representation of each sample according to the total community. Inequalities in species abundance and mobility may affect the performances of richness estimators (Brose & Martinez Reference BROSE and MARTINEZ2004), so the estimators Jackknife 1 and ICE were chosen based on the percentage of sample coverage. These estimators were calculated with the software EstimateS 9.1.0.
Differences in abundance between canopy and understorey were checked with Generalized Linear Mixed Models (GLMM) using the package lme4 in R Language 3.0.2. Data were square root-transformed to satisfy the conditions of homoscedasticity and normality. In the mixed model, stratum was treated as fixed effect, month as a repeated measure, transect as a random factor, and the variation of the response variable was tested with ANOVA. Indicator Value (IndVal; an index used to measure the association between taxa and a certain site or group; Dufrêne & Legendre Reference DUFRÊNE and LEGENDRE1997), was used to identify the species, tribe or subfamily indicators of each vertical stratum, using the indicspecies package in R (De Cáceres & Legendre Reference DE CÁCERES and LEGENDRE2009). The significance of the relationship was then assessed using permutations tests.
The variation in diversity was investigated using an entropy approach (Jost Reference JOST2006, Reference JOST2007), through comparison of the profile plots of α diversity for each stratum against different orders of diversity. The order of diversity indicates its sensitivity to common and rare species; for values less than unity (q < 1) the diversity profile gives more weight to the rare species, while q values greater than unity (q > 1) disproportionately favour the most common species (Jost Reference JOST2006). In this case, the orders of diversity (q values) are analogous to species richness (q = 0), Shannon index (q = 1) and Simpson's Index (q = 2).
Non-metric multi-dimensional scaling (NMDS) was performed to compare beta diversity between canopy and understorey. This technique groups SU points in ordination space according to similarities in species composition. Similarity matrices were built using the Morisita index, a quantitative measure that takes into account the identity and abundance of species, giving low weight for rare species in a sample (Jost et al. Reference JOST, CHAO, CHAZDON, Magurran and McGill2011). Additionally, mean similarity between months was compared to detect the temporal variation of species turnover in each stratum. Higher similarity values were assumed to indicate a more stable community, with low species turnover. A PERMANOVA was calculated to test the significance of the distance between the groupings formed in the NMDS. These analyses were conducted using R Language 3.0.2.
RESULTS
A total of 2047 individuals comprising 69 species of fruit-feeding butterflies were recorded in 1 y of sampling (Appendix 1), of which 632 were sampled in the understorey and 1415 in the canopy. According to Jackknife 1 and ICE analytical estimators, 87% and 92% of the expected species richness for the study area was sampled, respectively. The most species-rich subfamily was Satyrinae, comprising 48% of all sampled species, followed by Biblidinae (27%), Charaxinae (22%) and Nymphalinae (3%). Charaxinae was the most abundant subfamily (n = 1051), accounting for approximately half of all sampled individuals. A single species of Charaxinae, Memphis appias, comprised about a third of all individuals sampled (n = 741), and about a half of those captured in the canopy. A total of 57 recaptures (56 individuals, with one double recapture) were recorded, comprising only 3% of all marked individuals. Only seven individuals were recaptured in a stratum different from the first capture (four moved from understorey to canopy, and three did the opposite).
Abundance of fruit-feeding butterflies was significantly different between vertical strata (F1, 11 = 11.0; P = 0.006) and months (F11, 11 = 5.50; P = 0.004) and its variation had an interaction effect between these two factors (F11, 115 = 3.78; P < 0.001). In general, fruit-feeding butterfly abundance was higher in the canopy, but this difference was not always consistent through time (Figure 1a). We observed two marked peaks of abundance: a pronounced peak at the transition from dry to the wet seasons (September–October), and a minor peak at the transition from wet to dry seasons (February–April) (Figure 1a). The canopy had more sampled individuals than the understorey throughout the year, except in March when abundance was similar in the two strata. In colder months (June, July and August), the canopy maintained an abundance from 30 to 80 individuals in total, while fewer than 10 individuals were captured in the understorey during the same period. Average temperature was consistently higher in canopy traps when compared with understorey traps in all months except in October 2011 (Figure 2).
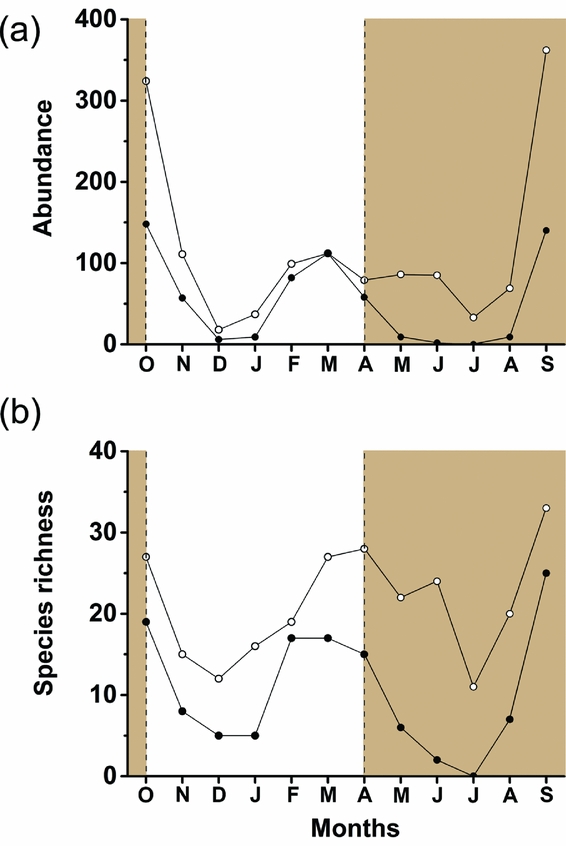
Figure 1. Temporal variation of total abundance of fruit-feeding butterflies over one sampling year (2011–2012) in Serra do Japi, Jundiaí, São Paulo, Brazil (a). Temporal variation of species richness of fruit-feeding butterflies along one sampling year (b). Open circles = canopy; solid circles = understorey. Brown-shaded areas delimit the months of wet seasons.
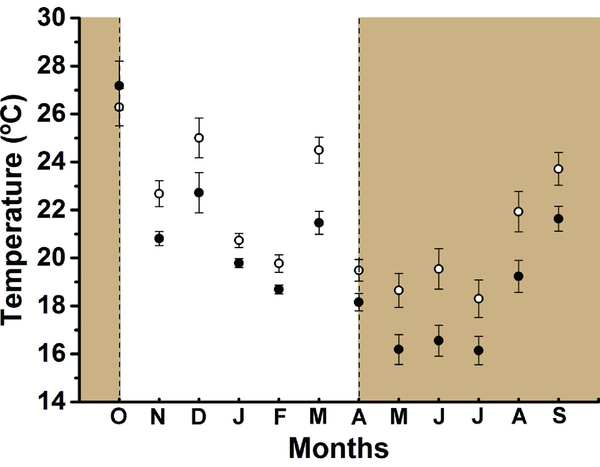
Figure 2. Mean temperature of the two vertical strata per month (2011–2012) in Serra do Japi, Jundiaí, São Paulo, Brazil. Open circles = canopy traps; solid circles = understorey traps. Lines correspond to the standard error. Brown-shaded areas are delimiting the months of wet seasons. Open circles = canopy traps; solid circles = understorey traps.
Temporal variation in species richness followed a pattern similar to that recorded for abundance, with peaks in September–October (dry-to-wet transition) and March–April (transition from wet to dry season). The canopy was richer than the understorey in all months (Figure 1b), and had a higher total number of species (S = 59) than the understorey (S = 41). However, the SACs suggest that a significant difference of richness between strata cannot be assumed, because the lower confidence interval of the canopy SAC overlaps the higher confidence interval of the understorey SAC (Figure 3).

Figure 3. Rarefaction and extrapolation curves comparing differences in species richness of fruit-feeding butterflies in the canopy (black lines) and understorey (brown lines) in Serra do Japi, Jundiaí, São Paulo, Brazil. Dashed lines represent confidence intervals (± 95%), and their overlap indicate the lack of difference of species richness between strata.
Despite the general differences in abundance between the two strata, only a few species appeared as good indicators of either one. At higher taxonomic levels, however, the tribes Epiphilini and Callicorini (Biblidinae) were intimately associated with the canopy, whereas the group indicative of understorey samples was the Morphini + Brassolini clade (Table 1). Some species from Satyrini tribe were consistently recorded in the forest canopy, such as Eteona tisiphone, Carminda paeon, Yphthimoides borasta, Praepedaliodes phanias (Appendix 1) and also Atlanteuptychia ernestina.
Table 1. Test of the association between selected species and tribes of fruit-feeding butterflies with two habitat categories based on the vertical gradient. The IndVal index measures the degree of association of taxa with each stratum and identifies the species and tribes indicators of a given vertical stratum. P values less than 0.05 correspond to significance of associations calculated by permutation tests (N perm = 9999). (Clades: BRA = Brassolini; MOR = Morphini; SAT = Satyrini; ANA = Anaeini; CAL = Callicorini; EPI = Epiphilini; EPC = Epicaliini).

According to the comparison of species richness alone, when the order of diversity is zero (q = 0) the diversity profiles showed that the canopy had a higher diversity than the understorey. However, diversity patterns between strata tended to change considering the abundance data in the entropy analysis (q > 1) (Figure 4).

Figure 4. Diversity profiles calculated to compare different diversity indices according to each scalar value of diversity order (q values) for fruit-feeding butterflies in Serra do Japi, Jundiaí, São Paulo, Brazil. The q values run from 0 (all species equally weighted) to a progressive scale where rare species have less influence. The intersection of curves demonstrates the divergence between values pointed by different diversity parameters. Open circles = canopy; solid circles = understorey.
The species composition clearly segregated into two distinct subsets: canopy samples were more similar among themselves than the understorey ones (Figure 5). The difference in species composition between canopy and understorey assemblages was corroborated by the PERMANOVA (F = 29.7; P = 0.002) with a reliable stress value (0.05). The canopy samples presented higher values of mean similarity over time when compared with the understorey (Figure 6). This suggests that the canopy fauna has a lower rate of species turnover whereas understorey species tended to exhibit a faster replacement throughout the year.

Figure 5. Non-metric multi-dimensional scaling (NMDS) comparing the composition of fruit-feeding butterfly species in the canopy (open circles) and in the understorey (solid circles) in Serra do Japi, Jundiaí, São Paulo, Brazil (Stress = 0.05). Each data point is a transect (SU).

Figure 6. Average of Morisita similarity index calculated for the fruit-feeding butterflies in canopy (solid line) and understorey (dashed line) in Serra do Japi, Jundiaí, São Paulo, Brazil (2011–2012) at intervals of 1–11 mo. Note that the 11-mo interval is a single value.
DISCUSSION
This study is the first to investigate and report differences between canopy and understorey in fruit-feeding butterfly assemblages in a seasonal site of the Atlantic Forest, and thus confirms the need for surveys to include this spatial dimension when sampling the biome. A total of 55% of the species were recorded exclusively in the canopy, highlighting the foraging specificity of this fauna, as well as the need for long-term studies to improve our understanding of the spatial distribution of communities in tropical forests (DeVries & Walla Reference DEVRIES and WALLA2001, DeVries et al. Reference DEVRIES, ALEXANDER, CHACON and FORDYCE2012).
Previous studies in tropical forests also reported differences in species composition of fruit-feeding butterflies between vertical strata. However, in contrast to the present study, all found higher abundances in the understorey. This was observed in the Ecuadorian (DeVries et al. Reference DEVRIES, MURRAY and LANDE1997, Reference DEVRIES, WALLA and GREENEY1999) and Brazilian (Ribeiro & Freitas Reference RIBEIRO and FREITAS2012) Amazonian forests, in Trinidad (Wood & Gillman Reference WOOD and GILLMAN1998), Costa Rica (DeVries et al. Reference DEVRIES, ALEXANDER, CHACON and FORDYCE2012); and outside the neotropics in Malaysia (Dumbrell & Hill Reference DUMBRELL and HILL2005), Indonesia (Fermon et al. Reference FERMON, WALTERT, VANE-WRIGHT and MÜHLENBERG2005), Ivory Coast (Fermon et al. Reference FERMON, WALTERT and MÜHLENBERG2003), Ghana (Aduse-Poku 2012) and Uganda (Molleman et al. Reference MOLLEMAN, ARJAN, BRAKEFIELD, DEVRIES and ZWAAN2006). Additionally, Fordyce & DeVries (Reference FORDYCE and DEVRIES2016) demonstrated that beta diversity of fruit-feeding butterflies was higher in the canopy. All previous studies were performed at tropical forests at low latitudes without marked seasonality, and this may explain the discrepancy between them and our results from the Atlantic Forest. Future long-term studies in other seasonal forests are now needed to confirm the observed pattern found in this study.
Species that were indicators of the canopy, such as Diaethria candrena (Table 1), and also those predominantly captured in upper stratum such as Memphis spp., Praepedaliodes phanias, Eteona tisiphone and Carminda paeon (Appendix 1), were also frequently observed foraging on the ground at forest edges and clearings. As noted by DeVries (Reference DEVRIES1988), sun-loving species may treat forest edges and clearings as an extension of the canopy that reaches to the ground. Therefore, species commonly captured on trails and edges may in fact be canopy dwellers, and rarely penetrate shaded forest fragments. Interestingly, although canopy species can descend to ground level in forest edges and clearings, understorey species (such as Opoptera syme, Morpho helenor and Caligo arisbe) rarely rise to the canopy, being seldom captured in the upper stratum (Table 1, Appendix 1). In addition, the previous three species are all considered understorey indicators and are also closely related, belonging to the clade comprising the tribes Morphini + Brassolini (Table 1). This suggests that the observed patterns may have a connection to functional or phylogenetic traits (DeVries Reference DEVRIES1988, Fordyce & DeVries Reference FORDYCE and DEVRIES2016, Schulze et al. Reference SCHULZE, LINSENMAIR and FIEDLER2001). In particular, traits like size and wing colour may reflect the differential occupancy of habitats, as demonstrated in an Australian tropical forest, where cool environments are thermal refuges for dark and large-bodied butterfly species (Xing et al. Reference XING, BONEBRAKE, TANG, PICKETT, CHENG, GREENSPAN, WILLIAMS and SCHEFFERS2016). The vertical strata of tropical forests have similar importance in the seasonal Atlantic Forest, and canopy exposure may be a critical condition for thermoregulation activities.
The high abundance of a single species (M. appias) probably overestimated the difference of individuals captured between understorey and canopy. Its dominance is shown by the contrasting values obtained for the diversity profiles plots (Figure 4). When diversity profiles of two communities intersect, their diversities are not directly comparable, since we can find two indices ordering the communities differently (Tóthmérész Reference TÓTHMÉRÉSZ1995). Nevertheless, diversity profiles may reveal processes involved in species dominance in these communities. In this case, in q values greater than 1, the understorey has a higher value of diversity and consequently a more equitable distribution of species than the canopy. Conversely, the swiftly decreasing diversity in the canopy portrays a higher degree of dominance in its assemblage (Jost Reference JOST2006).
The dominance of M. appias in canopy samples also highlights the lower species turnover in the upper stratum. Some species of Anaeini, such as those of the genera Memphis and Fountainea, use Croton spp. (Euphorbiaceae) as host plants in the study site (AVLF pers. obs., Brown Reference BROWN and Morellato1992, Queiroz Reference QUEIROZ2002), a common plant in gaps and forest edges at the study site (JPS and AVLF pers. obs., Queiroz Reference QUEIROZ2002). Queiroz (Reference QUEIROZ2002) also recorded a higher abundance of M. appias in the canopy at the same locality, and observed that immature stages were more common in tall shrubs and trees than on saplings of Croton floribundus (Euphorbiaceae). The use of tall individuals of C. floribundus suggests that M. appias is a canopy species also in terms of host-plant use. Differential host-plant use across vertical strata is a pattern already described for mimetic Ithomiini butterflies (Nymphalidae: Danainae) (Beccaloni Reference BECCALONI1997).
Temperature as a limiting factor in seasonal Atlantic Forest
The higher temperature in the canopy all year round may allow increased butterfly activity even in colder months, leading to higher butterfly abundances in this stratum (Figure 2). As a result of the high abundance, the canopy species accumulation curve rapidly reached an asymptote and apparently higher species richness in a short time. However, the understorey is not less species rich, but just accumulated species more slowly owing to its low abundance. In contrast to previous studies from tropical forests at low latitudes, the lower temporal species turnover found in the canopy for butterfly assemblages was similar to a pattern previously observed for insects of temperate forests (Weiss et al. Reference WEISS, PROCHÁZKA, SCHLAGHAMERSKÝ and CIZEK2016). The high species turnover found in the understorey suggest that temperature may be a limiting factor stronger than rainfall (Figures 2, 6). As for temperate forests, microclimatic conditions may play an important role in spatial distribution of ectotherms in seasonal forests, and solar incidence is likely a key factor explaining patterns of vertical stratification in insects (Basset et al. Reference BASSET, NOVOTNY, MILLER and KITCHING2003). Warmer temperatures in the canopy (due to higher solar exposure) would bring benefits to butterflies by reducing the metabolic cost of flight, or allowing individuals to spend more time acquiring resources instead of engaged in thermoregulation activities (Ribeiro & Freitas Reference RIBEIRO and FREITAS2010, Turner et al. Reference TURNER, GATEHOUSE and COREY1987).
Our results also demonstrated that butterflies were always more abundant in the canopy than in the understorey but during the cold-dry season, fruit-feeding butterfly abundance declined considerably in the understorey, remaining constant in the canopy (Figure 1a). This pattern is maintained even by removing the dominant M. appias. Both rainfall and temperature decreased during the dry season but turnover rates remained consistently lower in the canopy (Figure 6). The change in rainfall regime in dry–wet transition (September–October) could favour the increase of abundance and consequently, species richness of butterflies in both strata. Studies on the phenology of plant species in Atlantic Forest formations, including the study area, indicated that peaks of flowering and budding occurs at the transition between dry and wet seasons (Morellato & Leitão-Filho Reference MORELLATO, LEITÃO-FILHO and Morellato1992, Morellato et al. Reference MORELLATO, TALORA, TAKAHASHI, BENCKE, ROMERA and ZIPARRO2000, Oliveira-Filho & Fontes Reference OLIVEIRA-FILHO and FONTES2000). These peaks of plant development coincide with the peaks of butterfly abundance, as might be expected if adult butterfly emergence is synchronized with the increasing availability of the new plant resources needed for their progeny.
In summary, the variation of rainfall may indirectly affect butterfly communities through time by means of phenology and resource availability. Nevertheless, the absence of annual replications in our data allowed us only to describe the vertical stratification dynamics over 1 y. To unravel the interplay between spatiotemporal dimensions with the structure of butterfly communities, long-term studies are necessary. Regardless, our results bring future perspectives to uncover the complex relation between local gradients of beta diversity and (latitudinal) larger-scale gradients.
Concluding remarks
This is the first study to record differences between canopy and understorey assemblages of fruit-feeding butterflies in the seasonal Atlantic Forest. We demonstrated contrasting patterns of vertical abundances to those described in previous studies of tropical forests. We also found noticeable differences in taxonomic composition between canopy and understorey, and higher temporal beta diversity in the understorey. Although rainfall is an important factor determining the dynamics of abundance, species richness and vertical stratification through time, its effect is apparently less direct than temperature in the spatial dimension of a seasonal forest. This became more evident in dry seasons, when lower temperatures could be acting as a barrier for sun-loving species to penetrate and remain active in the forest understorey. The results presented here give an important contribution to the knowledge of spatial distribution of diversity in seasonal forests. Furthermore, knowledge about the biology and natural history of the target group seem a relevant prerequisite for understanding the mechanisms behind spatial and temporal patterns of diversity distribution. Additional vertical stratification studies in other Neotropical habitats (especially in Atlantic Forest sites) and consistent data from long-term studies will further contribute to uncovering the mechanisms responsible for structuring fruit-feeding butterfly communities, as well as the establishment of general patterns in the Neotropics.
ACKNOWLEDGEMENTS
The authors thank Sérvio Ribeiro, Phil DeVries, Keith Willmott, Thomas Lewinsohn, Leila Shirai and Neil Rosser for comments on early versions of this manuscript. We are grateful to all the staff of ‘Reserva Biológica da Serra do Japi’ for providing us with accommodation, and the ‘Fundação Antonio-Antonieta Cintra Gordinho’ for allowing access to their properties. We are also grateful to all colleagues from the ‘Laboratório de Ecologia e Filogenia de borboletas’ (LABBOR) for the support in field expeditions and further contributions. JPS and JYOC acknowledges the ‘Programa de Pós Graduação em Ecologia – Unicamp’, and the ‘Conselho Nacional de Desenvolvimento Científico e Tecnológico’ (CNPq, 134982/2) for academic support and graduate fellowships. CAI was supported with a Postdoctoral fellowship by Fundação de Amparo à Pesquisa do Estado de São Paulo (FAPESP, 2011/08433-8). AVLF thanks FAPESP (Biota-FAPESP 2011/50225-3), the CNPq (Fellowship 302585/2011-7 and 303834/2015-3), and the NSF (DEB-1256742). This publication is part of the RedeLep ‘Rede Nacional de Pesquisa e Conservação de Lepidópteros’ – SISBIOTA-Brasil/CNPq (563332/2010-7), the collaborative grant ‘Dimensions US-BIOTA São Paulo: A multidisciplinary framework for biodiversity prediction in the Brazilian Atlantic forest hotspot’, US NSF, NASA and FAPESP (grant 2013/50297-0).
Appendix 1. List of species of fruit-feeding butterflies recorded in Serra do Japi. The data show the abundance in each transect (1–6) and the stratum in which the species was recorded. S = Species richness; U = understorey; C = Canopy.


