INTRODUCTION
In southern Québec and Ontario, global climate models project a rise in annual mean temperature of 1–5°C by the end of the twenty-first century (Boulanger et al., Reference Boulanger, Taylor, Price, Cyr, McGarrigle, Rammer, Sainte-Maire, Beaudoin, Guindon and Mansuy2017). This will undoubtedly trigger significant changes in lake health and productivity in the region (Barker et al., Reference Barker, Pates, Payne and Healey2005), as climate plays a major role in freshwater ecosystem dynamics (Bradshaw et al., Reference Bradshaw, Rasmussen, Nielsen and Anderson2005). In small, temperate lakes, for example, greater primary production in response to warmer temperatures could ultimately lead to lake anoxia, with indirect impacts on higher trophic levels (Dove-Thompson et al., Reference Dove-Thompson, Lewis, Gray, Chu and Dunlop2011). Variations in precipitation, including periods of sustained droughts, could also alter lake hydrologic cycles, increasing their vulnerability to deteriorating water quality and eutrophication (Barker et al., Reference Barker, Pates, Payne and Healey2005).
Changes in forest vegetation and catchment soils associated with climatic variability and human disturbances also exhibit strong influences on lake water chemistry and aquatic biota (Carignan and Steedman, Reference Carignan and Steedman2000). The close coupling of watershed processes and lake ecosystems is documented in paleolimnological studies; for example, Beck et al. (Reference Beck, Medeiros and Finkelstein2016) noted a shift to a more nutrient-rich catchment surrounding Wishart Lake, southern Ontario, following the mid-Holocene decline of hemlock (Tsuga canadensis), which ultimately led to the eutrophication of the lake. Studies from southern Ontario and Québec describe significant responses of aquatic communities to human-induced disturbances following European settlement (Ekdahl et al., Reference Ekdahl, Teranes, Wittkop, Stoermer, Reavie and Smol2007: Neil and Gajewski, Reference Neil and Gajewski2017). Climate change, as well as sustained and potentially increased impacts of anthropogenic activities in the future, will likely present challenges for predicting how lake ecosystems will respond and recover to environmental changes (Johnstone et al., Reference Johnstone, Allen, Franklin and Turner2016).
Paleorecords and historical data document responses of vegetation and aquatic taxa to major climatic variations of the late Holocene (e.g., Gajewski, Reference Gajewski1988; Williams et al., Reference Williams, Post, Cwynar, Lotter and Levesque2002), such as the Medieval Warm Period (MWP; ~AD 800–1200) and the Little Ice Age (LIA; ~AD 1450–1850). However, local forcings or disturbances (e.g., fire, anthropogenic activity) often mask these broad climatic signals in the data as they alter the rate and timing of ecological change among sites (Paine et al., Reference Paine, Tegner and Johnson1998; Williams et al., Reference Williams, Blois and Shuman2011). This was demonstrated in a study that compared the vegetation histories from two proximate lakes, Lac Noir and Lac Brûlé, in southern Québec (Lafontaine-Boyer and Gajewski, Reference Lafontaine-Boyer and Gajewski2014). A decline in hemlock pollen at Lac Noir was attributed to cooling temperatures during the LIA, but a similar decrease occurred centuries earlier at Lac Brûlé in response to a local fire in the catchment area (Lafontaine-Boyer and Gajewski, Reference Lafontaine-Boyer and Gajewski2014). To distinguish the effects of climate and nonclimatic processes on watershed-lake interactions, replication of multiproxy studies within a limited spatial area is thus necessary.
The purpose of this study is (1) to analyze aquatic primary producers (diatoms) in Lac Noir in relation to environmental changes and nutrient fluxes and (2) to understand their responses within the context of regional paleorecords of the late Holocene in southern Québec and Ontario. Diatoms are indicators of lake response to external forcings, as they are abundant, respond rapidly to physical/chemical changes in the water column, and are typically preserved in lake sediments (Stoermer and Smol, Reference Stoermer and Smol2001). Generalized additive models (GAMs) are used here to hierarchize the influences of external forcings on diatom assemblages and to separate ecological responses linked to regional climate variability and/or site-specific factors. Results of the diatom analysis are compared with a previous study of Lac Noir, in which climate and vegetation changes of the past 1000 yr were identified through a high-resolution pollen analysis of the lake sediments (Paquette and Gajewski, Reference Paquette and Gajewski2013). The overall results are compared with those from the nearby Lac Brûlé (Neil and Gajewski, Reference Neil and Gajewski2017).
METHODS
Study site
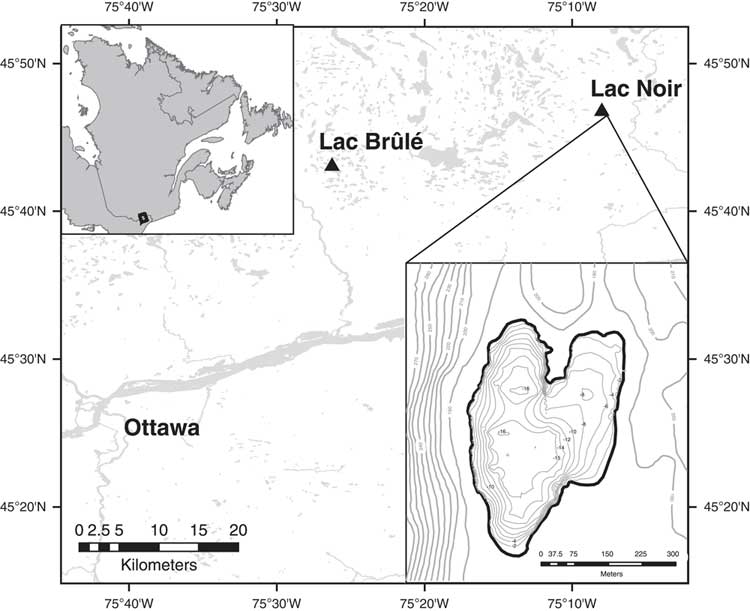
The study area is located in southwestern Québec, 60 km northeast of Ottawa (Fig. 1). Lac Noir (45°46′32.89″N, 75°08′05.65″W; 176 m) is the main site for which data are presented here; it is a small lake (25 ha) and has continuously laminated sediments, with a maximum depth of ~16 m (Paquette and Gajewski, Reference Paquette and Gajewski2013). In 2013, the pH of the lake was 7.7 near the surface, and the conductivity was 20.0 μS/cm. Based on low concentrations of total phosphorus (TP; 9 μg/L), total nitrogen (TN; 260 μg/L), and chlorophyll-α (0.59 μg/L) at this time, the lake was characterized as ultra-oligotrophic (Cooper et al., Reference Cooper, Neil and Gajewski2016).
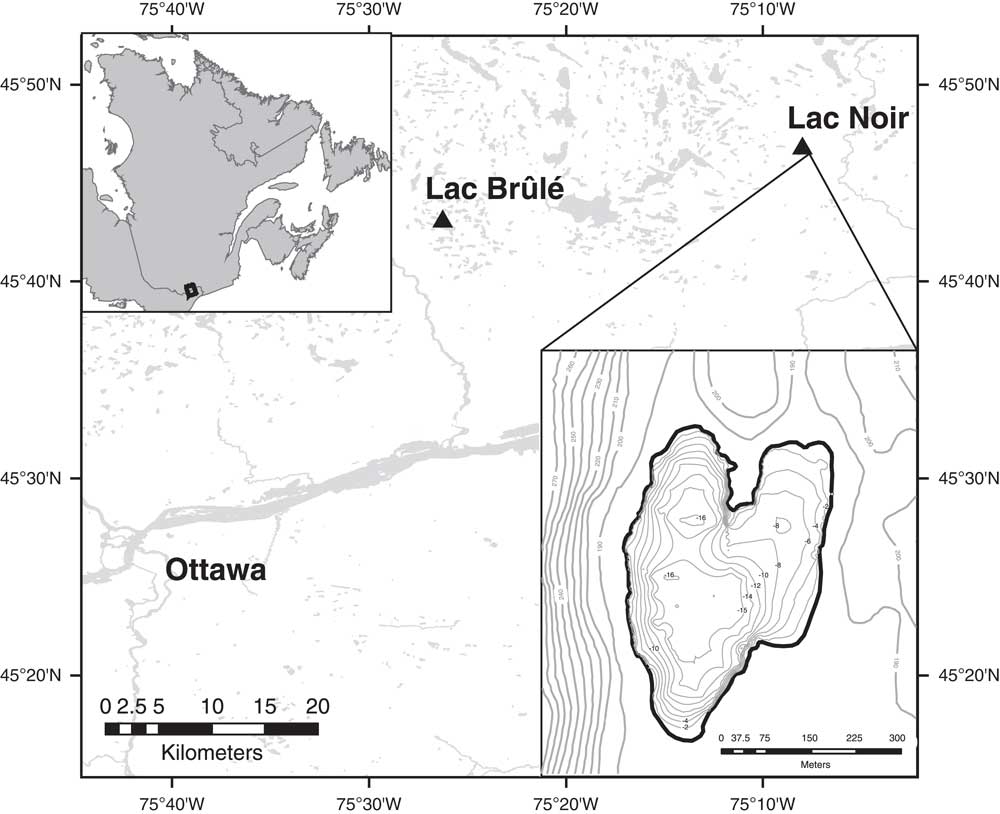
Figure 1. Map of the location and bathymetry of Lac Noir, southwestern Québec.
Lac Noir is underlain by Precambrian Shield and is situated within a transition zone between the boreal (to the north) and deciduous (to the south) forest. The mixed forest surrounding the lake is dominated by red and white pine (Pinus resinosa, Pinus strobus), white and black spruce (Picea glauca, Picea mariana), eastern Hemlock (Tsuga canadensis), yellow birch (Betula alleghaniensis), American beech (Fagus grandifolia), various species of maple (Acer saccharum, Acer pensylvanicum, Acer rubrum, Acer negundo), and green and speckled alder (Alnus crispa, Alnus rugosa). The closest long-term weather station to Lac Noir (Notre-Dame de la Paix) records mean daily temperatures ranging from −11.9°C in January to 19.1°C in July (Environment Canada, 2017). Total annual precipitation in the region is 985 mm, approximately 30% of which falls as rain in the summer months (June, July, August [JJA]) (Environment Canada, 2017). Human activity in the catchment area surrounding Lac Noir is restricted; there are currently two small summer cabins on the shore. A few small towns and agricultural fields are located ~1 to 2 km east of the lake, but immediately to the west the landscape is relatively steep and appears undisturbed.
Sampling and chronology
In 2010, three continuously laminated sediment cores were collected from Lac Noir. Paquette and Gajewski (Reference Paquette and Gajewski2013) identified the laminations as annual varves (confirmed by 210Pb and 14C dating), and cross-correlated the varved sequences from each of these cores to establish a chronology for the site. The majority of the core (6.6–91 cm) was sectioned into 10 yr intervals based on the varve chronology; however, disturbances in the uppermost 6.5 cm prevented varves from being reliably counted in this section. Instead, results from 210Pb dating were used to assign ages to samples corresponding with this upper section of the core (for details, see Paquette and Gajewski, Reference Paquette and Gajewski2013). To enable direct comparisons of diatoms with the previously published high-resolution pollen record from Lac Noir, subsamples in this study were taken from the same sections of the core used by Paquette and Gajewski (Reference Paquette and Gajewski2013) in their analyses.
In their study, Paquette and Gajewski (Reference Paquette and Gajewski2013) estimated European settlement at ~AD 1810 based on a rise in Ambrosia pollen in Lac Noir. Historical records indicate that European colonization of the region began in the early nineteenth century, but human activities affecting the environment (e.g., logging, agriculture) only increased in the second half of the century (Smith, Reference Smith1967). In 2014, a palynological study of a nearby lake with varved sediments, Lac Brûlé, recorded an increase in Ambrosia pollen at AD 1860 (Lafontaine-Boyer and Gajewski, Reference Lafontaine-Boyer and Gajewski2014). Following Lafontaine-Boyer and Gajewski (Reference Lafontaine-Boyer and Gajewski2014), we revised the Lac Noir chronology in this study to place the Ambrosia rise at AD 1860. The varves from the Lac Brûlé core were undisturbed in the upper section and thus likely more accurate, and an increase in Ambrosia at AD 1860 seems to fit more reasonably with the historical record of the region.
Laboratory analysis
From the same sections of the Lac Noir sediment core used for the palynological study, subsamples averaging ~0.02 g of dry sediment were extracted into 20 mL glass vials in AD 2017 for diatom analysis. Hydrogen peroxide (30%) was added to each vial and left to digest in a water bath at 80°C for 3–4 hours (Battarbee et al., Reference Battarbee, Jones, Cameron, Bennion, Carvalho and Juggins2001). To enable estimations of diatom influx rates, a known volume of microsphere solution (concentration of 5.0 × 10⁶ spheres/mL) was added to each subsample. A small amount of diatom slurry was diluted with deionized water before being pipetted onto a cleaned coverslip. The coverslips were left to air dry in a dry hood, after which they were permanently mounted onto microscope slides with Naphrax. Diatoms were identified with a Nikon 90i microscope at 1000× magnification under oil emersion, using Patrick and Reimer (Reference Patrick and Reimer1975, Reference Patrick and Reimer1966), Siver et al. (Reference Siver, Hamilton, Stachura-Suchoples and Kociolek2005), and Antoniades et al. (Reference Antoniades, Hamilton, Douglas and Smol2008) as taxonomic references. For each sample, a minimum of 500 diatom valves were counted; these counts were translated into both relative abundance data and influx rates for each diatom species. Chrysophyte scales were enumerated on each slide, and a chrysophyte scale to diatom valve index (CS/DV) was calculated following Karmakar et al. (Reference Karmakar, Laird and Cumming2015).
Numerical analysis
Using the “vegan” package in the statistical program R3.2.5 (R Development Core Team, 2013), diatom assemblages consisting of the most abundant taxa (>3% relative abundance in at least one sample) were summarized with principal components analysis (PCA). Prior to the PCA, species relative abundance data were Hellinger transformed (Legendre and Gallagher, Reference Legendre and Gallagher2001). Significant PCA axes were identified using a scree plot of the axis eigenvalues, and the diatom percentage diagram was divided into biostratigraphic zones based solely on changes in the scores of the PCA. For each of the 110 samples from Lac Noir, additional data from Paquette and Gajewski (Reference Paquette and Gajewski2013) were available for analysis, including pollen percentages (summarized with a separate PCA), pollen influx, organic matter (loss-on-ignition [LOI] 550%) and carbonate (LOI 950%) content, charcoal influx, and reconstructed JJA temperature and precipitation, derived from the pollen data using the modern analogue technique.
GAMs were generated using the “mcgv” package in R (Wood, Reference Wood2008, Reference Wood2011) to assess the degree to which individual external forcings influenced the Lac Noir diatom community. The response variable in each GAM was one of three significant diatom principal components (PCs) axes. Predictor variables included pollen PC axes, pollen influx, LOI 550%, LOI 950%, CS/DV, and microcharcoal influx; these were interpreted as indicators of general climatic conditions, productivity of terrestrial vegetation, disturbances in the catchment (e.g., erosion, fire), and lake trophic status. Parameterization of the GAMs included a restricted maximum likelihood (REML) smoothness selection, a shrinkage method by double penalty approach on each of the smoothing terms (Marra and Wood, Reference Marra and Wood2011), and thin plate splines as the type of basis dimension.
RESULTS
Diatom biostratigraphy and environmental data
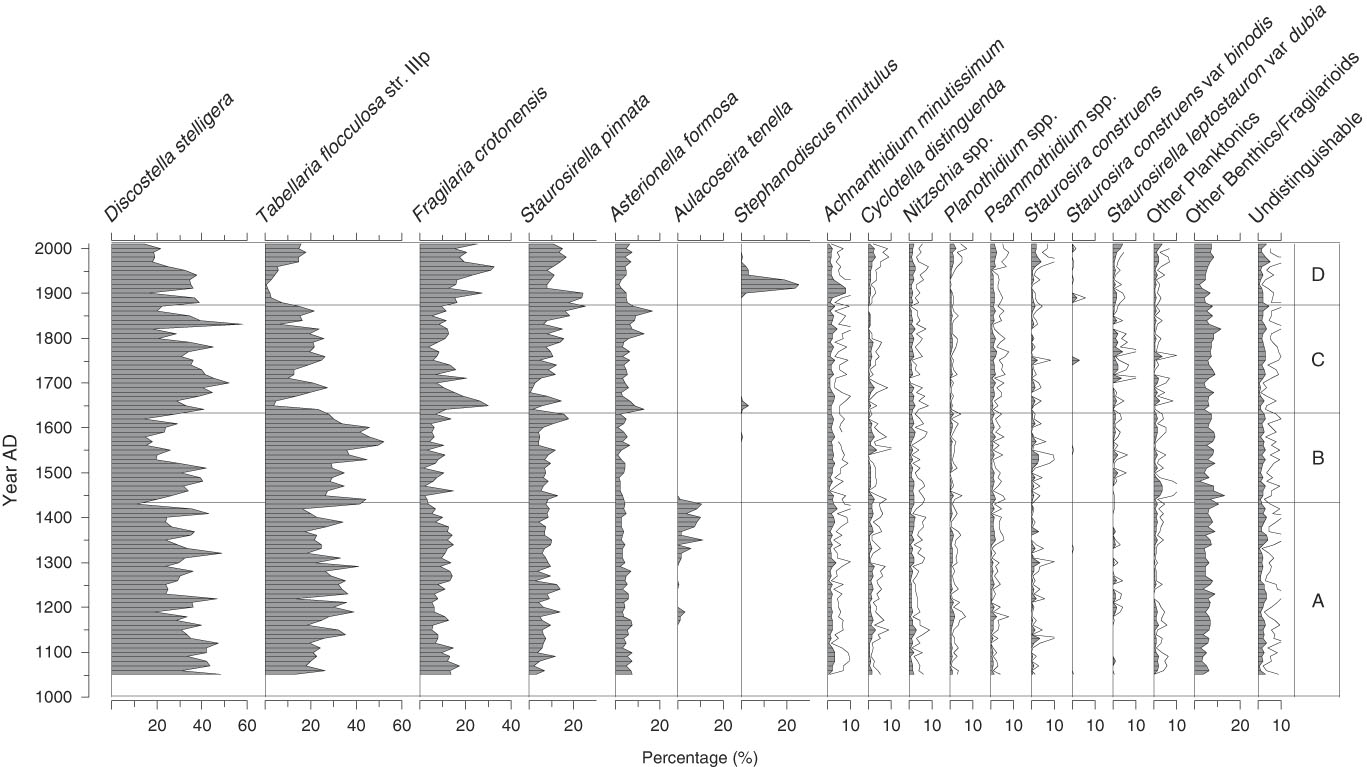
A total of 130 diatom species were identified from the sediment samples, 15 of which occurred with >3% relative abundance in at least one sample (Fig. 2); only these more abundant species are shown. Three of the taxa dominated the fossil assemblages and when combined accounted for 45% to 80% of the total diatom sum: Discostella stelligera (Cleve et Grunow) Houk et Klee, 2004; Tabellaria flocculosa str. IIIp (Roth) Kützing, 1844; and Fragilaria crotonensis Kitton, 1869 (Fig. 2). More detailed changes in the Lac Noir diatom record (Fig. 2) and environmental variables (Fig. 3) throughout the late Holocene are described in this section in relation to four major biostratigraphic zones. Note that these zones were defined based solely on changes in the diatom assemblages, as summarized by a PCA (Fig. 4; discussed subsequently).

Figure 2. Lac Noir diatom stratigraphy, expressed as percentages of total diatom abundance. Taxa with ≥3% relative abundance in at least one sample are shown, and a 3× exaggeration (unfilled gray line) is applied to taxa representing a smaller portion of the total diatom sum.

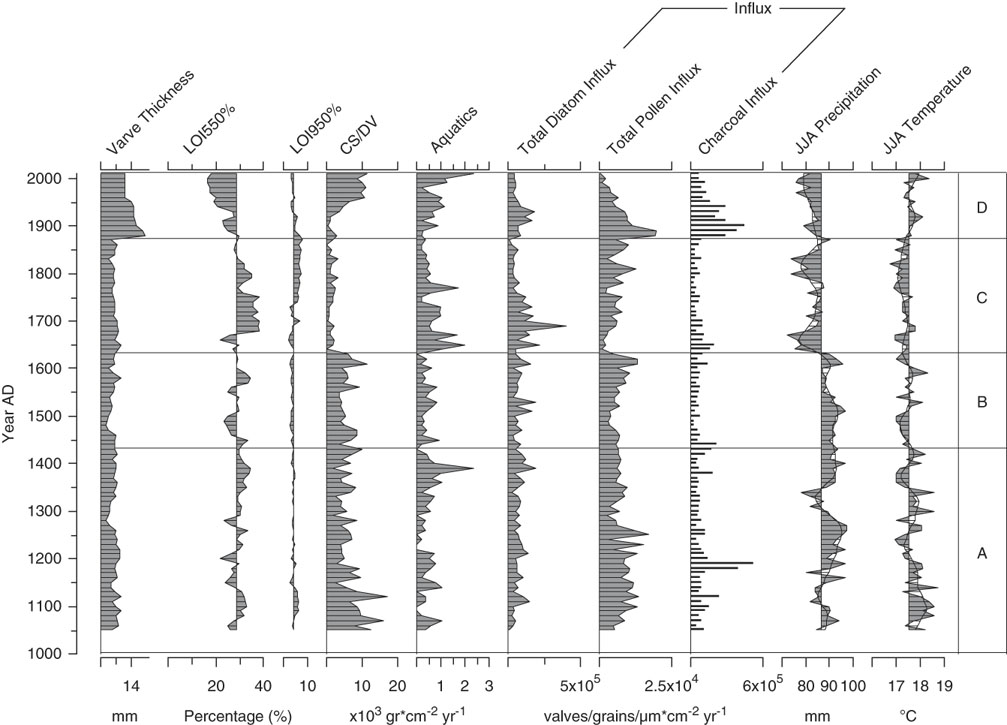
Figure 3. A paleoenvironmental summary for Lac Noir, southwestern Québec. Data obtained from Paquette and Gajewski (Reference Paquette and Gajewski2013) include varve thickness, organic/carbonate content, aquatic pollen percentage, pollen and charcoal influx, and paleoclimate reconstructions (derived from the pollen record using the modern analogue technique). LOI, loss-on-ignition; CS/DV, chrysophyte scale to diatom valve index; JJA, June, July, August.
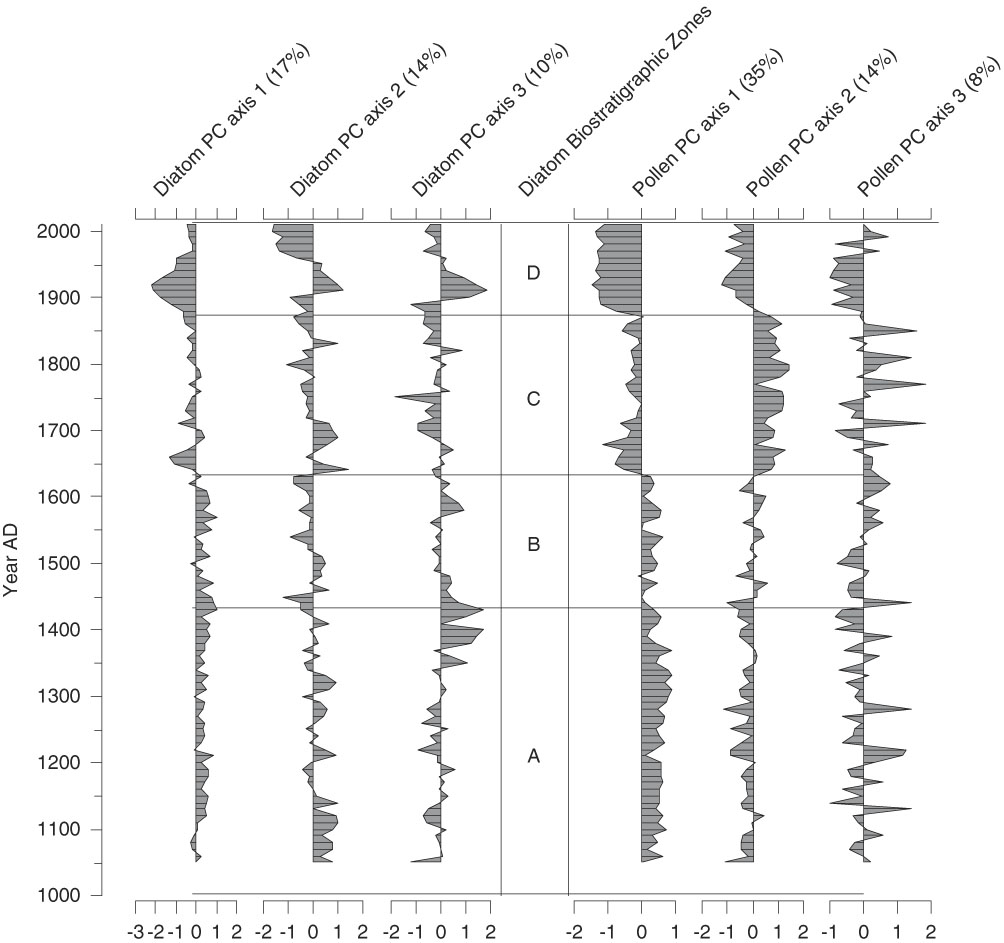
Figure 4. Diatom and pollen principal components (PCs) sample scores for Lac Noir (see Tables 1 and 2 for loadings); only significant principal components analysis (PCA) axes are shown. Explained variance of each axis is indicated as a percentage. The division of the diagram is based solely on changes in the diatom PCA. The pollen PCA axes were derived from the pollen record of Paquette and Gajewski (Reference Paquette and Gajewski2013).
Zone A (AD 1050–1430)
In zone A, the relative abundance of D. stelligera declined steadily. T. flocculosa str. IIIp represented on average 30% of the total diatom sum, and F. crotonensis percentages fluctuated gradually, reaching a minimum for the record at the boundary between zones A and B (<5%). In AD 1150, Aulacoseira tenella (Nygaard) Simonsen, 1979 first appeared in the record, increasing at AD 1300 (Fig. 2). Diatom influx was relatively low and did not significantly change in zone A (Fig. 3). There was a slight decrease in CS/DV just before AD 1200, which coincided with a brief peak in charcoal influx (two consecutive samples), and a small decline in pollen influx occurred at AD ~1250 (Fig. 3).
Zone B (AD 1440–1630)
At the beginning of zone B, A. tenella abruptly disappeared and remained absent from the rest of the record. The relative abundance of T. flocculosa str. IIIp increased up to a maximum of 52% in AD 1570, before declining rather abruptly (Fig. 2). Total diatom, pollen, and charcoal influx rates and CS/DV were stable throughout zone B (Fig. 3).
Zone C (AD 1640–1870)
In zone C, D. stelligera began to increase, reached a peak in relative abundance at AD ~1700, and then declined to ~20% of the total diatom sum at the end of the zone. The percentage of T. flocculosa str. IIIp was initially low (<5%), when Asterionella formosa Hassal, 1850; F. crotonensis; and Staurosira pinnata (Ehrenberg) D.M. Williams et Round, 1988 were more abundant. Despite this initially low relative abundance, T. flocculosa str. IIIp quickly stabilized at ~25% of the total diatom sum in the rest of the zone. S. pinnata grew in abundance more gradually, reaching a peak of 25% only at the end of zone C (Fig. 2). At the beginning of the zone, CS/DV and pollen influx declined abruptly and remained relatively low, whereas aquatic pollen rapidly increased (Fig. 3). Total diatom influx showed a single peak at AD 1690, most likely caused by a low microsphere count for that sample, which created a false signal in the data. At the beginning of the zone, there was also an abrupt decrease in JJA precipitation to values below the long-term average for the record, which persisted throughout the zone.
Zone D (AD 1880–2010)
The relative abundance of F. crotonensis began to increase in zone D, at the same time that T. flocculosa str. IIIp and A. formosa declined. At AD 1900, Stephanodiscus minutulus (Kützing) Cleve et Möller, 1882 appeared abruptly in the record, reaching a brief peak at AD 1920 before declining. At the same time, Achnanthidium minutissimum (Kützing) Czarnecki, 1994 showed a small increase in relative abundance. After AD 1940, D. stelligera declined by 20%, whereas some of the more rare taxa increased slightly (Cyclotella distinguenda Hustedt in Gams, 1928; Staurosira construens Ehrenberg, 1843; Planothidium spp.; and Psammothidium spp.) (Fig. 2). Total diatom, pollen, and charcoal influx increased at the beginning of zone D and subsequently decreased at the end of the zone. Aquatic pollen and CS/DV only increased after AD 1930 but kept rising throughout the zone.
PCA
The PCA explained 41% of the variance in the diatom assemblages on the first three axes (Fig. 4; component 1, 17%; component 2, 14%; component 3, 10%). The first diatom PC axis represented changes in the abundance of T. flocculosa str. IIIp, F. crotonensis, and S. minutulus (Table 1). It had positive values in zones A and B (AD 1050–1630), negative values in zone C (AD 1640–1870), and larger negative values in zone D (AD 1880–2010) (Fig. 4). The second diatom PC axis had more high-frequency variability, but with two rather distinct shifts from negative to positive values; the first is the transition between zones B and C, and the second occurred in zone D at AD 1900. The second component was positively loaded on D. stelligera and negatively loaded on S. pinnata and Psammothidium spp. Finally, the third diatom PC axis had decreasing values at the transition between zones A and B, mostly negative values throughout zone C, and an abrupt increase to positive values in zone D at AD 1900. This axis was positively correlated with A. tenella, A. minutissimum, and Nitzschia spp.
Table 1. Loadings and explained variance (eigenvalues) of a principal components analysis on diatom percentages from Lac Noir, southwestern Québec.
As mentioned previously, the biostratigraphic zones were defined strictly by changes in the diatom PC axes. However, major changes in the Lac Noir pollen record, summarized in a separate PCA (Fig. 4, Table 2), occurred at the same key points in time. Likewise, a PCA including both species data (diatom and pollen PCs) and environmental variables from Lac Noir showed clear groupings of samples associated with each of the major biostratigraphic zones (Fig. 5).
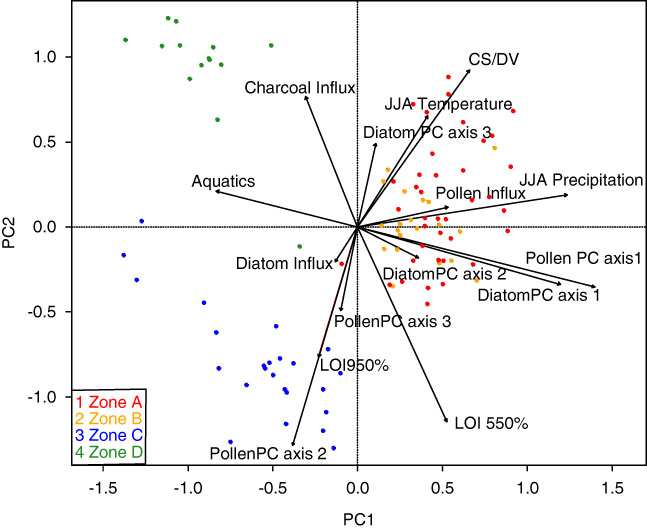
Figure 5. Biplot of a principal components analysis (PCA) of fossil diatom and pollen assemblages (summarized with separate PCAs) and environmental variables from samples in Lac Noir, southwestern Québec. Colored dots represent the biostratigraphic zones defined by the diatom PCA (see Fig. 4). (For interpretation of the references to color in this figure legend, the reader is referred to the web version of this article.) CS/DV, chrysophyte scale to diatom valve index; JJA, June, July, August; LOI, loss-on-ignition; PC, principal component.
Table 2. Loadings and explained variance (eigenvalues) of a principal components analysis on pollen percentages from Lac Noir, southwestern Québec (Paquette and Gajewski, Reference Paquette and Gajewski2013).

GAMs
In the first GAM, predictor variables explained 71% of the variance in the fitted diatom PC axis 1 scores. The largest contributor to the fitted values was pollen PC axis 1 (P value <0.001), which was interpreted as an indicator of both climate and watershed disturbances. In the time series representing the effects of this variable on the fitted diatom PC axis 1 scores (Fig. 6), two abrupt shifts toward negative values at ~AD 1630 and ~AD 1870 indicate rapid and synchronous changes in pollen and diatom assemblages. There were also shifts in the LOI 550% time series (toward positive values this time), though they lagged the transitions above by ~40–60 yr. Only one other variable, LOI 950%, was significant in this GAM, for a brief period between AD 1720 and 1870.
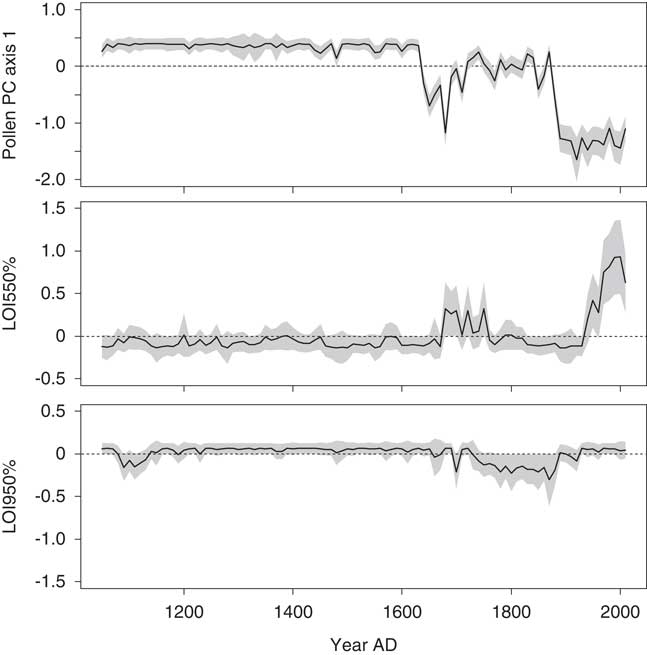
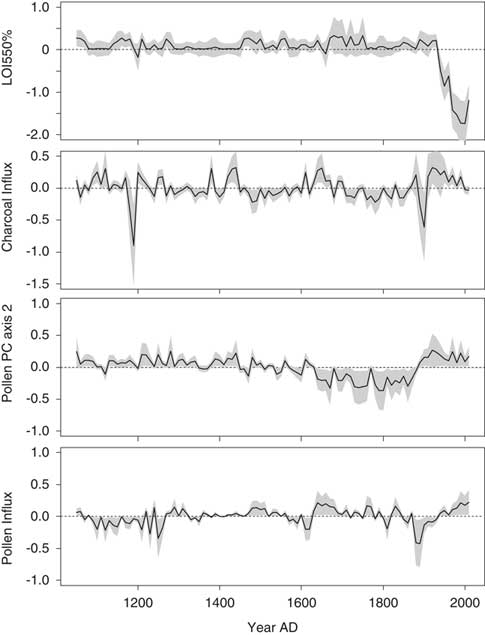
Figure 6. The contributions of environmental variables to the fitted diatom principal component (PC) axis 1 scores in the final generalized additive model for Lac Noir. A 95% pointwise confidence band is shown by the gray band. In the time series, the contribution of the variable is considered significantly different from the intercept when the gray band does not intersect the dashed zero line. LOI, loss-on-ignition.
Approximately 51% of the variance in the fitted diatom PC axis 2 scores was explained in the second GAM. The scores were most strongly influenced by LOI 550% in this model, with significant contributions occurring after AD 1920 (Fig. 7). The time series representing the contributions of charcoal and pollen influx were rather similar (e.g., a simultaneous peak at AD 1890). Changes in the time series representing the effects of pollen PC axis 2 were more gradual and closely resembled the biostratigraphic zones (defined by the diatom PCA). This predictor variable was interpreted as an indicator of climate.

Figure 7. The contributions of environmental variables to the fitted diatom principal component (PC) axis 2 scores in the final generalized additive model for Lac Noir. A 95% pointwise confidence band is shown by the gray band. In the time series, the contribution of the variable is considered significantly different from the intercept when the gray band does not intersect the dashed zero line. LOI, loss-on-ignition.
Finally, 43% of the variance in the fitted diatom PC axis 3 scores was explained in the third GAM. Several predictor variables contributed significantly to the fitted values, with the most influential being LOI 550% and pollen PC axis 1 (Fig. 8). Temporal trends in the contribution time series showed results similar to those from the GAMs described previously.
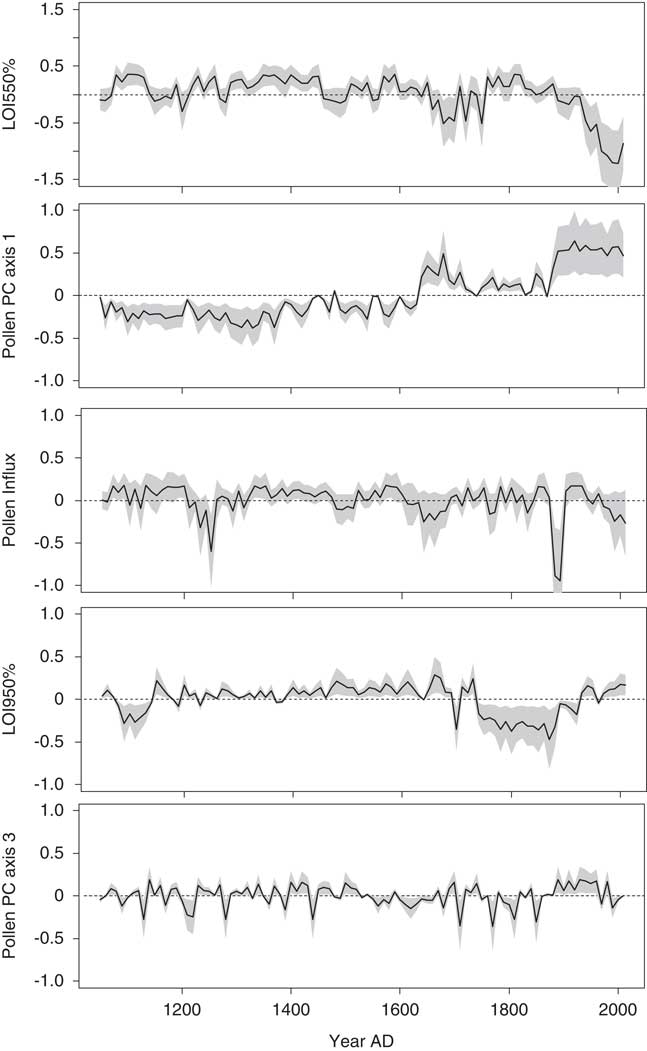
Figure 8. The contributions of environmental variables to the fitted diatom principal component (PC) axis 3 scores in the final generalized additive model for Lac Noir. A 95% pointwise confidence band is shown by the gray band. In the time series, the contribution of the variable is considered significantly different from the intercept when the gray band does not intersect the dashed zero line. LOI, loss-on-ignition.
DISCUSSION
Zone A: culmination of the MWP (AD 1050–1430)
The varve-based chronology from Lac Noir indicated an age of AD 1050 for the bottom of the core, which in southern Québec corresponded to the latter part of the MWP (~AD 800–1200; Viau et al., Reference Viau, Gajewski, Sawada and Fines2006, Reference Viau, Ladd and Gajewski2012). A local pollen record from the lake showed higher abundances of deciduous taxa and Tsuga during this period, as well as relatively low abundances of northern taxa (e.g., Picea) or taxa indicative of disturbance (e.g., shrubs, herbs, Pinus strobus). This led to a pollen-based summer (JJA) temperature reconstruction that was 0.5–1.0°C warmer than the long-term average for the late Holocene, with relatively high JJA precipitation (Paquette and Gajewski Reference Paquette and Gajewski2013). During the MWP, diatom assemblages in Lac Noir were dominated overall by T. flocculosa str. IIIp and D. stelligera. In addition to a greater proportion of chrysophytes relative to diatoms (CS/DV), this signaled an oligotrophic, circumneutral to slightly acidic lake, with limited primary productivity (Smol, Reference Smol1985; Köster et al., Reference Köster, Pienitz, Wolfe, Barry, Foster and Dixit2005; Puusepp and Kangur, Reference Puusepp and Kangur2010; Karmakar et al., Reference Karmakar, Laird and Cumming2015).
Throughout the MWP, the GAMs showed that the Lac Noir diatom communities were strongly influenced by the composition of the surrounding forest (pollen PC axis 1), which suggests that there was an overall association of the diatom flora with relatively warm and stable climatic conditions. Broadscale climate forcings (e.g., temperature, precipitation) could be interpreted as key drivers of aquatic responses (Williams et al., Reference Williams, Blois and Shuman2011), though this is not necessarily reflective of a direct relationship. Instead, shifts in diatom communities are often associated with secondary factors and catchment-mediated processes controlled by climate, such as DOC inputs, water turbidity, pH, nutrient concentrations, and light availability, among others (Morabito et al., Reference Morabito, Oggioni and Austoni2012; Fritz and Anderson, Reference Fritz and Anderson2013; Rühland et al., Reference Rühland, Paterson and Smol2015; Neil and Gajewski, Reference Neil and Gajewski2017). Tsuga-dominated forests, for example, are associated with humic-rich soils and greater inputs of dissolved organic carbon (DOC) to nearby lakes (Engstrom and Wright, Reference Engstrom and Wright1984). These types of environments would favor diatom taxa more tolerant of high DOC such as T. flocculosa str. IIIp (Camburn and Charles, Reference Camburn and Charles2000; Faulkenham et al., Reference Faulkenham, Hall, Dillon and Karst-Riddoch2003) and A. tenella (Haig et al., Reference Haig, Kingsbury, Laird, Leavitt, Laing and Cumming2013), both of which were abundant in Lac Noir when Tsuga percentages were at their maximum for the late Holocene.
Toward the end of the MWP, several records from southern Ontario and Québec (including Lac Noir), as well as the New England states (United States), showed a relatively synchronous response of diatom communities to gradual climate cooling (Philibert et al., Reference Philibert, Prairie and Carcaillet2003; Köster and Pienitz, Reference Köster and Pienitz2006; Neil and Gajewski, Reference Neil and Gajewski2017). In Connecticut (United States), the rise of A. tenella in Bates Pond at ~AD 1150 was interpreted as a response to cooling temperatures and reduced thermal stratification (Köster and Pienitz, Reference Köster and Pienitz2006). This taxon also appeared in Lac Noir at ~AD 1150 and increased after AD 1300, coinciding with cooling and greater seasonal rainfall reconstructed from the local pollen data (Paquette and Gajewski, Reference Paquette and Gajewski2013). A. tenella is a heavily silicified diatom more commonly found in lakes with turbulent waters and high DOC (Harris et al., Reference Harris, Cumming and Smol2006; Haig et al., Reference Haig, Kingsbury, Laird, Leavitt, Laing and Cumming2013; Rühland et al., Reference Rühland, Paterson and Smol2015). In the MWP, high-frequency variations in precipitation may have led to seasonal mixing of Lac Noir as well as greater inputs of humic-rich allogenic sediments and DOC from the catchment (Köster and Pienitz, Reference Köster and Pienitz2006; Stager et al., Reference Stager, Cumming, Laird, Garrigan-Piela, Neil, Wiltse, Lane, Nester and Ruzmaikin2017), thus creating optimal conditions for A. tenella.
Zone B: onset of the LIA (AD 1430–1630)
Subtle changes in the pollen record (e.g., increase in Pinus and Picea, decline in Tsuga and Fagus) at AD 1430 were accompanied by an increase in T. flocculosa str. IIIp at the expense of D. stelligera, suggesting that this marked the initial onset of LIA cooling in the region. An overall increase in the abundance of boreal taxa would result in greater soil acidity and inputs of DOC from the catchment (Fritz and Anderson, Reference Fritz and Anderson2013) and could explain the slight shift toward more acid-tolerant taxa such as T. flocculosa str. IIIp (Faulkenham et al., Reference Faulkenham, Hall, Dillon and Karst-Riddoch2003) at Lac Noir. Lake pH could be affected by weathering processes as well; for instance, an extended period of higher than average JJA precipitation inferred from the Lac Noir pollen record (Paquette and Gajewski, Reference Paquette and Gajewski2013) may have resulted in heavier losses of base cations from the surrounding soils, leading to a slightly more acidic lake environment (Boyle, Reference Boyle2007; Fritz and Anderson, Reference Fritz and Anderson2013).
Although the timing of the LIA at Lac Noir is in phase with intervals commonly used to define the period in eastern North America (Gajewski, Reference Gajewski1988; Viau et al., Reference Viau, Gajewski, Sawada and Fines2006, Reference Viau, Ladd and Gajewski2012; Mann et al., Reference Mann, Zhang, Hughes, Bradley, Miller, Rutherford and Ni2008), the PCA of combined environmental variables (Fig. 5) showed that diatom assemblages from zone A (the MWP) and zone B (the onset of the LIA) overlapped. This indicates that there was a smooth transition from one period to the next, and changes within the lake and in its surrounding catchment were not pronounced. The GAMs (Figs. 6, 7, and 8) confirmed that this transition was indistinct and revealed only slight responses in diatom communities to vegetation changes and/or disturbances (pollen PC axis 1 and 2), which was expected given minimal changes in local pollen assemblages at this time (Supplementary Fig. 1).
Zone C: peak of the LIA (AD 1630–1870)
At AD 1630, the Lac Noir pollen record showed a decline in pollen influx (Fig. 3), as well as the replacement of Tsuga and Fagus by Betula, Pinus strobus, and Alnus in the catchment (Supplementary Fig. 1), which was interpreted as a rapid shift to a cool climate and dry conditions associated with the peak of the LIA (Paquette and Gajewski, Reference Paquette and Gajewski2013). Within the lake, there was a decline in T. flocculosa str. IIIp percentages and CS/DV values and increases in A. formosa, F. crotonensis, D. stelligera, and S. pinnata, as well as total diatom influx; overall this indicated a shift to a slightly more nutrient-rich lake with relatively higher productivity (Smol, Reference Smol1985; Köster et al., Reference Köster, Pienitz, Wolfe, Barry, Foster and Dixit2005; Wolin and Stoermer, Reference Wolin and Stoermer2005; Pappas, Reference Pappas2010; Puusepp and Kangur, Reference Puusepp and Kangur2010) in comparison with that of the earlier record.
The GAMs showed sharp breaks in the time series representing the influences of vegetation and disturbances on diatom communities in Lac Noir (pollen PC axis 1 and 2; Figs. 6–8), signaling that changes in the surrounding forest were abrupt and had significant impacts on the diatom flora of the lake. For instance, deteriorating climatic conditions triggered disturbances and openings in the forest canopy, as evidenced by increasing abundances of Alnus, Pinus strobus, and other shrubs in local and regional pollen records (Paquette and Gajewski, Reference Paquette and Gajewski2013; Lafontaine-Boyer and Gajewski, Reference Lafontaine-Boyer and Gajewski2014). The initial opening of the forest in addition to enhanced soil erosion in the LIA (Stevenson et al., Reference Stevenson, Jones and Battarbee1990) likely facilitated transport of nutrients to nearby lakes (Hall and Smol, Reference Hall and Smol1993), promoting primary productivity. Changes in terrestrial vegetation composition have been shown to affect leaf litter quality and nutrient availability within lakes (Rawlence, Reference Rawlence1992). Forests composed of broad-leaved taxa (e.g., Betula and Alnus) contribute more nitrates (NO3 −) and phosphorus (P) to lakes through erosion and runoff than those dominated by conifers (e.g., Tsuga), favoring diatoms indicative of meso-eutrophic lake conditions (Hall and Smol, Reference Hall and Smol1993; Beck et al., Reference Beck, Medeiros and Finkelstein2016). Diatoms such as A. formosa and F. crotonensis are more competitive than Tabellaria sp. in lakes with moderate to high levels of N and silica (Saros et al., Reference Saros, Michel, Interlandi and Wolfe2005; Arnett et al., Reference Arnett, Saros and Mast2012) and are indicators of eutrophication in temperate lakes (Lotter, Reference Lotter1998). Increases in these taxa at Lac Noir thus support an inference of higher nitrogen concentrations (likely the primary limiting nutrient) and overall lake productivity during the peak of the LIA.
In contrast to the MWP, declining percentages of Tsuga as well as cooler and dry climatic conditions at the peak of the LIA (Paquette and Gajewski, Reference Paquette and Gajewski2013) may have led to less acidic waters and low DOC inputs, evidenced by an increase in D. stelligera and benthic alkaphilous taxa (e.g., S. pinnata) at the expense of T. flocculosa str. IIIp (Faulkenham et al., Reference Faulkenham, Hall, Dillon and Karst-Riddoch2003; Lavery et al., Reference Lavery, Kurek, Rühland, Gillis, Pisaric and Smol2014). Studies of Arctic and temperate lakes report conflicting findings in regard to optimal lake and/or climatic conditions for D. stelligera, even in sites within close proximity to one another (Saros and Anderson, Reference Saros and Anderson2015). Some studies suggest that D. stelligera is more abundant in warm conditions with greater thermal stratification (Perren et al., Reference Perren, Douglas and Anderson2009; Rühland et al., Reference Rühland, Paterson and Smol2015); however, at Lac Noir, as well as at other sites, there seems to be a definitive association of this small centric taxon to N concentrations (Fritz and Anderson, Reference Fritz and Anderson2013; Neil and Gajewski, Reference Neil and Gajewski2017) or even climate cooling as was described by Saros and Anderson (Reference Saros and Anderson2015) in relation to neoglaciation.
During the peak of the LIA, the Lac Noir diatom record again closely resembled that of Bates Pond in Connecticut (Köster and Pienitz, Reference Köster and Pienitz2006). At Bates Pond, increased abundances of benthic Fragilaria spp. (S. pinnata included) at AD 1640 were interpreted as a response to cooling climate conditions and prolonged seasonal ice cover. At other sites, extended ice cover has been shown to trigger internal releases and mobilization of P from lake sediments (Kirilova et al., Reference Kirilova, Heiri, Enters, Cremer, Lotter, Zolitschka and Hübener2009). S. pinnata has a slightly higher weighted average for TP and TN than other diatom taxa such as Tabellaria flocculosa str. IIIp (Hall and Smol, Reference Hall and Smol1996; Christie and Smol, Reference Christie and Smol1993), and thus increases in this taxon at Lac Noir may have signaled either internal or external nutrient loading during the cool, dry phase of the LIA. Increased abundances of small benthic Fragilaria spp. could indicate an expansion of the littoral zone as well (Karst and Smol, Reference Karst and Smol2000); at Lac Noir, low inferred JJA precipitation and greater abundances of aquatic macrophytes during the peak of the LIA (Fig. 3; Paquette and Gajewski, Reference Paquette and Gajewski2013) may have therefore led to optimal conditions for S. pinnata.
Zone D: post–Euro-Canadian settlement (AD 1870 to present)
The initial settlement and subsequent expansion of Euro-Canadian activities in southern Québec (~AD 1820–1875; Smith, Reference Smith1967; Neil and Gajewski, Reference Neil and Gajewski2017) corresponded broadly with the end of the LIA in the region (Gajewski, Reference Gajewski1988). The impacts of human-induced land clearance and burning of forests for agriculture in the region were prominent in the Lac Noir record after AD 1870; there was an abrupt increase in herbaceous pollen (Ambrosia, Poaceae, Plantaginaceae, Rumex) coinciding with an influx of microcharcoal in the lake sediments (Paquette and Gajewski, Reference Paquette and Gajewski2013). Disturbance associated with the colonization, such as logging or burning, may have increased the inputs of minerogenic materials to the lake (Rosén and Hammarlund, Reference Rosén and Hammarlund2007), possibly evidenced by a decline in organic matter content (Fig. 3).
Abrupt changes in the GAMs at AD 1870 confirm significant responses of the diatom flora to direct and indirect impacts of catchment disturbances (pollen PC axis 1 and LOI 550%; Figs. 6–8). Both climate (pollen PC axis 2) and terrestrial productivity (pollen influx) were also influencing factors on the lake ecosystem, although their contributions to diatom trends were gradual and subtler. Peaks in A. minutissimum and S. minutulus were recorded at Lac Noir from AD 1870–1930, slightly after initial settlement when anthropogenic activities and associated impacts on the landscape were high (Smith, Reference Smith1967). Regional deforestation as a result of land clearance and logging likely triggered the release of nutrients, particularly N, within the catchment (Vitousek et al., Reference Vitousek, Aber, Howarth, Likens, Matson, Schindler, Schlesinger and Tilman1997; Neil and Gajewski, Reference Neil and Gajewski2017), which ultimately caused the changes seen in the diatom flora at Lac Noir during this period; for instance, A. minutissimum is known to be responsive to nitrogenous influxes and pollution (Pappas, Reference Pappas2010). Multiple mechanisms related to human activities further contribute to the loading of P in lake ecosystems, including the use of fertilizers and manure in agricultural fields (presently located as close as 1 to 2 km east of Lac Noir), septic leaching into local groundwater and surface water, or atmospheric deposition of dust particles (Riemersma et al., Reference Riemersma, Little, Ontkean and Moskal-Hébert2006). Diatom calibration sets of lakes in southern Ontario and Québec suggest that S. minutulus has a weighted average (optima) of 549.5 μg/L for TN (Christie and Smol, Reference Christie and Smol1993) and 17.0 μg/L for TP (Tremblay et al., Reference Tremblay, Pienitz and Legendre2014). The peak in S. minutulus between AD 1870 and 1930 at Lac Noir was therefore reflective of meso-eutrophic conditions associated with anthropogenic activities and indicated TN and TP values that were roughly double those observed in the modern surface sample collected from Lac Noir soon after the core was retrieved (Cooper et al., Reference Cooper, Neil and Gajewski2016).
Greater atmospheric N deposition caused by fossil fuel combustion, agricultural practices, and other anthropogenic activities have been noted in recent decades, as evidenced by a rise in A. formosa and F. crotonensis in North American lakes (Hall and Smol, Reference Hall and Smol1996; Saros et al., Reference Saros, Michel, Interlandi and Wolfe2005; Arnett et al., Reference Arnett, Saros and Mast2012; Sheibley et al., Reference Sheilbley, Enache, Swarzenski, Moran and Foreman2014). Similar increases in these taxa were seen at Lac Noir after Euro-Canadian settlement, suggesting that this activity has had substantial influences on lakes in southern Québec. After AD 1930, the Lac Noir diatom record showed signs of progression toward a less productive ecosystem (e.g., disappearance of S. minutulus, higher CS/DV values, an increase in T. flocculosa str. IIIp), similar to that observed during the MWP. Human impacts on vegetation were less pronounced, and regional temperatures were once again warmer than the long-term average for the late Holocene (Paquette and Gajewski, Reference Paquette and Gajewski2013; Lafontaine-Boyer and Gajewski, Reference Lafontaine-Boyer and Gajewski2014). The more recent change in lake trophic state could be explained by a reduction in phosphorus concentrations resulting from better management practices (Riemersma et al., Reference Riemersma, Little, Ontkean and Moskal-Hébert2006) or perhaps the ability of early successional forests to better retain nutrients (Hall and Smol, Reference Hall and Smol1996).
Lac Noir and Lac Brûlé: a regional comparison of diatom/pollen records
A comparison of the paleorecords from Lac Brûlé and Lac Noir (25 km apart) showed that the vegetation surrounding each of the two sites responded to environmental changes similarly in timing and direction of change, with some exceptions (Lafontaine-Boyer and Gajewski, Reference Lafontaine-Boyer and Gajewski2014). Diatom community composition was more unique to each lake as a result of local catchment-scale characteristics, including basin morphometry, habitat availability, water chemistry, and disturbances (Blanco, Reference Blanco2014). Regardless, most of the pollen taxa and several of the abundant diatom species were common to both sites and were directly comparable (Fig. 9).
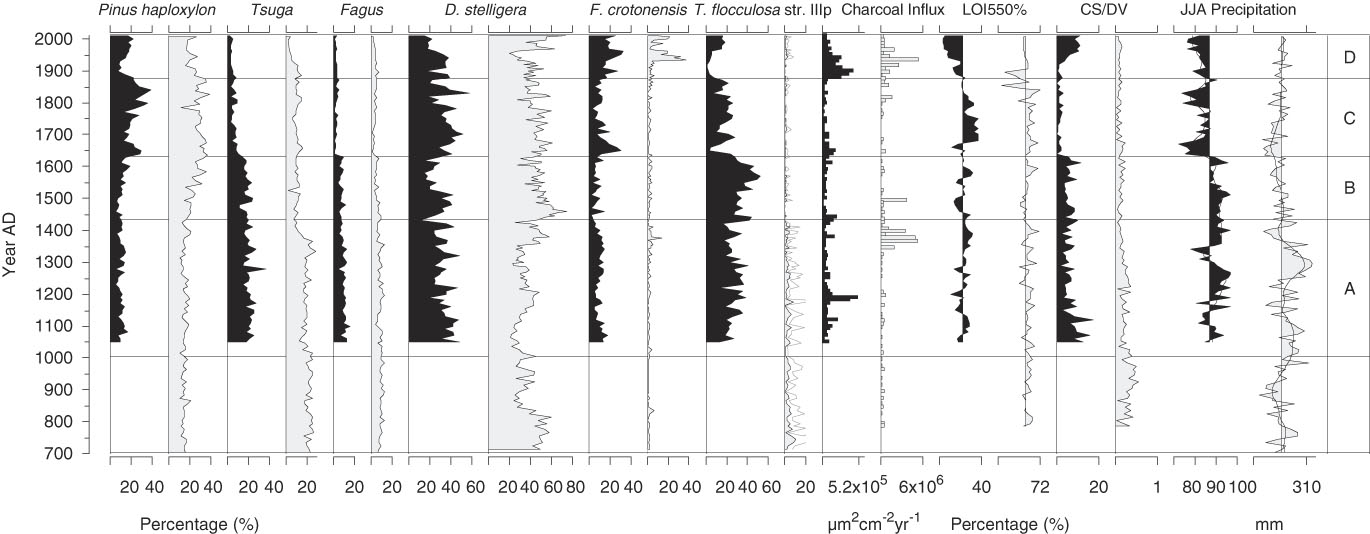
Figure 9. A comparison of selected pollen and diatom percentages and environmental variables from Lac Noir (black; this study; Paquette and Gajewski, Reference Paquette and Gajewski2013) and Lac Brûlé (grey; Lafontaine-Boyer and Gajewski, Reference Lafontaine-Boyer and Gajewski2014; Neil and Gajewski, Reference Neil and Gajewski2017). ). CS/DV, chrysophyte scale to diatom valve index; JJA, June, July, August; LOI, loss-on-ignition.
Inconsistency in the pollen records of the two lakes was mainly attributed to a decline in Tsuga that occurred earlier in Lac Brûlé at AD 1345, in response to a fire in the catchment (Fig. 9; indicated by a peak in charcoal influx). This disturbance was considered to be local, as there was no equivalent response in the Lac Noir record, despite the relatively close proximity of the two lakes (Lafontaine-Boyer and Gajewski, Reference Lafontaine-Boyer and Gajewski2014). At Lac Brûlé, the Tsuga decline triggered an influx of nutrients and DOC into the lake, also resulting in poor light penetration through the water column (Cooper et al., Reference Cooper, Neil and Gajewski2016; Neil and Gajewski, Reference Neil and Gajewski2017). This was reflected in the diatom assemblages as a decrease in the relative abundance of T. flocculosa str. IIIp. However, the overall nutrient status of Lac Brûlé did not appear to be greatly affected by the fire in the catchment area, as CS/DV values did not show any major changes at this time (Neil and Gajewski, Reference Neil and Gajewski2017).
In the absence of a local fire at Lac Noir, a similar decrease in Tsuga only occurred later in the record at AD 1630 and coincided with the deteriorating conditions at the peak of the LIA. At this time, most of the plant taxa represented in both lakes (e.g., Pinus strobus, Fagus) declined in abundance after exceeding a threshold that reduced growth and reproductive success. The Lac Noir record also revealed a tight coupling between diatom assemblages and abrupt, climate-driven vegetation responses in the catchment area. Greater nutrient availability associated with the shift in forest composition may have resulted in a more productive lake ecosystem, again evidenced by a decline in T. flocculosa str. IIIp and a peak in the percentages of A. formosa and F. crotonensis. As the decline in Tsuga was accompanied by additional changes in terrestrial vegetation at Lac Noir, such as a decline in Fagus, there were greater consequences for the nutrient status of the lake (e.g., a rapid decline in CS/DV values that was absent from the Lac Brûlé record).
Local forcings were responsible for triggering site-specific changes in the diatom records of Lac Brûlé and Lac Noir. For example, in both lakes, diatom assemblages in the uppermost samples representing the last 100 yr were dissimilar as they responded individually to changes in their respective environments. At Lac Brûlé, diatoms responded abruptly to impacts associated with the Wallingford-Back Mine (AD 1924–1972), located approximately 300 m north of the lake (Neil and Gajewski, Reference Neil and Gajewski2017). Mining operations did not significantly affect the surrounding vegetation, though increases in the percentages of F. crotonensis at Lac Brûlé to well above previous values indicated nutrient enrichment of the lake associated with human activity. Diatom assemblages from Lac Noir were relatively undisturbed in comparison, with major changes only occurring concurrently with vegetation shifts in the catchment after AD 1870.
CONCLUSIONS
The timing of zone boundaries delineated by the diatom assemblages of Lac Noir, southwestern Ontario, match major shifts in pollen relative abundance and influx, as well as peaks in charcoal input to the sediment and, to a certain extent, transitions in sediment organic matter and carbonates. This indicates a close coupling of the lake ecosystem to terrestrial vegetation dynamics in the catchment and surrounding region. Multiproxy paleolimnological studies with sampling at high resolution are thus necessary to unraveling the intricate dynamics of climatic and terrestrial influences on lake aquatic communities. These types of studies not only provide necessary details regarding the succession of past communities, but also represent a key component in forecasting future responses to climate variability and human-induced disturbances.
SUPPLEMENTARY MATERIAL
To view supplementary material for this article, please visit https://doi.org/10.1017/qua.2018.99
ACKNOWLEDGMENTS
This project was funded by a Discovery Grant from the Natural Sciences and Engineering Research Council of Canada. We thank François Fortier and Peter Langlois for access to Lac Noir, and Nathalie Paquette for providing her data for the lake.