


Introduction
Carbohydrate is the major source of energy and regulator of appetite in the human diet; satiety follows the order: fat > carbohydrates > proteins. Ketosis refers to a condition in which the liver starts producing ketones owing to the lack of sufficient energy supply to the brain. Sometimes ketosis is induced by lowering the carbohydrate intake (20–50 g/d) to counter obesity. Prolonged ketosis may also cause short-term effects such as dizziness and vomiting(Reference Masood, Annamaraju and Uppaluri1). American Diabetes Association has recommended a carbohydrate intake of 130 g/d, the minimum practical requirement(Reference Feinman, Pogozelski and Astrup2). While the dietary role of carbohydrates is indispensable, millions around the world suffer impaired glucose tolerance, and it is estimated that around 10.2% of the world population will be diabetic by 2030(Reference Saeedi, Petersohn and Salpea3). A thorough understanding of carbohydrates in the diet is crucial for the management of diabetes and cardiovascular diseases (CVD), and this explains the emergence of the concept of carbohydrate counting for diabetic people taking insulin. Beyond carbohydrate counting, continuous glucose monitoring, which relates the aspects of glucose concentration with time, body weight, and glucose and insulin clearance, can be a valuable tool(Reference Melish4).
The biological value of dietary glucose is quantified in terms of the glycaemic index (GI). GI represents the blood-glucose-raising potential of a food compared with that of the same quantity of a reference food material (such as white bread/pure glucose)(Reference Jenkins, Wolever and Taylor5). Another closely related term is the glycaemic load (GL), also considering the amount of carbohydrate in a portion of food. The concept of GL better explains glycaemic responses when mixed meals containing components with varying GI values are consumed. Theoretically, a carbohydrate-rich meal with a large serving size tends to increase the GL. In other words, GL is directly linked with the serving size and carbohydrate content(Reference Livesey, Taylor and Livesey6). Based on differences in GL, foods can be classified as high (GL ≥ 20), medium (11 ≥ GL ≥ 19) and low (GL ≤ 10)(Reference Vega-López, Venn and Slavin7).
Another important terminology is the glycaemic response. GI relates to the intrinsic characteristics and is an index representing the carbohydrate quality of a food, whereas glycaemic response relates to the variations in glucose concentration responses in an individual after consumption of a food(Reference Augustin, Kendall and Jenkins8,Reference Marinangeli, Castellano and Torrance9) . Given this, controversies on the legitimacy of GI can be simplified and the concept can be viewed as one that is reliable, provided its methods of determination are standardised and made universal because only a handful of assessment methods have validated their protocols(Reference Brouwer-Brolsma, Berendsen and Sluik10).
Foods can be classified as low GI (GI ≤ 55), medium GI (56 ≤ GI ≤ 69) or high GI (GI ≥ 70)(Reference Wolever, Meynier and Jenkins11). However, this classification can be misleading; for example, the GI of white bread is 62.4 ± 15.3. Such high standard deviation values appear ambiguous and do not allow precise conclusions to make food choices(Reference Matthan, Ausman and Meng12). Nevertheless, considering the sampled population (ten human subjects), the authors justified that this error margin is within acceptable limits (less than ±20%), and with >1% probability of misclassification, the results can be used for nutritional labeling. It is important to note that many GI certification agencies use a specific GI symbol for low-GI foods(13).
Understanding the GI is important for diet-planning schemes for people with diabetes, dyslipidemia, CVD, and certain types of cancers(Reference Clar, Al-Khudairy and Loveman14-Reference Zafar, Mills and Zheng16). Meta-analyses have detailed the effect of long-term consumption of low-GI diets on body condition for people with common non-communicable diseases such as type 1 and type 2 diabetes, CVD, and obesity(Reference Livesey and Livesey17). It establishes that controlling the GI has implications for total glycaemic regulation in subjects with impaired glycaemic response, and reduces serum triacylglycerides in subjects with hypertriglyceridemia(Reference Eleazu18). Diet based on low-GI foods showed that reduction in GL by 28 units reduced both systolic and diastolic blood pressure(Reference Evans, Greenwood and Threapleton19). Importantly, significant improvements in weight loss, lipid profiles associated with blood pressure(Reference Unwin, Tobin and Murray20) and glycated hemoglobin (HbA1c) in the blood have been reported(Reference Pavithran, Kumar and Menon21). Diets with high GL are associated with risk of coronary heart disease(Reference Mathews, Liebenberg and Mathews22). A study conducted in Wistar rats with prolonged administration of high-GI diet revealed deposition of ectopic fat in liver and pancreas(Reference Luz, dos Santos Figueredo and Salviano23), which is linked to insulin resistance(Reference Trouwborst, Bowser and Goossens24). Dieting with low-GI foods helps to promote fat oxidation (by reducing fat storage) even in a sedentary state and minimise fluctuations in post-prandial glucose levels in the blood when compared with high-GI foods(Reference Kaur, Quek Yu Chin and Camps25). This is because low-GI foods are generally rich in protein or fiber and do not significantly increase calories, but promote satiety(Reference Papakonstantinou, Orfanakos and Farajian26,Reference Gbenga-Fabusiwa, Oladele and Oboh27) .
Several factors influence GI, including processing conditions of foods, nature of food structure, food groups, maturity of fruits/vegetables, nutrients, chyme viscosity, enzyme inhibitors and starch composition, as shown in Fig. 1. These factors have to be taken into consideration when designing a food product with low GI. For example, due to high temperature and high humidity during cooking, starch granules absorb water and get irreversibly disrupted, losing their crystalline structure, which makes them vulnerable to amylases and glucosidases(Reference Lin28), thus increases their GI. Natural inhibitors of amylases and glucosidases are present in polyphenols and flavonoids. Therefore, a mixed meal combining fruits, vegetables(Reference Akhtar, Layla and Sestili29) and legumes rich in polyphenols and flavonoids are one such approach to reduce the overall GI of a meal(Reference Turco, Bacchetti and Morresi30). It is also reported that pasting of starch in wheat flour reduces GI because of the formation of melanoidins due to the Millard reaction; melanoidins inhibit α-glucosidase activity during cooking of wheat flour, resulting in a reduced GI(Reference Adefegha, Olasehinde and Oboh31). To give a further example, rice normally has a high GI, and since rice is one of the staple foods, an attempt has been made to reduce the GI by adjusting the cooking temperature and water ratio. Rice cooked under the optimised conditions of 82°C with a water to rice ratio of 1.9 had a lower GI when compared with rice cooked at higher temperature and with lower water content, because the latter condition creates more voids and degrades the starch quickly, making it vulnerable to digestive enzymes(Reference Ritudomphol and Luangsakul32). Even the physical state of food (solid/liquid) influences the glycaemic response pattern, i.e. solid starchy foods have sustained glucose release whereas liquid foods cause a sudden drop in glucose response after 30 min, but the overall glycaemic area under the curve is not significantly different for some of the solid or liquid foods because it also depends on nutrient composition(Reference Shafaeizadeh, Muhardi and Henry33,Reference Liu, Ye and Zhang34) .
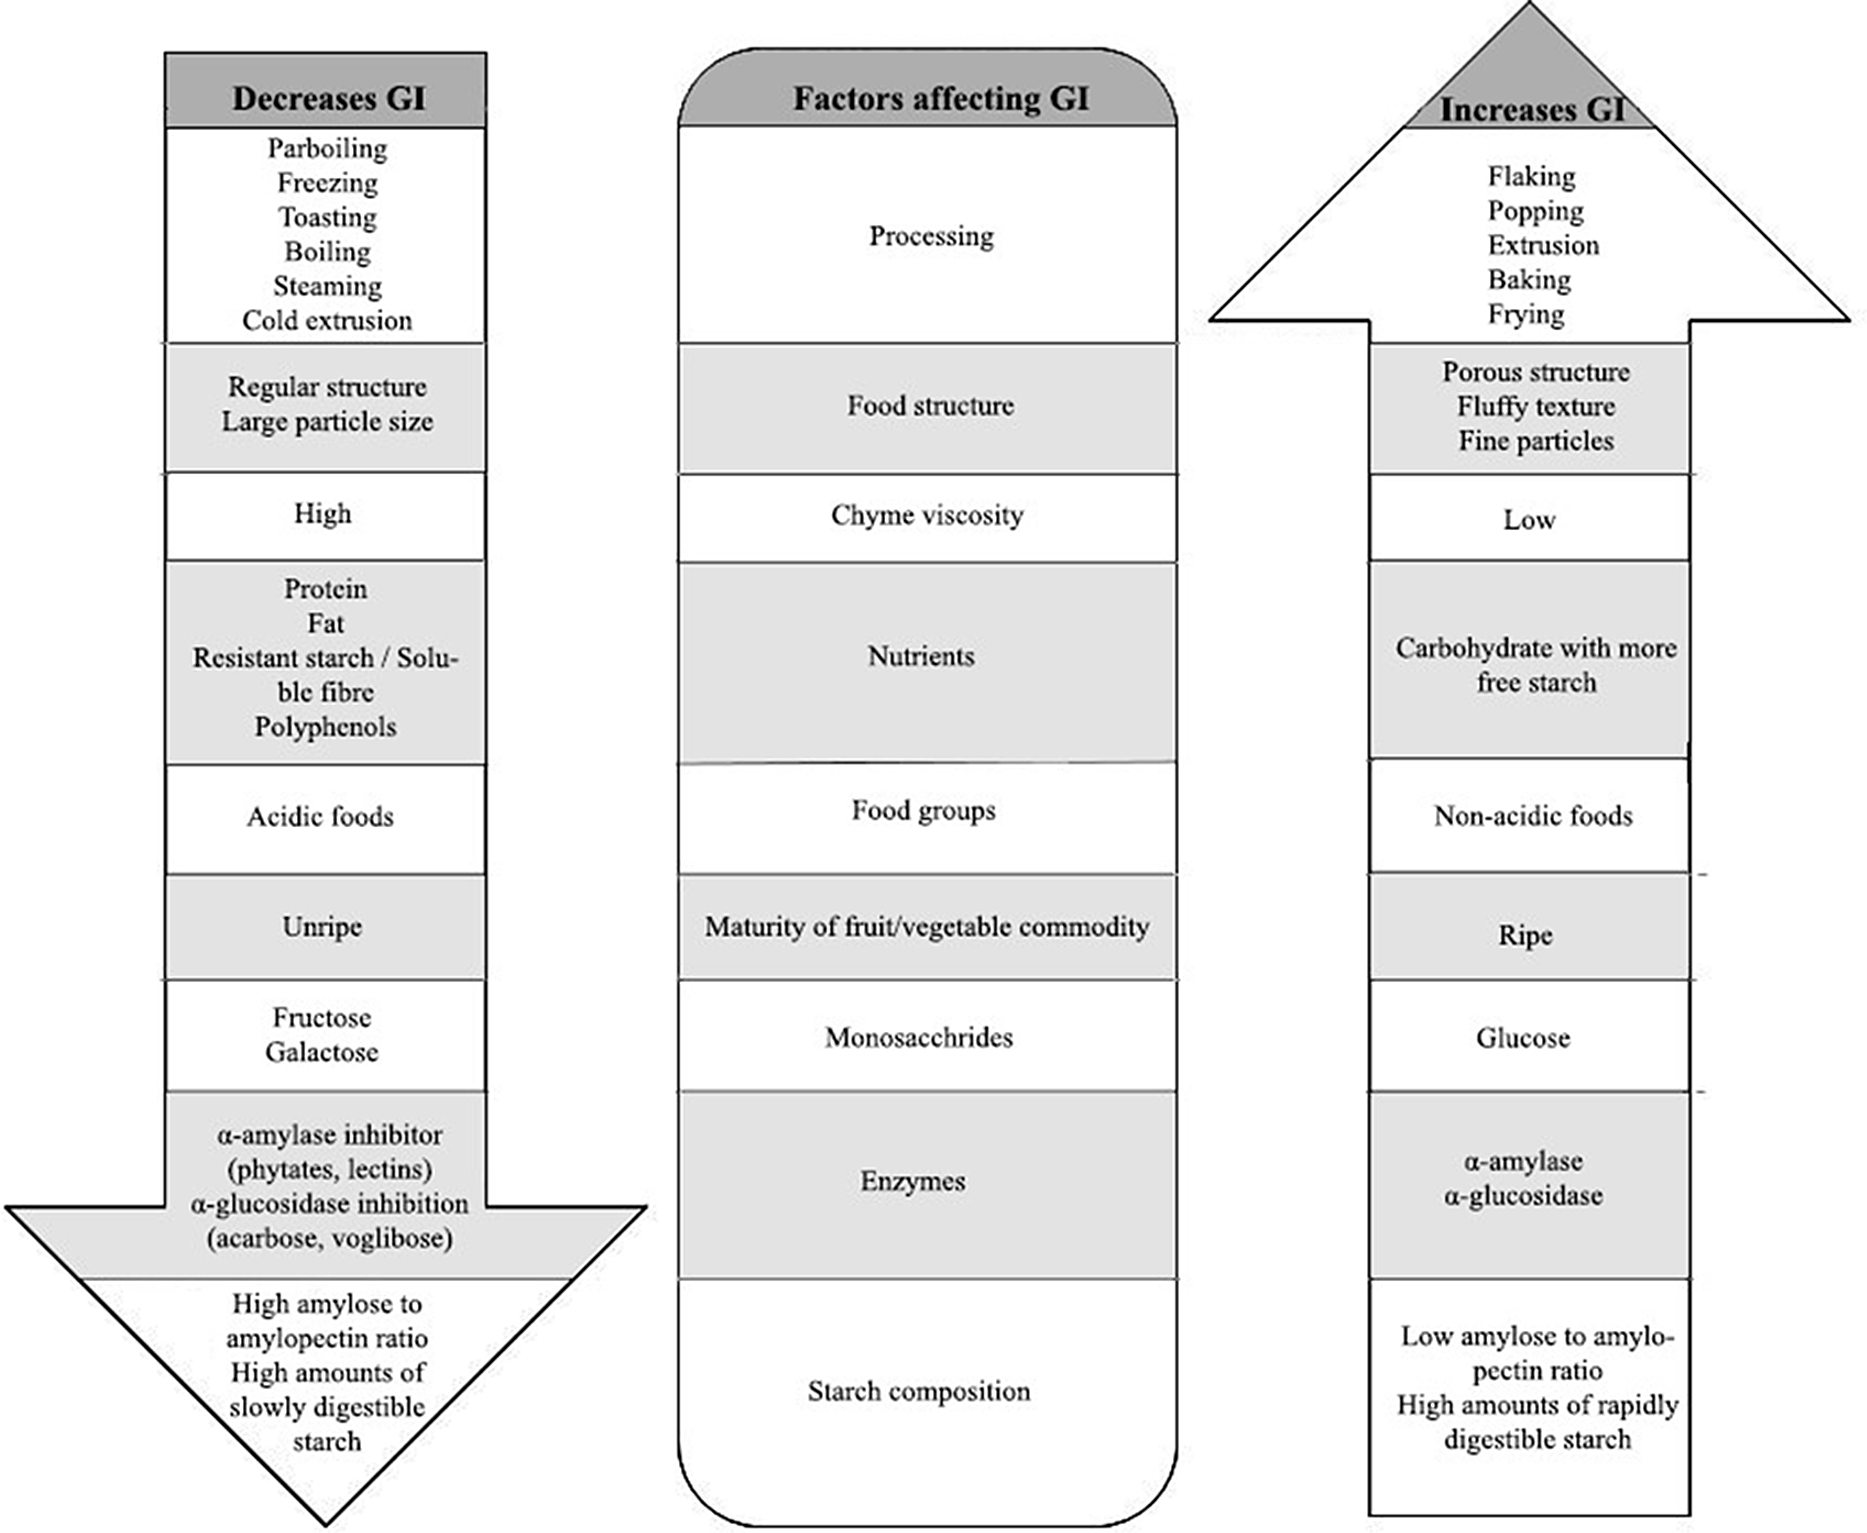
Fig. 1. Factors affecting GI of food products
GI assessment is in great demand, because of the various health benefits of low GI foods. One of the widely used assessments on the GI and GL of meal composition is capillary human blood sampling for glucose response (in vivo)(Reference Yeboah, Agbenohervi and Sampson35). GI studies have to take into account sampling size, organisation of control groups, population demographics, variation in ethnicity of population, age groups and methodological factors(Reference Brouwer-Brolsma, Berendsen and Sluik10).
On the other hand, human trials are costly and time-consuming, and have ethical and subject screening constraints, which in turn discourages the testing of new foods based on carbohydrates for GI(Reference Fogel36). Considering this, some studies have transitioned to the use of animal models, but the suffering, discomfort and death endured by animals during laboratory studies have long been a subject of controversy(Reference Doke and Dhawale37). Therefore, other predictive testing approaches such as computational modelling have been recently used to conduct GI studies(Reference Lamond, Janssen and Mackie38). However, their relevance to real-time data is a big concern. Thus, various digestion models have been developed to achieve better accuracy and precision in predicting GI. The objective of this review work is to critically analyse the conventional GI methods and emerging approaches for GI prediction and to evaluate their relevance with in vivo records. This may allow extending the commercialisation of new food products with specific GI values for people with CVD and diabetes.
Food digestion and GI
Digestion starts in the mouth, after which food is further broken down into smaller fragments in the stomach. Then, the intestine absorbs monosaccharides, which enter the bloodstream. Most of the glucose is carried by blood, and the excess of glucose is stored as glycogen by the liver and muscles(Reference Hantzidiamantis and Lappin39). The structure of food and composition of foods with high or low GI alters the digestion metabolism which, in turn, is reflected in glycaemic response.
Food digestion involves three important stages: oral phase, stomach phase and intestine phase (Fig. 2).
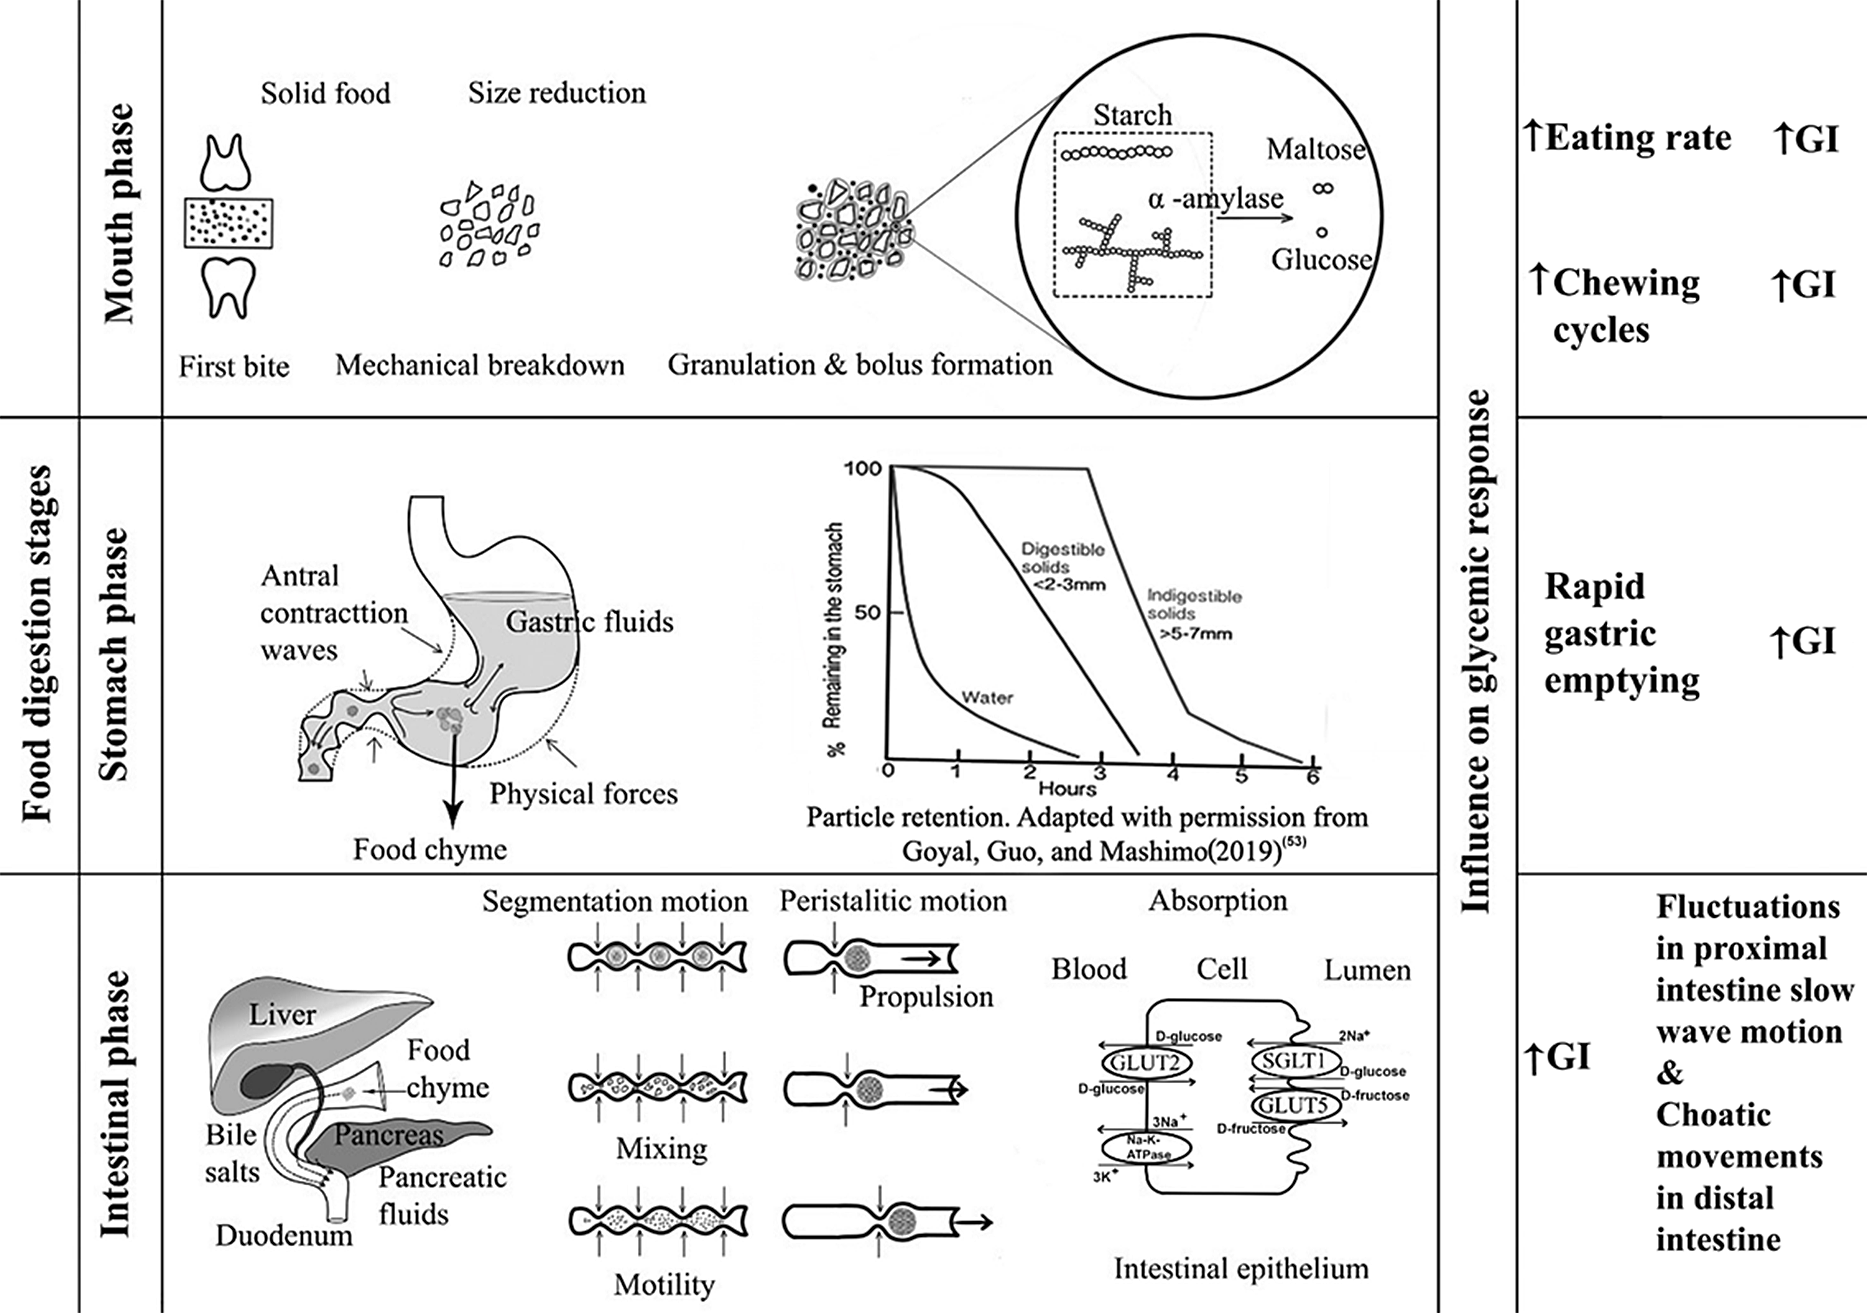
Fig. 2. Digestion stages and their influence on GI
Oral phase
During mechanical degradation by the teeth, starchy food materials are wetted with saliva during oral processing until a bolus is formed(Reference Sethupathy, Moses and Anandharamakrishnan40). Carbohydrate digestion begins in the mouth, in which salivary secretions containing salivary α-amylase begin hydrolysis of starch, breaking the starch into different molecular fragments. In the oral phase, food bolus from the mouth can take less than 2 s, but up to 15 s, to traverse the oesophagus(Reference Ahuja and Chan41). The pH in the oral phase is usually about 6.5–7. Salivary amylase activity is stopped when the pH within the stomach decreases. Depending on the food and the characteristics of each individual, the oral breakdown or destruction of food during mastication is highly variable(Reference Laguna, Barrowclough and Chen42). Particle size distribution and disintegration of food bolus depends on the texture of the food. For example, bread made of oat flakes has a larger particle size after mastication than bread made out of oat flour. The larger particle size results in less starch hydrolysis, suggesting that the lesser the breakdown, the lower the susceptibility to amylase(Reference Gamero, Nguyen and Varela43). Rapid consumption without proper chewing results in an increased glycaemic response(Reference Kumari and Mathana44). This may be because rapid consumption may result in a large volume of food ingestion whereas well-chewed food can decrease food intake by one third; also, when bite sizes are large, oral processing time is less and vice versa(Reference Argyrakopoulou, Simati and Dimitriadis45). The degradation rate of starch is reported to be dependent on the volume and activity of the α-amylase present in the saliva. This means, because of the exposure of the food to more saliva and the prolonged stay of food in the mouth, greater breakdown of starch occurs but the speed of ingestion is greatly reduced, and therefore the GI is likely to be lower(Reference Bridges, Smythe and Reddrick46). According to Tan et al. (Reference Tan, Ooi and Kapur47), greater number of chews within a short period increases the glycaemic response. The higher the number of mastication cycles, the higher the glycaemic response for the same GL, provided the eating rate is higher(Reference Hollis48).
Stomach phase
The stomach serves as grinding, mixing and storing organ which receives the bolus from the oesophagus. As the bolus reaches the gastric phase, the pH changes to 1.5–3.5. The inner walls of the stomach are covered by a glycoprotein called mucin, which protects the internal stomach from the acidic environment(Reference Grimble49). The average amount of time a meal stays inside the stomach is around 1–2 h, depending on the composition of the food. The pepsinogen (precursor of pepsin) released by stomach walls helps in protein digestion(Reference Boland50). While inside the stomach, there are not many enzymes for carbohydrates. Starch hydrates inside the stomach and increases its intake of bulk and liquids. The physical forces acting on the stomach include peristaltic movements called antral contraction waves, promoting the mixing process, which disperses nearly all the soluble carbohydrates. The antral contraction waves, which appear to push the liquid portion towards the pyloric end, regulate the liquidity of the digested chyme entering the duodenum(Reference Gopirajah, Keshav and Wadhwa51,Reference Gopirajah and Anandharamakrishnan52) . These contraction waves in the antral region cause a sieving effect, which allows only particles smaller than 2 mm to pass through the pylorus end to the intestine for further digestion. Foods with larger particle size are returned to the stomach for further digestion(Reference Goyal, Guo and Mashimo53). This is directly related to the emptying rate of the food from the stomach. High-viscosity meals slow down gastric emptying. The rate at which gastric emptying occurs is the key regulator for digestion and absorption of food entering the small intestine and is essential for regulating post-prandial glycaemic response(Reference Kong and Singh54). The rate of emptying having an exponential effect is determined by the volume, osmolality, acidity and fat emulsion presence(Reference Pletsch and Hamaker55). Low-GI foods have greater gastric content and slower gastric emptying when compared with high-GI foods, which is attributed to the higher fiber content of low-GI foods(Reference Bawden, Stephenson and Falcone56). Delayed gastric emptying lowers the GI(Reference Mackie, Bajka and Rigby57).
Small intestine
After the stomach, some of the carbohydrates present in the chyme are still in the form of polymers. Starch hydrolysis is completed, and absorption takes place in the small intestine. This mechanism is facilitated by pancreatic α-amylase, which is released into the duodenum as a key component of pancreatic fluid by pancreatic acinar cells(Reference Lamond, Janssen and Mackie38,Reference Date, Satoh and Iida58,Reference Janiak59) . During this process, amylose in the starch is broken down into maltose and glucose molecules by breaking the α-1,4 glycosidic bonds, and amylopectin is broken down into maltose, isomaltose and dextrins. Among these, glucose is the main carbohydrate entering enterocytes and eventually being distributed to the bloodstream(Reference Sinnott, Cleary and Harrison60). Absorption of glucose through enterocytes occurs by sodium-dependent carrier-mediated transport, called active transport, whereas absorption of fructose occurs through carrier-mediated facilitated diffusion, but most types of fructose are transported by passive diffusion with cotransporter GLUT5, separated from glucose and galactose mechanisms. Other oligosaccharides are hydrolysed by various brush border enzymes such as maltase, isomaltase, trehalase, sucrase and lactase(Reference Omer and Quigley61). Glucose is the main end product of carbohydrate digestion and serves as the primary fuel for normal brain and cell functioning(Reference Patching62). In addition to enzymes, pancreatic hormones play a crucial role in glucose metabolism and homeostasis in the body. The pancreas has five distinct cell types creating specific endocrine hormones, of which α cells from islets of the pancreas producing glucagon and β cells producing insulin are the focal hormones that are directly involved in glucose control. Amylin is another hormone co-produced with insulin acting as a satiety agent that also functions to inhibit glucagon production. C-peptide is also a similar substance generated in the pancreas as a by-product of insulin, whereas somatostatin and ghrelin function as growth regulators and appetite-inducing hormones, respectively(Reference Röder, Wu and Liu63). For the study of glycaemic response, insulin and glucagon are of interest because insulin is the main hormone that tends to reduce blood glucose levels while glucagon raises it, and somatostatin stops the function of both insulin and glucagon(Reference Navale and Paranjape64). There are also other important sets of hormones apart from insulin and glucagon involved in glucose regulation: incretins (glucagon-like peptide 1 and glucose-dependent insulinotropic peptide, called GLP-1 and GIP, respectively, and produced by L-cells and K cells of the intestine), epinephrine and cortisol. Intake of high-GI foods induces rapid release of GIP, which is largely available in the proximal intestine, increasing glucose absorption compared with low-GI foods. GIP is known to stimulate osteopontin release, a cytokine that is associated with insulin resistance(Reference Pfeiffer and Keyhani-Nejad65), whereas consumption of low-GI foods elicits the release of GLP-1, which is produced in the distal intestine(Reference Nounmusig, Kongkachuichai and Sirichakwal66). GLP-1 has been shown to be independent of glucose kinetics and may also be influenced by food characteristics(Reference Eelderink, Noort and Sozer67). This incretin helps to promote the feeling of satiety and even delays gastric emptying; it also suppresses glucagon release and increases insulin sensitivity, thereby improving overall glycaemic control(Reference Hira, Pinyo and Hara68). Ingestion of low-GI products causes GIP-producing K cells to decrease the rate of glucose entry into the small intestine, in turn, reducing the secretion of gastric acid and emptying rate. In addition to GIP, GLP-1 stimulates insulin and inhibits glucagon release based on glucose kinetics. This will stabilise the post-prandial increase in blood glucose, eventually managing the secretion of incretins (GLP1 and GIP) and the absorption of glucose at a sustained rate(Reference Vella and Camilleri69). Besides, there are many other complex pathways and hormones in the body that maintain glucose homeostasis(Reference Röder, Wu and Liu63). Further, dipeptidyl peptidase-4 (DPP-4) inhibitor, an enzyme that manages incretin hormones, influences glycaemic control. DPP-4 prevents the inactivation of GLP-1, thereby improving blood glucose concentration balance. This aspect requires improved understanding as studies also suggest that DPP-4 inhibitors may not be related to dietary intake of low-GI foods(Reference Kamoi, Inoue and Kontai70).
Apart from enzymes and hormones, another important factor for changes in post-prandial glucose response is intestinal motility. The two major types of motility patterns are segmentation motion and peristalsis. The first type contributes to mixing and chopping the chyme which is formed as smaller segmental contractions and the latter contributes to propelling the digested food towards the large intestine. During both of these processes, absorption of nutrients is enhanced(Reference Zhang, Wu and Jeantet71). High-GI foods affect myoelectrical activities by inhibiting proximal intestine (duodenum) contractions and increasing contraction strength in the distal intestine (ileum)(Reference Liu, Ye and Zhang34). Owing to the complexity of the aforementioned process, determination of glycaemic response due to diet intake requires further understanding. Food composition such as foods rich in soluble dietary fiber tends to reduce GI because dietary fiber forms a gel which protects starch from further degradation even in the small intestine and is finally pushed to the large intestine where it is fermented or excreted(Reference Avberšek Lužnik, Lušnic Polak and Demšar72).
Measurement of glycaemic response
The 34th Joint FAO-WHO Expert Committee Report on Food Additives meeting developed a strategy for considering knowledge on the bioavailability of residues, specifically for their use in nutritional intake estimates(73). In these situations, after consumption of a meal, the GI on dietary intake can be regarded as the bioavailability of glucose; to date, the official method for this measurement involves estimating the GI with human subjects (in vivo tests)(Reference Wolever, Meynier and Jenkins11).
In vivo human glycaemic response
For a long time, human blood glucose was measured using devices such as self-monitoring systems that typically have a small fingerprick needle and an oxidising indicator bio-sensing strip. Also used are other continuous monitoring devices that measure interstitial fluid with a glucose sensor tip inserted underneath subcutaneous tissue below the skin. The accuracy of this continuous monitoring devices is a big concern(Reference Heinemann and Stuhr74). Glucose measurement is also done by means of glucose oxidase and peroxidase, which is also used in glucose biosensors(Reference Zhang and Hoshino75). Normally, for conducting in vivo human studies, 50 g of available carbohydrates is given to the volunteers within 15 min, along with 250 to 300 ml of water, and blood glucose is assessed during a certain predetermined time frame (usually 2 h). In human in-vivo glucose response values, incremental area under the curve method is usually used for the calculation of GI(Reference Matthan, Ausman and Meng12).
For the calculation of incremental area under the curve, the general calculation uses the trapezoid rule, which is a widely used method for GI determination from human in vivo data. The calculation for the area under the curve was determined using the following methods(Reference Brouns, Bjorck and Frayn76):
For x = 1, the following equation (1) is used:
 $$if\;{G_1}{\rm{ }} \ge {G_0},{A_1} = \left( {{G_1} - {G_0}} \right) \times {{{t_1} - {t_0}} \over 2}\;;otherwise\;{A_1} = 0$$
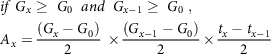
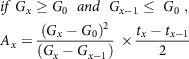
For x > 1, any of the equations from (2–5) is used based on specified conditions
 $$\eqalign{
& if\;{G_x} \ge \;{G_0}\;\;and\;\;{G_{x - 1}} \ge \;{G_0}\;,\; \cr
& {A_x} = {{\left( {{G_x} - {G_0}} \right)} \over 2}\; \times {{\left( {{G_{x - 1}} - {G_0}} \right)} \over 2} \times {{{t_x} - {t_{x - 1}}} \over 2} \cr} $$
$$\eqalign{
& if\;{G_x} \ge \;{G_0}\;\;and\;\;{G_{x - 1}} \ge \;{G_0}\;,\; \cr
& {A_x} = {{\left( {{G_x} - {G_0}} \right)} \over 2}\; \times {{\left( {{G_{x - 1}} - {G_0}} \right)} \over 2} \times {{{t_x} - {t_{x - 1}}} \over 2} \cr} $$
 $$\eqalign{
& if\;{G_x} \ge {G_0}\;\;and\;\;{G_{x - 1}} \le \;{G_0}\;, \cr
& {A_x} = {{{{\left( {{G_x} - {G_0}} \right)}^2}} \over {\left( {{G_x} - {G_{x - 1}}} \right)}}\; \times {{{t_x} - {t_{x - 1}}} \over 2} \cr} $$
$$\eqalign{
& if\;{G_x} \ge {G_0}\;\;and\;\;{G_{x - 1}} \le \;{G_0}\;, \cr
& {A_x} = {{{{\left( {{G_x} - {G_0}} \right)}^2}} \over {\left( {{G_x} - {G_{x - 1}}} \right)}}\; \times {{{t_x} - {t_{x - 1}}} \over 2} \cr} $$
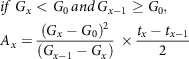 $$\eqalign{
& if\;{G_x} < {G_0}{\mkern 1mu} and{\mkern 1mu} {G_{x - 1}} \ge {G_0}, \cr
& {A_x} = {{{{\left( {{G_x} - {G_0}} \right)}^2}} \over {\left( {{G_{x - 1}} - {G_x}} \right)}}\; \times {{{t_x} - {t_{x - 1}}} \over 2} \cr} $$
$$\eqalign{
& if\;{G_x} < {G_0}{\mkern 1mu} and{\mkern 1mu} {G_{x - 1}} \ge {G_0}, \cr
& {A_x} = {{{{\left( {{G_x} - {G_0}} \right)}^2}} \over {\left( {{G_{x - 1}} - {G_x}} \right)}}\; \times {{{t_x} - {t_{x - 1}}} \over 2} \cr} $$
 $$if\ {G_x} < {G_0}\ \ and\ \ {G_{x - 1}} < {G_0}\ ,\ {A_x} = 0$$
where G is the glucose released at different time intervals; A is the area under the curve; x is intervals; t is the time.
The general calculation was that upon intake of each food, the area under the curve was expressed as the percentage of average area under the curve after the same subject had taken oral glucose, as given in equation (6). The total average of these values is given as the GI of food(Reference Wolever77). Here, the area under the curve is calculated based on the trapezoid rule:
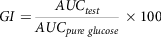 $$GI = {{AU{C_{test}}} \over {AU{C_{pure\ {\rm{}}glucose}}}}{\rm{}} \times 100$$
where AUC is the area under the curve.
Different methods have been suggested(Reference Wolever77) for the calculation of area under the curve: iAUC as the incremental area under the curve ignoring the total area underneath the fasting state; AUCnet is the net incremental area under curve including the total area underneath the fasting state; AUCcut is the cut area under the curve which includes only the area under which the blood glucose concentration drops below the baseline; AUCmin is determined by deducting the lowest blood glucose obtained from any of the other blood glucose concentrations during the last test cycle and adding the region under the curve to the resulting increments.
Similarly, in another study(Reference Dodd, Williams and Brown78), an attempt was made to estimate the GI of mixed food meals. The GI of three different types of food mixes was determined in thirty human volunteers. This study attempted a method (7) which could calculate the GI of mixed meals.
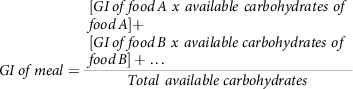 $$GI\,of\,meal = {{\matrix{ \matrix{ [GI\,of\,food\,A\ x\ available\ carbohydrates\ of \hfill \cr food\,A] + \hfill \cr} \cr \matrix{ [GI\,of\,food\,B\ x\ available\ carbohydrates\ of \hfill \cr food\,B] + \ldots \hfill \cr} \cr } } \over {Total\ available\ carbohydrates}}$$
Nevertheless, the results of this study showed that, the above calculation equation (7) overestimated the outcome of GI and reported an inconsistency with the GI concept, so there is still a quest for a more accurate model. In disagreement with this conclusion, researchers(Reference Wolever and Bhaskaran79) have pointed out some limitations with the study of Dodd et al. (2011)(Reference Dodd, Williams and Brown78), such as the missing consideration of the effects of proteins and fat added to carbohydrates in the reduction of overall GI. They have also called attention to the lack of clarity in some terminologies.
Numerous human in vivo studies have been conducted in the development of low-GI foods. Some recent studies include the evaluation of low-GI proprietary food composite(Reference Lin Lee, Chan and Chun80) called LoGICarb™ blended with white rice; GI reduction was observed when this mixture was provided to healthy volunteers. LoGICarb™ is a combination of anthocyanins from black rice extracts, β-glucans from oatmeal extract, and dietary fibers called resistant dextrin. The reduction in GI was about 23.61% after the addition of LoGICarb™ to white rice. In this study, 15 healthy volunteers were selected with specific exclusion criteria, and the subjects fasted for more than 10 h.
Merits of the human in vivo sampling method include the consideration of effects of gastric emptying, osmolality, volume, acidity, sex and age factors. There is no exact replacement for this method because every physiological factor is considered(Reference Mandal, Chatterjee and Senjoti81).
Though human trials for GI estimation are considered the benchmark method, a major concern of using human trials is the inter-individual variability due to differences in each individual’s metabolism(Reference Peyser, Balo and Buckingham82). Also, from the aforementioned studies it can be seen that a large number of volunteers are needed for blood sampling. In this situation, screening of volunteers plays a vital role, which requires close monitoring of fasting conditions, and it is also important to pay attention to meals provided the day before to avoid more deviations in blood routine parameters. The trial results are only accurate if the screening is flawless and follows specific guidelines(Reference Haldar, Egli and De Castro83). Human ethical issues are another important impediment to such dynamic studies, such as pain caused by finger prick if glucometer is used or when drawing blood by syringe, cost of the testing apparatus and potential hazard due to possibility of negligence during the use of disposables(Reference Kownacka, Vegelyte and Joosse84,Reference Lu and Bao85) . It is difficult in human studies to unravel the complex dietary associations to identify the mechanisms of GI separately because of the constant nutrient requirements and the enormous expense of delivering regulated meals for a prolonged period(Reference Campbell, Belobrajdic and Bell-Anderson86). Thus, the need for animal-based predictive models may be an alternative to human clinical trials. Such models reduce the potential risk of testing for any newly developed food products and avoid human discomfort.
In vivo animal models
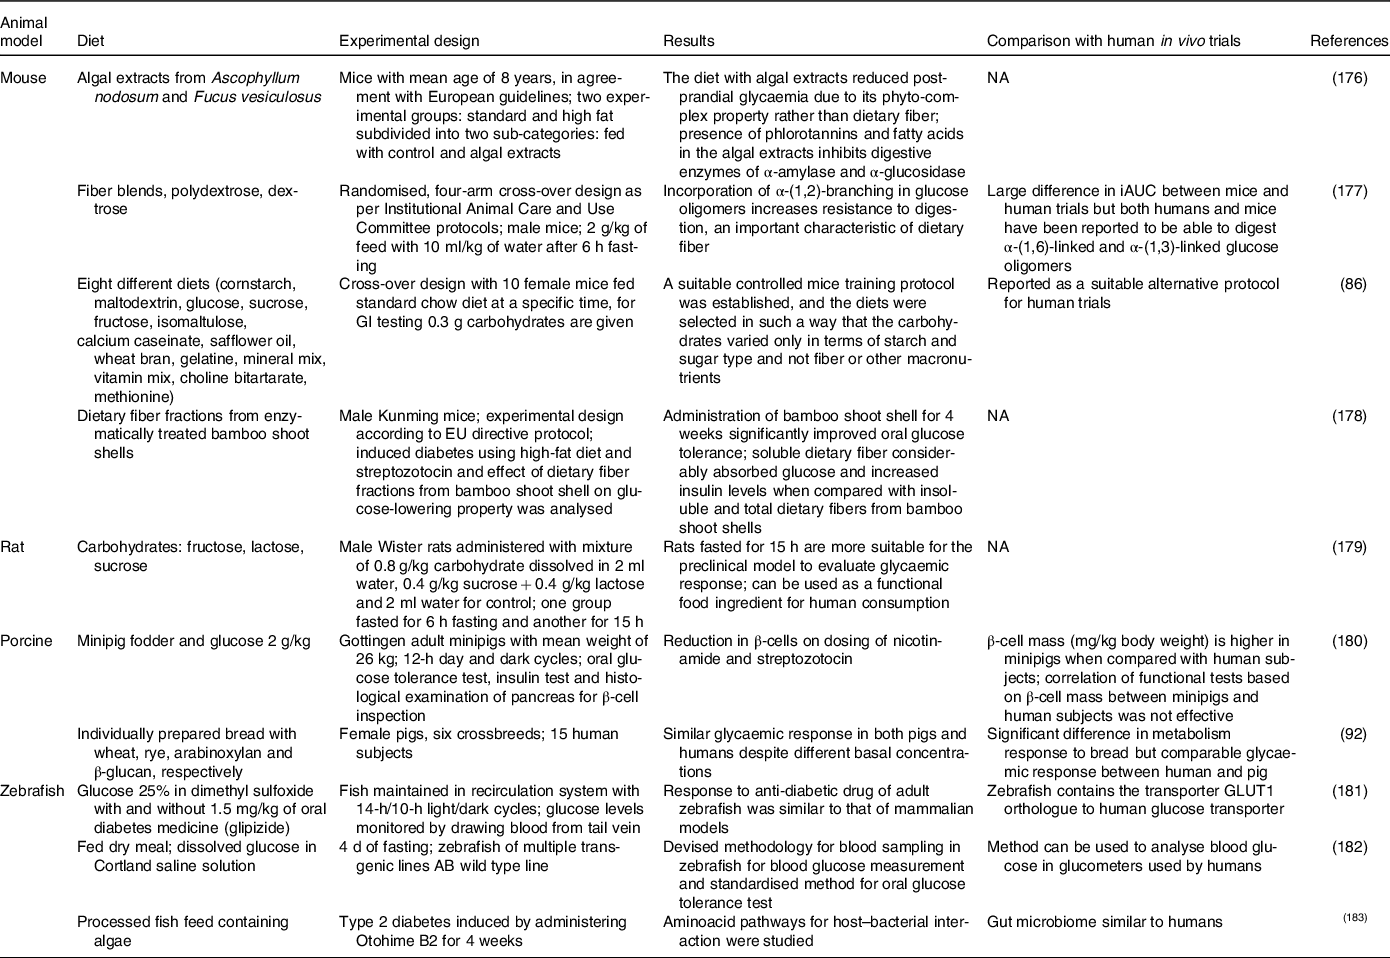
Animal models have long been used to demonstrate therapeutic effectiveness and to assess new-product toxicity before human clinical trials(Reference Van Norman87). Genome sequencing facilitates and helps researchers to better identify the key areas of biological similarity between animals and human subjects(Reference Coelho, Kultima and Costea88). The GI in animal in vivo models can be calculated using the same procedure as that of human in vivo blood sampling tests (incremental area under the curve)(Reference Falsafi, Maghsoudlou and Aalami89). Table 1 presents various in vivo animal models and the methods used for the study of glycaemic responses and their comparison with those of human trials. It was inferred that rats and mice are commonly used and have quite similar glycaemic responses to that of human subjects. Pigs also have comparable responses and, recently, zebrafish has emerged as a modern comparative species. The advantage of using rodents in GI determination is that mouse glucose homeostasis metabolism is similar to that of human subjects, i.e. insulin sensitivity and insulin release rate(Reference Small, Brandon and Turner90). Mice are used for diabetic studies because of the high degree of similarity between human and mouse DNA sequence. Moreover, mice have short gestational periods, making in-house breeding less expensive(Reference Pacini, Omar and Ahrén91). In another study, post-prandial responses of human and pig blood metabolomes were found to be identical. Here, the glycaemic response was similar after the consumption of four types of bread despite different basal concentrations between species (human and pig)(Reference Nielsen, Hartvigsen and Hedemann92). In the case of pigs, a variety of pig strains have a phenotype that reflects human type 2 diabetes(Reference King93). Porcine models have various advantages such as the possibility of ethical acceptance; large study groups due to favorable reproduction conditions; and blood volume similar to that of that of human subjects(Reference Renner, Blutke and Clauss94). At the same time, rabbits have similar lipid metabolism, rather than glycaemic profiles, to that of human subjects due to resemblance in lipoprotein profiles. Short-term diabetes in rabbits has limited applications as a model because it fails to consider the long-term complications of human diabetes(Reference Kawai, Ito and Ohwada95,Reference Wang, Wan and Mo96) . Few notable glycaemic studies have been performed with rabbit as a model animal for human subjects. The similarity of the glycaemic response of zebrafish and human subjects can be seen in Table 1. Zebrafish express a significant amount of near-human genetic integrity and organ systems. Also, maintenance is quite easy when compared with large animals. Their translucent body has an advantage of non-invasive visualisation and is genetically manageable; also, their functional human disease gene is 70% similar to that of humans(Reference Khan and Alhewairini97).
Table 1 In vivo animal models for determination of glucose response testing and its comparison with human in vivo clinical trials
Despite various advantages of using animal models, there are some ethical issues to be considered before using animal models. Nonetheless, well-designed studies can mitigate suffering and provide humane endpoints if the animal studies compromise between acquired expertise and less possible damage to the animals(Reference Liguori, Jeronimus and de Aquinas Liguori98). However, particularly in research associated with glycaemic response, mechanisms should be in place to determine complications associated with diabetes and to avoid or mitigate the negative effects of these complications. Suitable support must be provided to induce and sustain diabetes in animal models(Reference Radenković, Stojanović and Prostran99). The suffering, discomfort and death experienced by animals during laboratory experiments have long been a subject of discussion. In addition to the main ethical issues, there are few other drawbacks to animal experimentation, such as the need for professional personnel, time-consuming procedures, high training and housing costs involved(Reference Doke and Dhawale37). Moreover, technical issues such as the size of the animal, monogenic inheritance and the possibility of quick cytotoxic conditions during the study can become challenges. For example, rats have very small body parts, and total resection of pancreas would be very difficult for the operator to perform, in turn, resulting in large inter-animal variations during diabetic studies. Post-operation anagesis, supplementation to mitigate pancreatic malabsorption, and animal infections should also be carefully considered by technical experts(Reference Al-Awar, Kupai and Veszelka100). Besides, a non-invasive alternative to killing animals for the benefit of humans must be found, in particular for well-established glycaemic studies. Thus, the use of cultures of in vitro cells and tissues that require cell growth outside the body in the laboratory setting may be a less invasive alternative to in vivo animal experiments. Tissues and cells separated from an animal can be stored outside the body for a few days to several months or even for a few years, in adequate growth medium(Reference Doke and Dhawale37,Reference Dusinska, Rundén-Pran and Schnekenburger101) .
Ex vivo models
Ex vivo models are developed outside an organism but include active biological tissues with in vivo complex cellular surroundings. In these models, the structural integrity of the target tissues is preserved using an appropriate environment(Reference Pearce, Coia and Karl102). These ex vivo models can be isolated tissues or cultured tissues/cells in a growth medium.
Isolated tissues
The everted gut sac technique is a very common technique used for nutrient transport studies, especially in drug absorption research, dating back to the 1900s. Glucose absorbed into the bloodstream is directly proportional to GI. Therefore, permeability is an important factor to be considered in models. The intestinal effective permeability for passive transcellular diffusion is supposed to represent the diffusion of ions through the complex apical intestinal barrier(Reference Parthasarathi, Bhushani and Anandharamakrishnan103). Permeability of ions/nutrients is related to the rate of transportation through intestinal mucosa, a rate-limiting barrier, and can be studied irrespective of the mechanism of transportation. The permeable ions can also be utilised by the passive component during glucose absorption by the intestinal epithelium(Reference Mills, France and Ellis104). The permeability of drugs through the intestinal segment can be investigated. Apparent permeability is given by equation (8)(Reference Dixit, Jain and Dumbwani105):
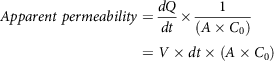 $$Apparent\ permeability = {{dQ} \over {dt}} \times {1 \over {\left( {A \times {C_0}} \right)}} = V \times dt \times \left( {A \times {C_0}} \right)$$
Where
 ${{dQ} \over {dt}}$
is the amount of drug accumulation at the serosal region of intestinal tissue; C
0 is the initial concentration of drug (µg/ml); is the intestinal surface area (cm2); V is the sample volume (ml). The aforementioned equation is Fick’s law of diffusion. This apparent permeability is an important parameter illustrating the quantity of glucose that crosses the intestinal barrier and is available for absorption into the bloodstream after digestion.
${{dQ} \over {dt}}$
is the amount of drug accumulation at the serosal region of intestinal tissue; C
0 is the initial concentration of drug (µg/ml); is the intestinal surface area (cm2); V is the sample volume (ml). The aforementioned equation is Fick’s law of diffusion. This apparent permeability is an important parameter illustrating the quantity of glucose that crosses the intestinal barrier and is available for absorption into the bloodstream after digestion.
Glucose absorbed by the everted intestinal segment was calculated(Reference Chukwuma and Islam106) using equation (9):
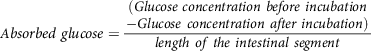 $${\scale 95%Absorbed\ glucose} = \scale 95%{{\matrix{ {(Glucose \ concentration \ before \ incubation} \cr {-Glucose \ concentration \ after \ incubation)} \cr } } \over {length\ of\ the\ intestinal\ segment}}$$
whereas, muscle glucose uptake per g of muscle tissue is calculated(Reference Chukwuma and Islam106) using equation (10):
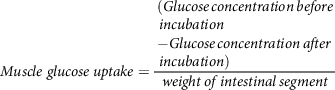 $$Muscle\;glucose\;uptake = {\matrix{ (Glucose\,concentration\,before \hfill \cr \,incubation \hfill \cr - Glucose\,concentration\,after \hfill \cr \,incubation) \hfill \cr} \over {weight\,of\,intestinal\,segment}}$$
Glucose absorption index is another parameter that gives the amount of glucose that is absorbable by a given intestinal segment. Here, phenol red (0.05%) was used as a recovery marker(Reference Chukwuma and Islam107).
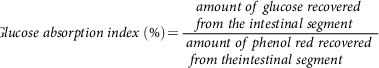 $$Glucose\;absorption\;index\;\left( \% \right) = {{amount\;of\;glucose\;recovered\;from\;the\;intestinal\;segment} \over {{\rm{ }}amount\;of\;phenol\;red\;recovered\;from\;theintestinal\;segment}}$$
Dixit et al. fitted an isolated intestinal segment of rat to a J-shaped tapering glass apparatus. The glass apparatus consisted of two cylinders with varying diameters, and the lower ends were made suitable for attaching the everted intestinal segment to it(Reference Dixit, Jain and Dumbwani105). The results of this study showed good absorption kinetics and are reported to be validated. The author suggests that this technique can be used for all types of studies related to the transport of nutrients across the interstitial epithelium. A similar work studied the absorption of glucose fractions through an isolated jejunal part of rat intestine after digestion of mannitol (a low-calorie sugar). The study also investigated the effects of mannitol on intestinal enzymes such as α-glucosidase and α-amylase activities during digestion of sugar. For this, the gastrointestinal tract of healthy and normal rats were carefully isolated after anesthesia. The isolated jejunum was everted and incubated in buffer solution. Suitable conditions of gas composition were given to maintain the integrity of the tissue. The buffer solution was infused with mannitol at different concentrations along with glucose. The results indicated that the addition of mannitol significantly reduced the absorption of glucose, indicating that mannitol can be used as a dietary supplement for reducing post-prandial glycaemia(Reference Chukwuma, Matsabisa and Erukainure108). The Ussing chamber is another powerful apparatus to measure ion transport which also uses ex vivo intestinal tissue for determining intestinal permeability. This apparatus dates back to 1951, though upgrades have been made since then(Reference Arnold, Thorens and Bernard109). The ex vivo animal intestinal segment is mounted by a slit in the small intestine at the conjunction between the duodenum and jejunum where the segment is removed about 30 cm in length. Then, each portion removed along the mesenteric border with a length of 3 cm, containing no patches of Peyer, is immediately placed in an Ussing chamber. Krebs solutions and test solutions are used for ion transport, and temperature is maintained at 37°C. The outcome of the analyte is collected and tested separately. This ex vivo process helps to study absorption mechanisms relating to humans. On the downside, this method is not suitable for higher animal tissues (e.g. pig, rabbit, dog, monkey) whose intestinal tissues are too dense for diffusion chambers; moreover, trickles were observed(Reference Luo, Liu and Zhao110). The setup of the Ussing chamber is shown in Fig. 3, where the electrodes are placed to measure the resistance created by buffer(Reference Thomson, Smart and Somerville111). InTESTine™ was developed by TIM to investigate drug delivery. This uses ex vivo porcine intestinal tissue which is punched and mounted in a chamber(Reference Pearce, Coia and Karl102,Reference Ripken and Hendriks112) .
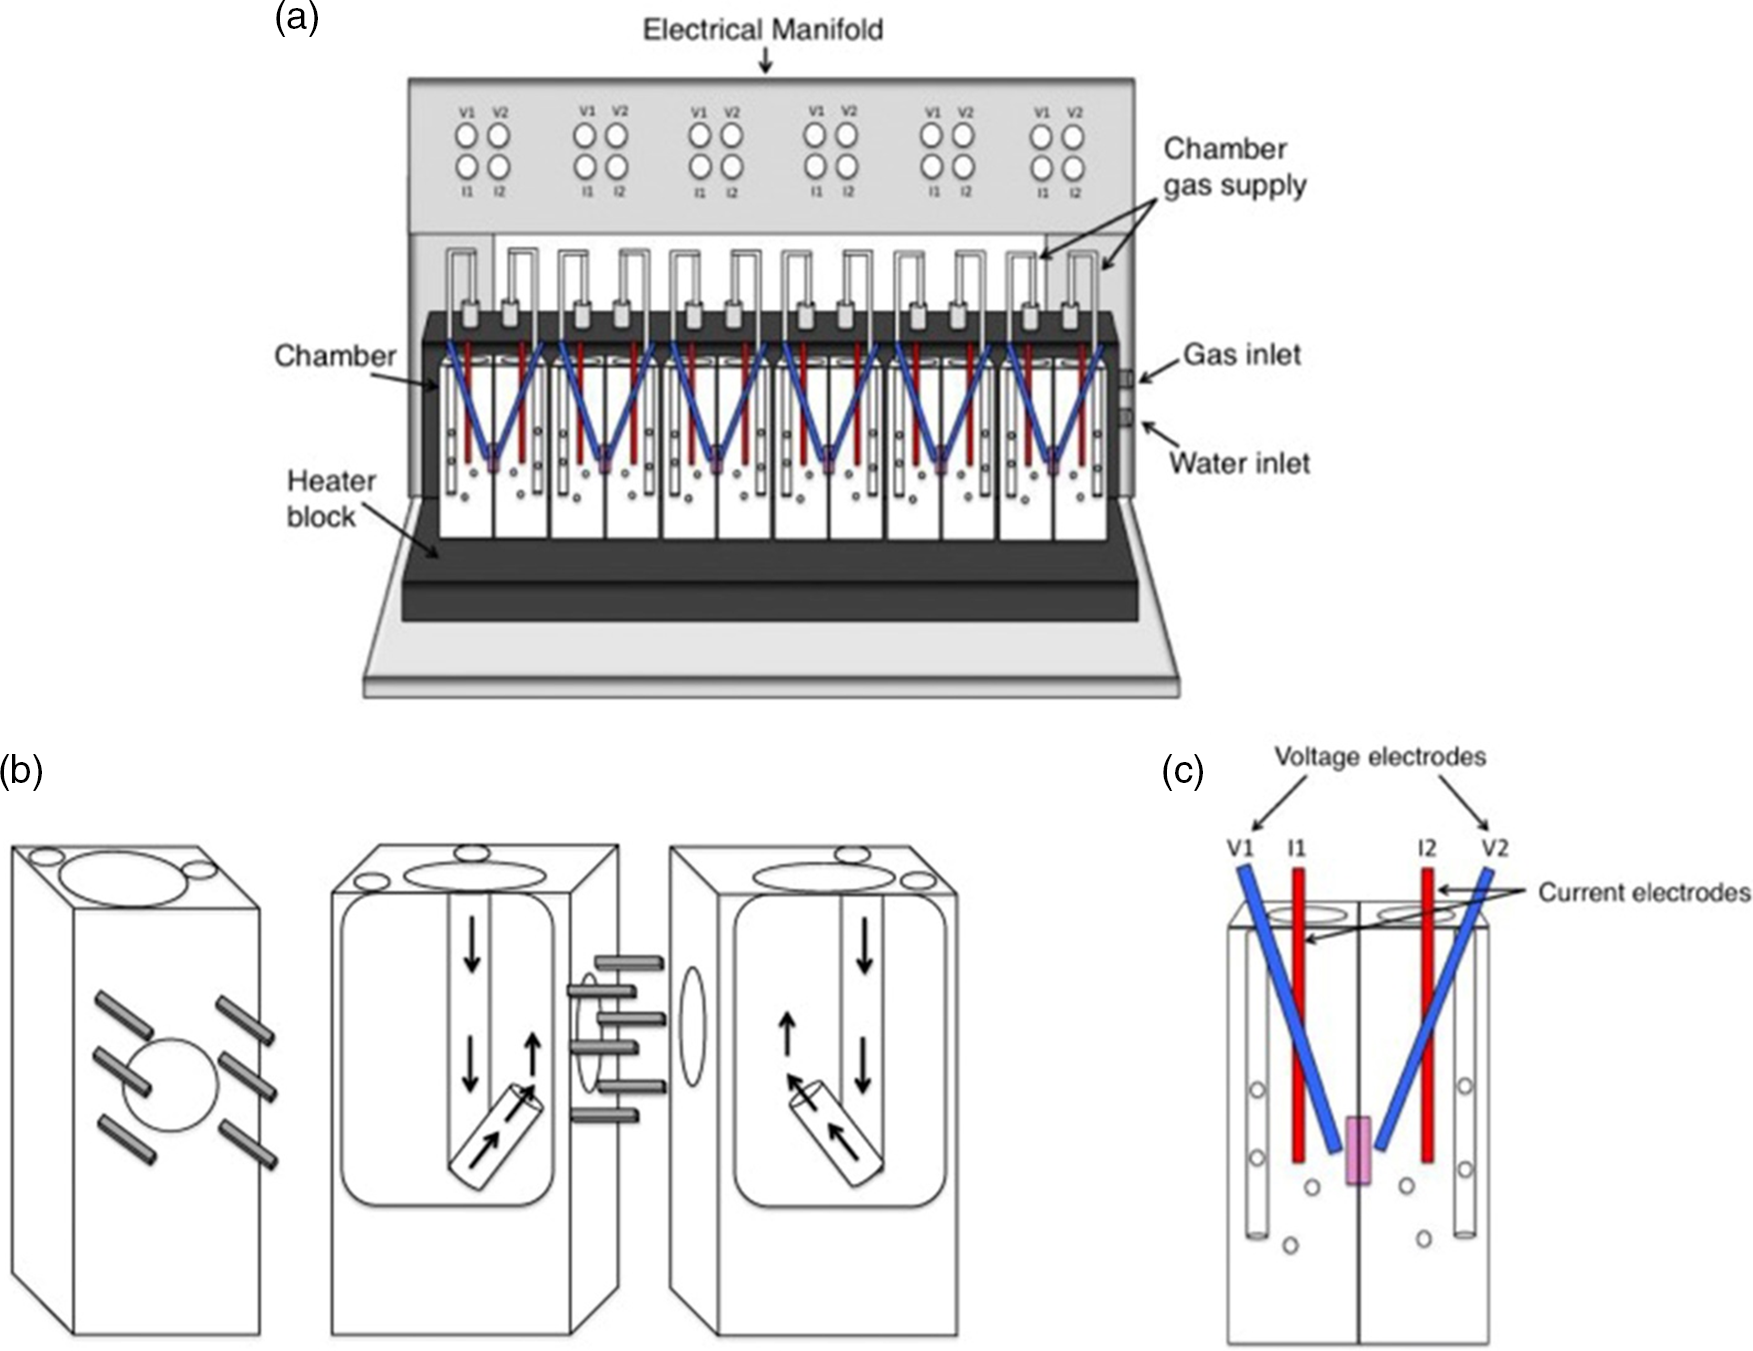
Fig. 3. Ussing chamber(Reference Thomson, Smart and Somerville111); (a) schematic diagram of Ussing apparatus; (b) halves of chamber displaying the pins keeping tissue in place. Arrows show path of gas flow to agitate buffer; (c) Ussing chamber with electrodes
The cut portions of tissues can be considered as the intestinal barrier because these isolated tissues are mostly derived from the intestinal portions of animals that can mimic the gut mucosa. Both the everted gut sac apparatus and Ussing chamber can be successfully used to determine the absorption kinetics of glucose after carbohydrate digestion by following any one of the well-established protocols provided by Englyst et al. (1996), Jenkins et al. (1982) and Wolever et al. (1991)(Reference Englyst, Veenstra and Hudson113-Reference Jenkins, Wolever and Taylor115) especially for GI, provided every factor affecting glucose metabolism is taken into consideration. The isolated intestinal segments possess multiple cell types, and even the hormones, microbial load, and cell-to-cell communications can be kept intact if maintained carefully in a buffer solution with gas supply(Reference Ripken and Hendriks112).
The challenge lies in carefully isolating the tissues without damage and maintaining the integrity of the tissues. Biological variation is another important challenge to be addressed in selecting the animals from which the tissues are separated. Multiple replications have to be carried out to attain a reliable result. Apart from these factors, even small changes in harvesting time, age, sex, diet, stress level and method of killing influence the outcome of the study(Reference Alam, Al-jenoobi and Al-mohizea116). Further, technical limitations such as those in the identification of individual rate-limiting factors, constant monitoring of luminal hydrostatic pressure, and screening of tissues without cancerous origin are concerns in the use of isolated tissues for drug/glucose transport or absorption studies(Reference Maddula and Juluru117).
Cultured tissues
Another set of ex vivo studies used cultured tissue/cells to measure glucose transport. Advanced tissue-engineering systems have evolved, such as self-assembling 3D aggregates called organoids, in contrast to 2D cultures which present as monolayers. Recently, microfluidic lab-on-chip models have been progressing with the ability to successfully mimic intestinal epithelial tissues(Reference Ravnic, Leberfinger and Ozbolat118). To study nutrient/ion transport in the intestine, a 3D villi structure on Caco-2 cells combined with fluidic technology has been developed(Reference Yi, Shim and Ha119). This 3D villi scaffold was used to assess nutrient absorption at the molecular level using the permeability model indicating passive absorption. A gut microchip was mounted on three layers of polymers, and using the photolithography technique a wafer mold was made with the inverse configuration of the villi. Molecular flux, representing the rate of nutrient/ion transport through the scaffold, was determined using equation (8) as given above. The results showed that the presence of fluidic stimuli in the chip and 3D culture reduced efflux transport and may theoretically act as a platform with enhanced physiological relevance to the human gut(Reference Shim, Lee and Han120).
Similarly, intestinal epithelial cells cultured and integrated on microchips had villi-like protrusions, multi-lineage differentiation and brush boundary enzyme activity. In addition, mucin secretion has also been demonstrated under cyclic motion and flow conditions similar to intestine constructed by using cell lines(Reference Kasendra, Tovaglieri and Sontheimer-Phelps121). There are also many gut scaffolds mimicking the entire intestinal dynamic environment including the microbiome. Yet, cell lines have to be constantly screened for cross-contamination to avoid misleading results.
Time commitment presents the greatest challenge of this model, as precision and repeatability are required(Reference Lee and Sung122). In vitro approaches are therefore used to address these obstacles, in particular for ethical dominance, reduced time usage and readily analysable outcomes.
In vitro models
In vitro digestion assays are models that mimic in vivo digestion physiological conditions and are valuable methods to test and interpret modifications, associations and bio-availability of nutrients and medications. In the beginning, in vitro methods were used to determine availability of carbohydrates(Reference Southgate123) and non-starch polysaccharides(Reference Englyst, Wiggins and Cummings124). The in vitro method for GI determination started with Jenkins et al. (1984)(Reference Jenkins, Wolever and Thorne125), where a dialysis bag was used in a restricted method. Here, the digesta along with digestive enzymes were placed inside the bag, and the glucose from the digested carbohydrates was allowed to diffuse to the buffer environment over time. Because of a prolonged incubation period and an excess of amylolytic enzymes in the previous methods, Berry (1986)(Reference Berry126) made a few modifications to the previous method to more closely mimic digestion physiology. The study aimed to show how resistant starch survives during digestion, but the yields of resistant starch remained higher. Granfeldt & Björck, (1991)(Reference Granfeldt and Björck127) included pepsin along with amylase enzyme in a dialysis bag. The concept of carbohydrate foods as “eaten” was introduced here. Englyst et al. (1992)(Reference Englyst, Kingman and Cummings128) introduced a method that is widely used to this day. This method overcame the previous lacuna by including separate stomach and intestinal phases. This method also clearly classified the fractions of starches as rapidly digestible starch, slowly digestible starch and resistant starch. This is an unrestricted method that does not use any dialysis constraints. Later, Muir and O’Dea (1993)(Reference Muir and O’Dea129) employed α-amylase and amyloglucosidase in shaking water bath whereas Brighenti et al. (1995)(Reference Brighenti, Pellegrini and Casiraghi130) devised an in vitro method to investigate resistant starch digestion which used pancreatin and glass balls to mimic the digestion process. This method had a limitation in determining the effects of digestion of molecules other than glucose. Though Brighenti et al. developed the practical method, the well-defined calculation based on starch hydrolysis was clearly defined by Goñi, Garcia-Alonso and Saura-Calixto (1997)(Reference Goñi, Garcia-Alonso and Saura-Calixto131), which is used to this day. It was concluded that GI is also determined by the rate of digestion and absorption of glucose in the small intestine(Reference Englyst, Englyst and Hudson132). Another method was devised(Reference Guraya, James and Champagne133) to determine the starch fractions, but this method used maltose as standard and is not able to predict the digestibility of glucose-containing polymers such as pullulan, and it uses only α-amylase. There were also other protocols for GI, which used rapid glucometry for analysis and also determined the rheological properties of carbohydrate foods(Reference Woolnough, Monro and Brennan134,Reference Dartois, Singh and Kaur135) . The absorption due to the influence of viscosity on the release of bile acid also needed to be considered. A modified method based on a dialysis diffusion-based approach estimating the influence of bile acid release on high-fiber barley was devised by Naumann et al. (2018)(Reference Naumann, Schweiggert-Weisz and Bader-Mittermaier136). To this day, both restricted (dialysis bag) and unrestricted methods (without dialysis bag) are used. A protocol was devised based on the restricted in vitro method to determine GI, and this GI was correlated with the mass transfer of glucose from the dialysis membrane. The study showed that variations in the mass transfer of glucose were directly proportional to the GI with different food composition(Reference Santhi Rajkumar, Suriyamoorthy and Moses137).The use of dialysis bag to designate the intestinal membrane as a boundary for diffusion has the advantage over the unrestricted method because starch hydrolysis is a rate-limiting process and changes in viscosity of incubated dialysate can be predicted by this membrane(Reference Granfeldt and Björck127,Reference Naumann, Schweiggert-Weisz and Bader-Mittermaier136) .
As time progressed, researchers viewed in vitro models as static and dynamic; the static in vitro model depicts the cycle of digestion (oral, gastric and intestinal) represented in separate compartments, while the dynamic in vitro model characterises the automatic, interconnected multi-compartments for ingested food similar to the human digestive system.
To closely replicate digestion dynamics, each stage of food digestion has to be carefully considered. In digestion, food, as described in the introduction, gets transported from the oral phase, enters the gastric phase, and finally reaches the intestinal phase, where the absorption takes place(Reference Sams, Paume and Giallo138). The oral phase involves various motor responses of break-down of food particles into smaller size. The size distribution of particles after the oral mastication process is given by equation (12):
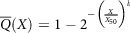 $$\overline Q\left( X \right) = 1 - {\rm{}}{2^{ - {{\left( {{X \over {{X_{50}}}}} \right)}^b}}}$$
where,
 $\overline Q$
is the particle fraction, X is the particle size, X
50 is the median particle size and b represents the extent of the distribution(Reference Bornhorst and Singh139).
$\overline Q$
is the particle fraction, X is the particle size, X
50 is the median particle size and b represents the extent of the distribution(Reference Bornhorst and Singh139).
It has been reported that the effect of oral processing influences GI. Also, the speed and eating method has a major impact on GI according to researchers(Reference Sun, Ranawana and Tan140), which is due to variations in chew cycles and bite size. The bolus formed in the mouth enters the stomach, and digestion in the gastric phase is quantified in terms of gastric emptying. Gastric emptying can be calculated by equation (13):
 $$y\left( t \right) = {2^{-{{\left( {{{\rm{t}} \over {{{\rm{T}} \over 2}}}} \right)}^{\rm{\beta }}}}}$$
where, y(t) is the chyme remaining in the stomach at time t; β is the shape factor; T/2 is the half time of gastric emptying (54).
Gastric emptying is an important determinant for the glycaemic response; the slower the emptying rate, the lower is the GI for starchy meals(Reference Pletsch and Hamaker55). Though all these factors affect GI, it is the intestine which absorbs the glucose into the blood. GI, as discussed in the previous sections, can be calculated using the incremental area under the curve. However, for GI calculation using the in vitro method, the formula based on starch hydrolysis is widely used(Reference Goñi, Garcia-Alonso and Saura-Calixto131). The kinetics of starch digestion follow a first-order non-linear trend. Based on the percentage of starch hydrolysed, the GI is calculated by using equations (14) and (15):
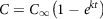 $$C = {C_\infty }\left( {1 - {e^{kt}}} \right)$$
 $$GI = 39{\cdot}71 + 0{\cdot}549HI$$
where C is the concentration of hydrolysed starch at any time,
 ${C_\infty }$
represents the concentration attained at equilibrium and k is the rate constant; HI is the hydrolysis index. All these parameters can be replicated and simulated by reproducing the digestion conditions. In a study, the in vitro starch hydrolysis of bread at the termination of oral, gastric and intestinal phase was found to be 9·5%, 49% and 68% respectively(141). Some of the most recent in vitro models are presented in Table 2 and the illustrations are provided in Fig. 4.
${C_\infty }$
represents the concentration attained at equilibrium and k is the rate constant; HI is the hydrolysis index. All these parameters can be replicated and simulated by reproducing the digestion conditions. In a study, the in vitro starch hydrolysis of bread at the termination of oral, gastric and intestinal phase was found to be 9·5%, 49% and 68% respectively(141). Some of the most recent in vitro models are presented in Table 2 and the illustrations are provided in Fig. 4.
Table 2. Dynamic in vitro digestion models
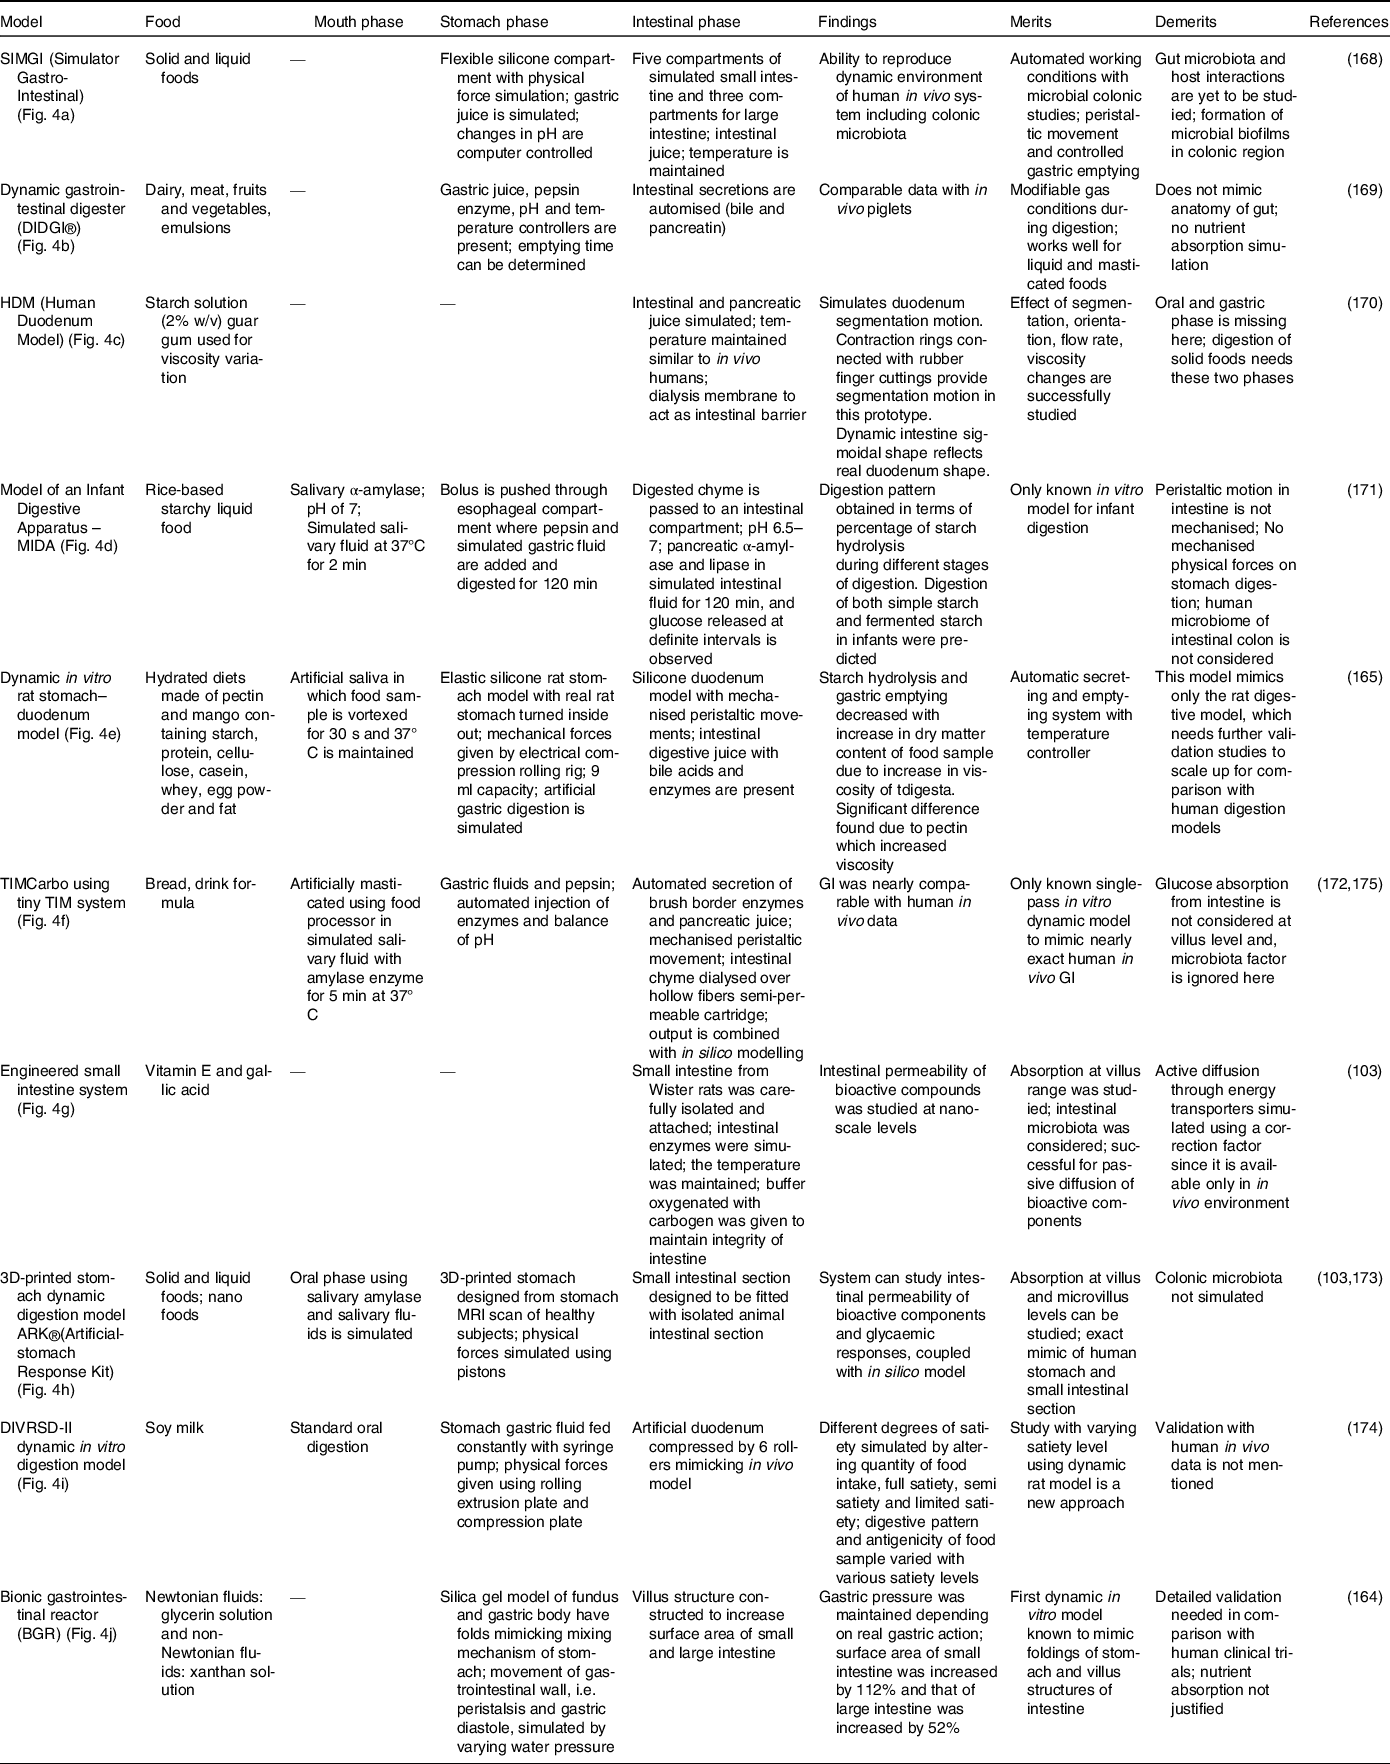
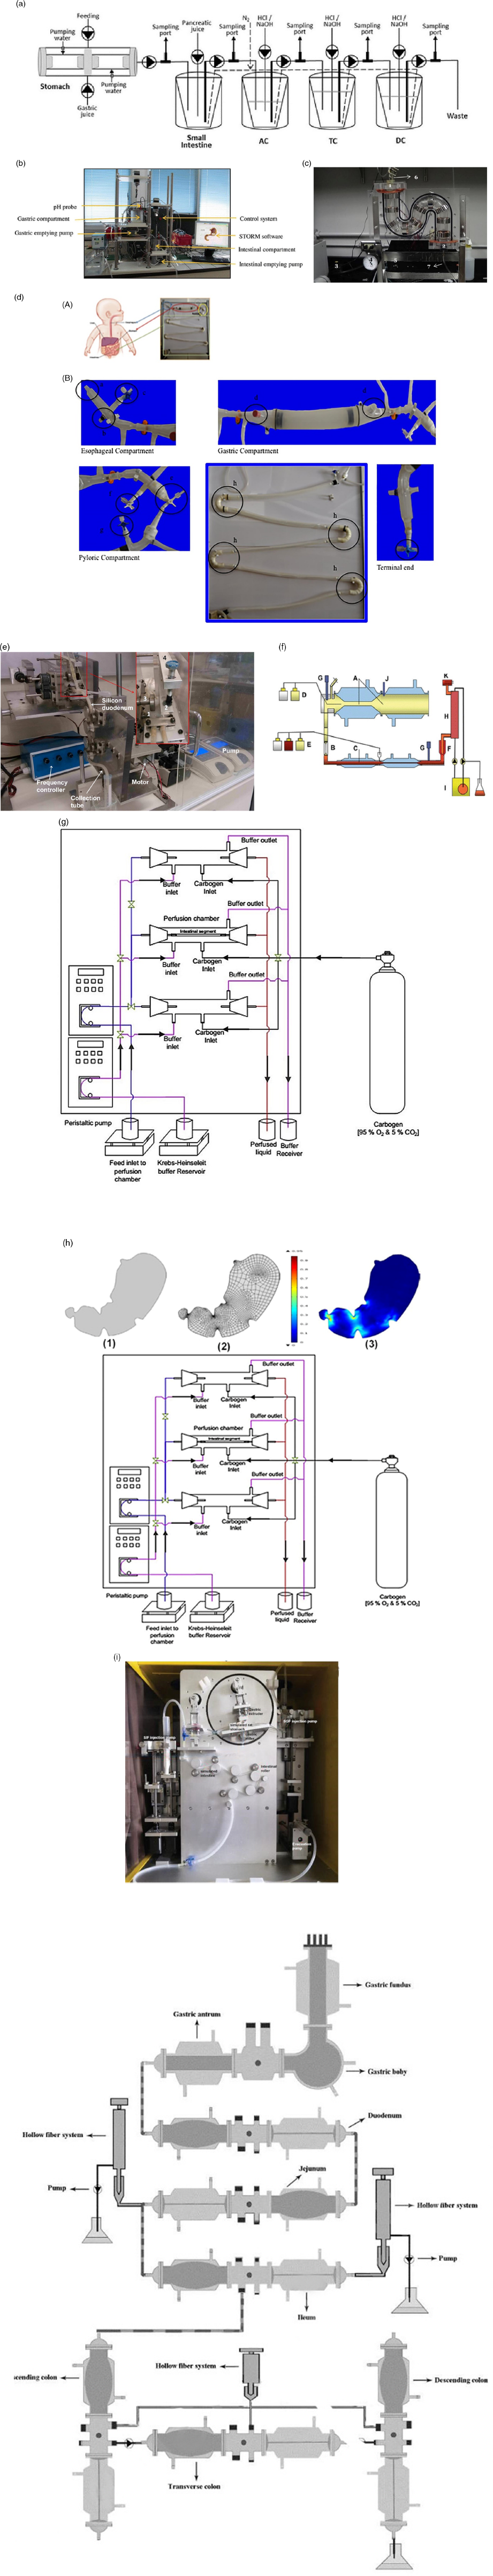
Fig. 4. Various in vitro dynamic digestion models; (a) SIMGI (Simulator Gastro-Intestinal)(Reference Barroso, Cueva and Peláez168); (b) dynamic gastrointestinal digester (DIDGI®)(Reference Ménard, Picque and Dupont169): (1) gastric emptying pump, (2) gastric compartment, (3) pH probe, (4) intestinal emptying pump, (5) intestinal compartment and (6) control system. (c) HDM (Human Duodenum Model), adapted with permission(Reference Wright, Kong and Williams170): (1) inlet ports for digesta, enzymes and sampling, (2) outlet tube (3), source for vacuum, (4) pressure gauge, (5) regulator, (6) inlet, (7) emptying port; (d) model of an infant digestive apparatus (MIDA)(Reference Passannanti, Nigro and Gallo171): (A) view of complete system, (B) oesophagal, gastric, pylorus and intestinal compartments: (a) bolus inlet, (b) port for water bath at 37°C, (c) inlet for simulated gastric fluid, (d) connection to pH meter, (e) pylorus stimulus, (f) sampling port for gastric content, (g) inlet port for simulated intestinal fluid, (h) connecting loops, (i) chyme sampling; (e) dynamic in vitro rat stomach–duodenum model, adapted with permission(Reference Wu, Bhattarai and Dhital165): (1) silicon stomach, (2) plate, (3) eccentric wheel, (4) shaft; (f) TIMCarbo using tiny TIM system(Reference Minekus172): (A) gastric chamber, (B) pyloric sphincter (C), duodenal chamber, (D) gastric juices, (E) duodenal secretion, (F) filter, (G) pH electrodes, (H) dialysis membrane, (I) dialysis system (J), pressure sensor, (K) level sensor; (g) engineered small intestine system, adapted with permission(Reference Parthasarathi, Bhushani and Anandharamakrishnan103); (h) 3D-printed stomach dynamic digestion model ARK®(Artificial-stomach Response Kit)(Reference Gopirajah and Anandharamakrishnan173): (1) stomach geometry, (2) meshed geometry, (3) simulated fluid flow; (i) DIVRSD-II dynamic in vitro digestion model(Reference Qing, Zhang and Li174); (j) bionic gastrointestinal reactor (BGR), adapted with permission(Reference Li, Zhu and Zhang164)
In vitro models are successful alternatives to other models as they save time because in vivo animal, in vivo human clinical trials and cell and tissue models require lots of training time. To date, numerous in vitro models are being developed that aim to replicate the physiological conditions of humans, but accuracy remains a challenge. In the case of GI, there are a wide variety of existing models (Table 2). GI is a delicate parameter unlike other parameters of absorption and digestion because the response to glucose is subjected to hormonal effects that need to be considered carefully(Reference Navale and Paranjape64). As we can see in Table 2, if all demerits in each models are resolved by considering all the parameters affecting glucose homeostasis, GI replication can be strongly correlated. Validation with more food products and human clinical trials will be a vital step and must be performed carefully in coherence with ethical clearance(Reference Wolever, Meynier and Jenkins11). When thoroughly standardised, the prototype can then be used everywhere consistently. GI prediction is not possible without the aid of in silico combination because, as stated in the introduction, the individual glucose response requires the involvement of hormones and transporters. Moreover, the movement of the intestine across the digestive cycle and the mass distribution throughout the intestine must be properly reflected in addition to in vitro digestion, which is only possible with the inclusion of in silico approaches.
In silico models
Computer-generated models are used to predict various potential nutrient biological effects without animal dissection. Wessel et al. (1998)(Reference Wessel, Jurs and Tolan142) developed the model and validated it with the ex vivo intestinal method. Boundary conditions were fixed with the partition coefficient. The partition coefficient determines the affinity of a bioactive molecule in the lipid phase and aqueous phase. The overall mass balance around the intestine can be elucidated with the following equations:
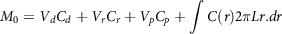 $${M_0} = {V_d}{C_d} + {V_r}{C_r} + {V_p}{C_p} + \mathop \int \nolimits C\left( r \right)2\pi Lr.dr$$
where V and C are volume and concentration respectively, suffixes d, r and p are donor, receptor and particle, respectively, and L is the intestinal length. The equation was validated with the experimental ex vivo intestinal method; predicted values agreed with the experimental results.
The degree to which a bioactive molecule can move freely in the intestinal lumen is described by the diffusion coefficient (D). Ogston, Preston and Wells (1973)(Reference Ogston, Preston and Wells143) discussed two approaches to determine the diffusion coefficient, and both being notable contributions of Einstein: (i) phenomenological approach (hydrodynamic drag on the molecule), and (ii) stochastic/random walk approach. In the phenomenological approach, the diffusion coefficient can be calculated from the hydrodynamic drag force of a species:
 $${D_0} = {{{K_B}T} \over {6\pi \mu }}$$
where the hydrodynamic radius of the diffusing molecule is r and µ is the medium viscosity, T is the absolute temperature and K B is the Boltzmann constant. In the random walk approach, average molecular displacement (χ) due to the Brownian motion is accounted for, and the diffusion coefficient can be calculated by the following equation:
 $${D_0} = {\rm{}}{{{\chi ^2}} \over {2t}}$$
where D is the coefficient of diffusion, χ is the average molecular displacement and t is the time.
The mass balance approach(Reference Sinko, Leesman and Amidon144) was developed at a macroscopic level for estimating the absorption by assuming the small intestine to be a cylindrical tube and the stomach with constant output rates an infinite storage tank. Mass balance around the intestine can be elucidated as
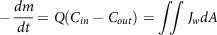 $$ - {{dm} \over {dt}} = Q\left( {{C_{in}} - {C_{out}}} \right) = \mathop \int\!\!\!\int \nolimits {J_w}dA$$
where M is the compound mass, Q is the flow rate, C out is the concentration at the outlet, C in is the concentration at the inlet, A is the absorptive surface area and J w is the flux at the intestine wall. The dose fraction transferred in the intestine at steady-state condition can be elucidated as
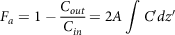 $${F_a} = 1 - {{{C_{out}}} \over {{C_{in}}}} = 2A\mathop \int \nolimits C{\rm{'}}dz{\rm{'}}$$
where dz′ and C′ are the variables of position and concentration, C′ = C/C 0 , z′ = z/L. The authors considered three cases (based on solubility in the intestinal lumen) to integrate the above equation. The dissolution factor of the bioactive compound in the intestinal lumen is not accounted for in this approach, which is the main drawback of this model. However, this macroscopic mass balance approach is suitable for compounds in solution form or with high solubility.
The main disadvantage of the aforementioned approach was that it failed to describe the dissolution/absorption processes in the intestine. To overcome this problem, Oh and Marshall (1993)(Reference Oh and Marshall145) developed a microscopic model for intestinal absorption, considering the dissolution of the bioactive compound in the small intestine and permeation from the small intestine to the bloodstream. Considering the small intestine as a cylindrical tube, the rate of change of particle radius can be elucidated by the microscopic approach as
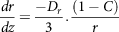 $${{dr} \over {dz}} = {{ - {D_r}} \over 3}.{\rm{}}{{\left( {1 - C} \right)} \over r}$$
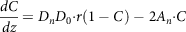 $${{dC} \over {dz}} = {D_n}{D_0}{\cdot}r\left( {1 - C} \right) - 2{A_n}{\cdot}C$$
where D n is the number denoting the dissolution, D 0 is the dose number, A n is the absorption number, C is the dimensionless concentration (C = C L /C S ), C L is the concentration of the compound at the lumen, C S is the compound solubility, r is the dimensionless radius of the particle (r = r p /r 0 ), r 0 is the initial particle radius, r p is the radius of the particle at distance z, and z is the axial intestinal coordinate. Further, four dimensionless parameters like A n (absorption number), D n (dissolution number), and D o (dose number) were developed to estimate the transported fraction in the intestine. Absorption number (A n ) gives the effective permeability of a compound to the flow rate in the intestine volumetrically (equation 23). Maximum absorption of 87% was observed for a compound with An = 1, and complete absorption could be achieved for the absorption number (A n ) larger than 1.
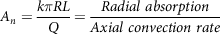 $${A_n} = {{k\pi RL} \over Q} = {{Radial\ absorption} \over {Axial\ convection\ rate}}$$
Dose number (D 0 ) can be elucidated as
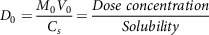 $${D_0} = {{{M_0}{V_0}} \over {{C_s}}} = {{Dose\ concentration} \over {Solubility}}$$
and the dissolution number (D n ) is given by the following equation (25):
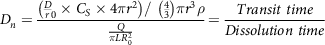 $${D_n} = {{\left( {{{{D \over r}}_0} \times {C_S} \times 4\pi {r^2}} \right)/\ \left( {{4 \over 3}} \right)\pi {r^3}\rho } \over {{Q \over {\pi LR_0^2}}}} = {{Transit\ time} \over {Dissolution\ time}}$$
Partitional diffusion and transit model was developed to determine the fraction of the absorbed dose and the rate of molecular absorption for molecules transported passively(Reference Yu, Crison and Amidon146). Small intestinal segments were divided into a series of compartments, and the rate of mass transfer of drugs from one compartment to the next compartment is directly proportional to the bioactives present in the initial compartment. The number of compartments is determined by comparing the modeled data with experimental results.
The area of interest here is engineering the absorption of glucose from the gut after digestion. The complex, highly orchestrated movement of the intestinal region, known as motility, regulated by electrophysiological, neurological, hormonal and other factors, is essential for nutrient absorption and excretion of undigested food(Reference Du, Paskaranandavadivel and Angeli147). Polyflow model was used to design specific intestinal contractions to examine computationally how these non-propagating contractions and their combined operation influence the patterns of intestinal flow and their ability to facilitate mixing. Results show that contractions along the length facilitate mixing and transfer of species in the periphery of the wall, while combined operation with a segmental compression increases these fluid flowing properties in the intestinal region(Reference Fullard, Lammers and Ferrua148). Fig. 5 shows how intestinal contractions occur with different fluids of varying viscosity (water and honey). Research employed rigid particles suspended in a Newtonian fluid to imitate the viscous digesta to model the peristalsis in the duodenum shown in Fig. 6. The duodenum is perceived as a thin visco-elastic tube-like structure combined with numerical methods based on particles. The smooth hydrodynamics of particles and the discrete methods of components are coupled with solid and fluid motion. Because of the development of high pressures and radial velocity which is critical for advective nutrient absorption, the complete liquid content is found to dilate the walls of the gut(Reference Sinnott, Cleary and Harrison60). The first model that was devised by Moxon, Gouseti and Bakalis (2016)(Reference Moxon, Gouseti and Bakalis149) emphasises the transport of glucose taking place in the small intestine using the concept of the mass transfer process, given as the 1D advection reaction equation. The overall idea of this process is given in equation (26):
 $$Change\ in\ glucose\ mass\ with\ time = movement\ along\ small\ instestine\ due\ to\ advective - Absorption\ of\ glucose$$
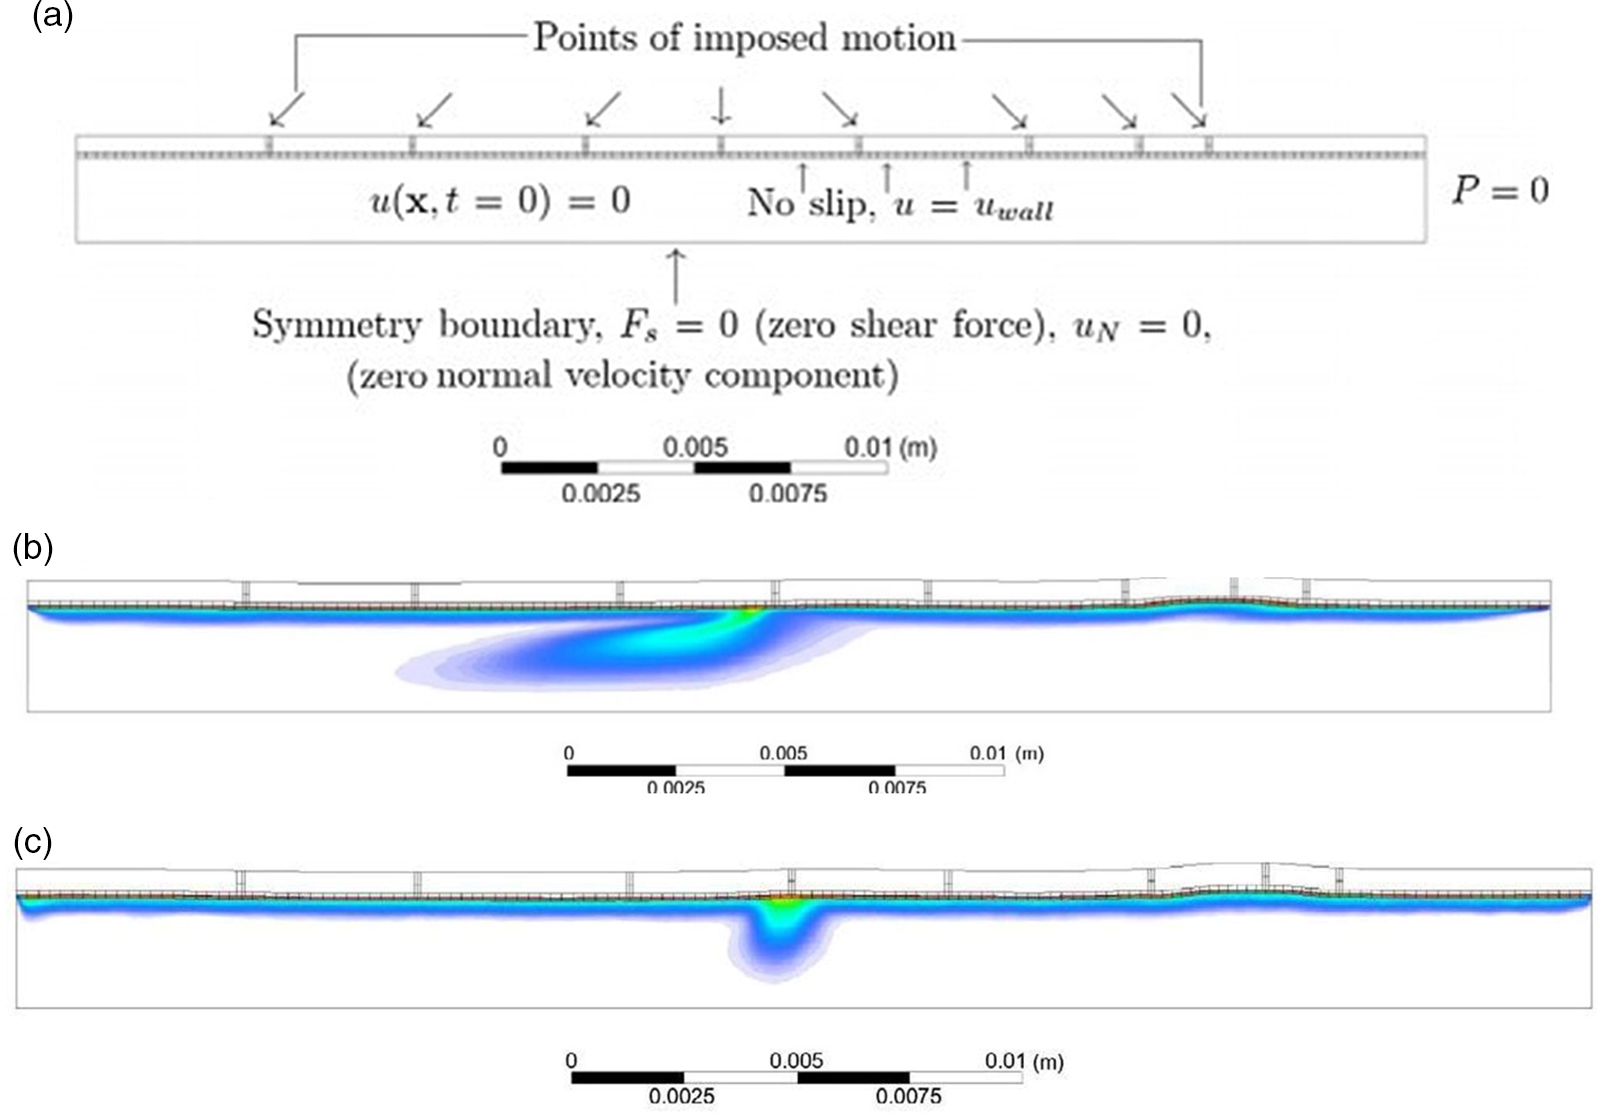
Fig. 5. (a) Boundary conditions imposed in an ileum part of model rabbit intestine; (b) contour plot of intestinal contraction when water is used as fluid; (c) contour plot of intestinal contraction when honey is used as fluid, adapted with permission(Reference Fullard, Lammers and Ferrua148)
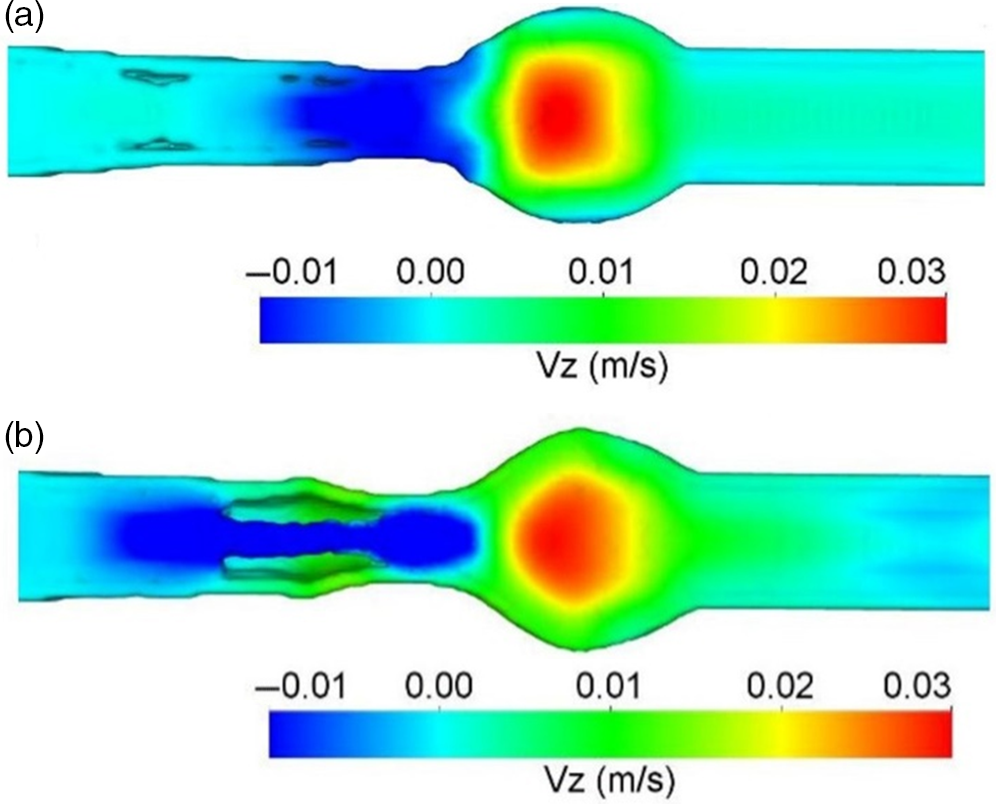
Fig. 6. Longitudinal velocity profile due to peristaltic wave of duodenum after 3 s of ingestion; (a) only fluid; (b) with 20% solid content, adapted with permission(Reference Sinnott, Cleary and Harrison60)
The diffusion coefficient in the intestine is determined by two factors: molecular weight and solubility. A change in concentration with time is given by modified Fick’s law, also called the second law of Fick (expressed as a vector quantity), at a defined location:
 $$J = - D{\cdot}\nabla C$$
where
 $\nabla $
is the gradient function
$\nabla $
is the gradient function
 $\nabla \, = \,i\,{\partial \over {\partial x}}\, + \,\,j{\partial \over {\partial y}}\, + \,k{\partial \over {\partial z}}$
; and the direction vectors (i, j, k) represent the x, y, z directions. Absorptive flux (J) is a permeability function of a compound through the intestinal membrane, which determines rate and extent of nutrient absorption in the intestine, and the flux can be represented by:
$\nabla \, = \,i\,{\partial \over {\partial x}}\, + \,\,j{\partial \over {\partial y}}\, + \,k{\partial \over {\partial z}}$
; and the direction vectors (i, j, k) represent the x, y, z directions. Absorptive flux (J) is a permeability function of a compound through the intestinal membrane, which determines rate and extent of nutrient absorption in the intestine, and the flux can be represented by:
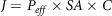 $$J = {P_{eff}} \times SA \times C$$
where P eff is the permeability, SA is the surface area (intestinal surface accessible for absorption), and C is the concentration gradient of bioactive compounds across the intestinal mucosa(Reference Burton, Goodwin and Vidmar150)
The post-prandial glycaemic response of different types of foods and mixed meals have been quantified in terms of the model-based approach by Rozendaal et al. (2018)(Reference Rozendaal, Maas and van Pul151), whose model was devised based on the kinetic constants of the blood glucose response curves after ingestion of food. Similarly, Flint et al. (2004)(Reference Flint, Møller and Raben152) predicted GI using literature values for composite breakfast meals. The equation was devised as a function of other macronutrients as follows:
 $$G{I_{meas}} = 1/0{\cdot}0057 + 0{\cdot}0005 \times fat\left( g \right) + protein\left( g \right)$$
This equation was unable to predict the GI, and its correlation with in vivo data was very poor (R2 = 0·25).
Some of the other mathematical algorithms were also developed based on glucose absorption through the intestinal walls and insulin release as follows(Reference Gyuk, Vassányi and Kósa153,Reference Plis, Bunescu and Marling154) . Equations (30–32) were devised for people with diabetes, and equation (33) represents glucose released based on mass equivalents(Reference Plis, Bunescu and Marling154). The limitations of these models are that these are developed based on human clinical trials and the physical activity and stress levels are not taken into consideration.
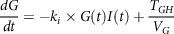 $${{dG} \over {dt}} = - {k_i} \times G\left( t \right)I\left( t \right) + {{{T_{GH}}} \over {{V_G}}}$$
Where k i is glucose absorption rate by insulin-dependent tissues; TGH is total equilibrium between insulin-independent zero-order glucose uptake by the brain and hepatic glucose output and V G is apparent dispersal for glucose volume.
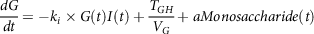 $${{dG} \over {dt}} = - {k_i} \times G\left( t \right)I\left( t \right) + {{{T_{GH}}} \over {{V_G}}} + aMonosaccharide\left( t \right)$$
 $aMonosaccharide\left( t \right)$
is absorption of the monosaccharides through the intestine wall estimated from the digestion model
$aMonosaccharide\left( t \right)$
is absorption of the monosaccharides through the intestine wall estimated from the digestion model
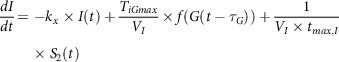 $${{dI} \over {dt}} = - {k_x} \times I\left( t \right) + {{{T_{iGmax}}} \over {{V_I}}} \times f\left( {G\left( {t - {\tau _G}} \right)} \right) + {1 \over {{V_I} \times {t_{max,I}}}}{\rm{}} \times {S_2}\left( t \right)$$
where kx
is a rate constant for apparent first-order disappearance of insulin, TiGmax
is second-phase insulin release at the maximal rate, VI
is insulin distribution volume,
 ${\tau _G}$
with respect to varying plasma glucose concentrations is the time delay with which the pancreas initiates secondary insulin release and
${\tau _G}$
with respect to varying plasma glucose concentrations is the time delay with which the pancreas initiates secondary insulin release and
 ${t_{max,I}}$
is the maximum time taken for insulin uptake.
${t_{max,I}}$
is the maximum time taken for insulin uptake.
 $$G\left( t \right) = {{{G_m}\left( t \right)} \over {2.2 \times bm}}$$
where G is glucose concentration in blood (mg/dL), Gm is mass of glucose in blood (mg), bm is body mass (kg) and t is the time (min). The absorption variation of about 25% was found in reaction kinetics of starch hydrolysis when model (33) was used(Reference Plis, Bunescu and Marling154).
Slow-wave propagation is also included in addition to peristaltic motility in the model of gut electromechanical coupling. Through computational fluid dynamics models, the mechanical deformations and generations of force could then be used as boundary conditions to enlighten the combined multi-scale models of full motility and the intestinal luminal mixing for which more anatomical details are required. New mechanical models coupled with a dye tracing process would also provide a clear way for simulation findings to be tested against analytical and imaging data. Spatiotemporal imaging experimentations can also be tested using computational fluid dynamics simulations. Various diseases, including chronic mesenteric ischemia, diabetic intestinal dysfunction and irritable intestinal syndrome, can be understood with the help of these integrated models. Signal processing and analytical techniques must take these variations into account when using methods for quantifying data for physiological applications and clinical interpretation(Reference Huizinga, Parsons and Chen155,Reference Lentle, De Loubens and Hulls156) .
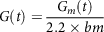
TIMCarbo has simulated the GI by combining in vitro and in silico methods. This method considers the insulin component of glucose homeostasis, which differentiates it from the other studies. Though we also require further investigations that consider other hormones involved in glycaemic response such as glucagon and incretins, as discussed previously, for a comprehensive and accurate prediction of in silico GI. The organisation of slow waves in the intestine and the interaction between interstitial cells and wave propagation is challenging to investigate experimentally but can be easily assessed using the in silico technique. These models, once established, may also be used to forecast the effects of neural input into intestinal motility disorders or intestinal slow-wave dysrhythmias, and also the succeeding effects using computational fluid dynamic studies on mixing and movement, which would allow the prediction of glucose responses in individuals with intestinal disorders.
Relevance to in vivo records
Digestion is a complex process, and in attempting to replicate the process it is necessary to consider the complementary contributions of different methodologies. A significant aspect of in vivo studies, particularly human studies, is the strong correlation of the findings, as the population of this research is also the real end-user of the food product. Though there are issues such as ethical constraints and inter-individual variabilities, the in vivo human method is the foremost important technique, especially for validation of glycaemic studies. Methods used in animal studies correlate highly with human in vivo protocols. Animal studies are typically less expensive and less laborious compared with human studies, and they can offer a degree of moral adaptability that is forbidden for human subjects(Reference Ferdowsian and Beck157). Animal selection must be considered carefully based on the target study. The selection of animals for glycaemic studies can focus on the similarity of types of receptors associated with a glycaemic response, such as GLP-1 and GLUT-4. For example, the homology of glucagon and GLP-1 in humans with those of the mouse (humanised mouse) and rat is more than 90%(Reference Lefèbvre158) whereas zebrafish shares 50% homology(Reference Mojsov159). Though gene similarity can be one of the factors to consider when selecting an animal model, other factors such as maintenance, total time invested, easy handling and cost should also be considered(Reference Muttakin, Moxon and Gouseti160). Similarly, the ex vivo rat intestine has been closely correlated with the human intestine in permeability studies because of the expression patterns of similar transporters(Reference Nunes, Silva and Chaves161). The selection process in in vivo animal studies should also be carefully considered for isolating or culturing ex vivo and culture tissues. In vitro procedures are useful to reduce the time and cost of the analytical process.
The GI of different foods found a strong association (r > 0·86) of static in vitro digestive kinetics with in vivo data in the presence of human saliva and intestinal juice in dialysis bags(Reference Jenkins, Wolever and Taylor115). Since then, attempts have been made to standardise the static in vitro protocols. Research conducted by Englyst et al. (1992)(Reference Englyst, Kingman and Cummings128), highlighted the importance of rapidly digestible starch (RDS), slowly digestible starch (SDS) and resistant starch (RS) which is sampled throughout the in vitro digestion process. These parameters and the GI values had a better correlation (r = 0·76) with the in vivo values obtained from the literature. After this, Goñi et al. (1997)(Reference Goñi, Garcia-Alonso and Saura-Calixto131) obtained an even better correlation (r = 0·91) with in vivo data. Monro and Mishra (2010)(Reference Monro and Mishra162) devised a method for estimating glycaemic response based on relative glycaemic impact, which depends on grams of glucose equivalent clearance rate that can subtract the estimated glucose from the cumulative glucose released. This was developed to mimic the curve of the in vivo glucose response. This method was successful in obtaining a correlation of r = 0·88 with experimental in vivo values and r = 0·90 with literature in vivo values. To mimic the exact human digestion conditions and to exactly predict the in vivo glycaemic response, dynamic models were employed in which the TIM-1 and TIM-2 provided consistent results for the human in vivo condition with the replication of modelling the gastro-intestinal digestion including colonic fermentation of carbohydrates and dietary fibers. By integrating TIM digestion studies with insulin response using in silico methods, the human glycaemic response curve following carbohydrate intake can be predicted much more closely(Reference Dupont, Alric and Blanquet-Diot163). The correlation of the TIM model with that of in vivo human records is shown in Fig. 7, achieving a correlation of r = 0.94. To date, this model has been successful in predicting human glycaemic response curves of different foods with strong correlation. When comparing all the models, animal models correlate perfectly with in vivo human trials. This is due to the proximity of animal genes to humans in the glucose homeostatic condition. In in vitro models, replication of motor responses from the mouth during chewing must be carefully programmed to replicate the oral phase. Since the dependency of the glycaemic response starts from oral disintegration itself, the physical forces in the stomach and absorption level at intestinal villi must be exactly mimicked. The in vitro model designed by Bionic gastrointestinal reactor (BGR) has nearly the same morphology as the real in vivo model, which increased number of folding and surface areas of the intestine(Reference Li, Zhu and Zhang164), whereas in Dynamic In-vitro Rat Stomach-Duodenum (DIVRSD) model, the enzyme secretions are automated similar to humans(Reference Wu, Bhattarai and Dhital165). The engineered small intestine system, which is a part of the 3D-printed stomach dynamic digestion model ARK®(Artificial-stomach Response Kit), could simulate computational gastric movements(Reference Gopirajah and Anandharamakrishnan52). The human oral glucose tolerance test was mimicked using the engineered small intestine system and was validated with in vivo data. The limits of agreement were within –24·52 and 22·63, corresponding to the lower and upper limits, respectively (Fig. 8)(Reference Priyadarshini, Elumalai and Moses166). This system combines in vitro, ex vivo and in silico approaches. The in silico approaches are very useful in substituting the factors that are missing such as transporters, hormones and diseases. Also, the mass transfer phenomenon due to changes in food properties and the glycaemic response can be well projected using in silico models(Reference Tharakan, Norton and Fryer167).
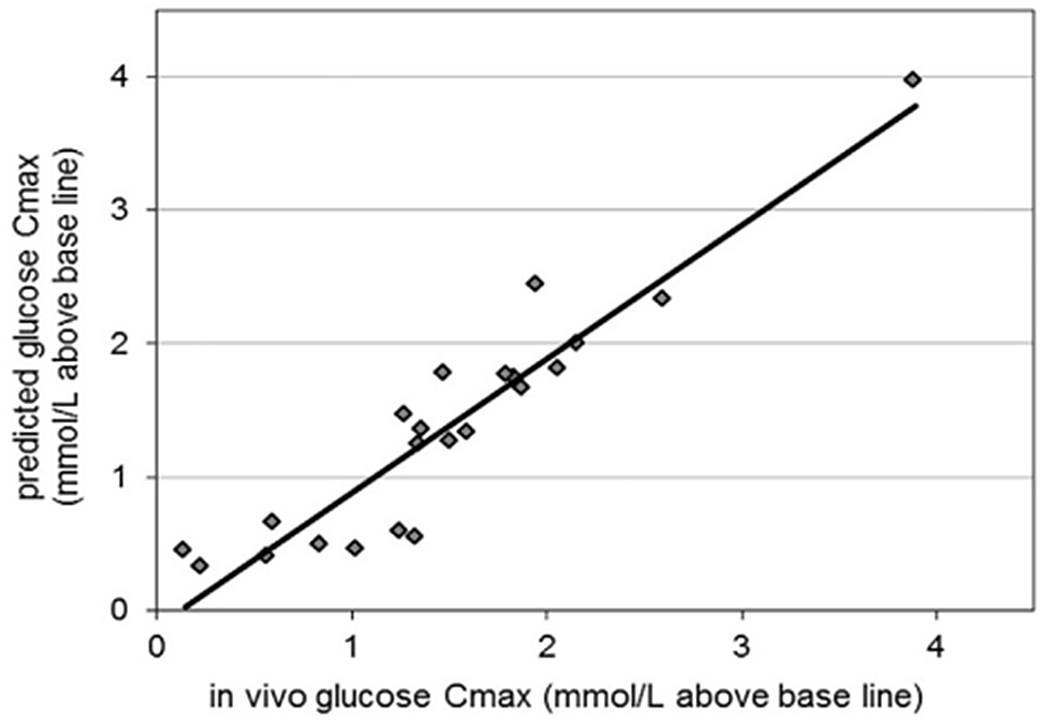
Fig. 7. Predicted glycaemic response in TIMCarbo against human glycaemic response where the correlation (r = 0.94), adapted with permission(Reference Bellmann, Minekus and Sanders175)
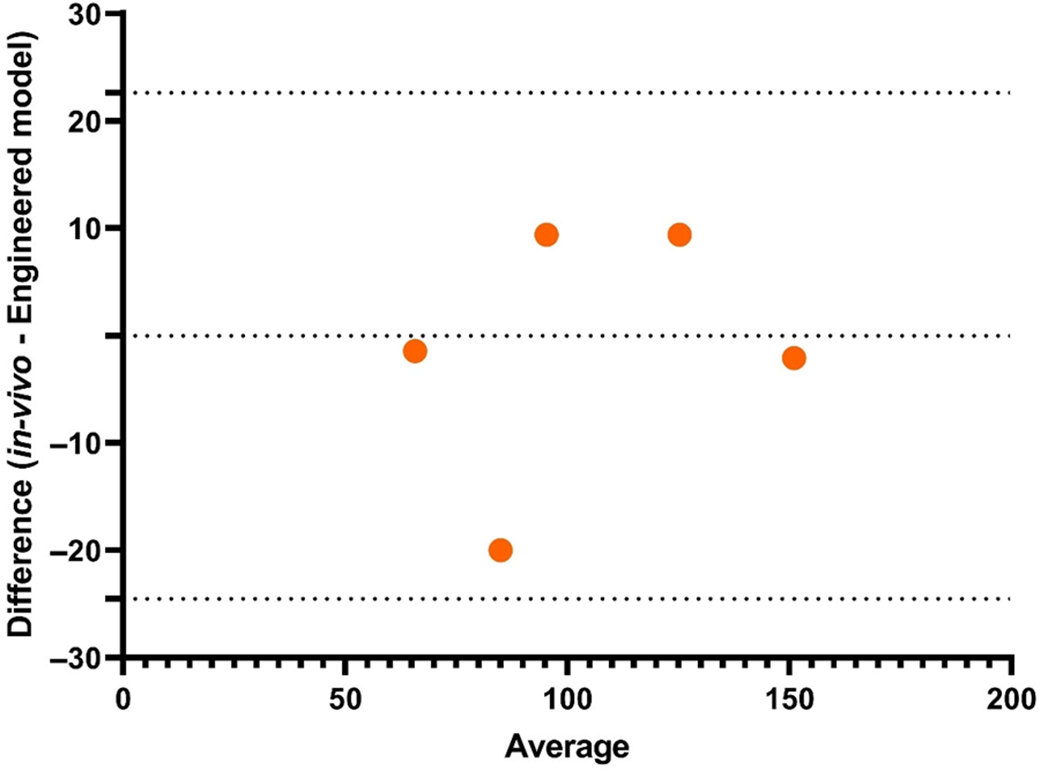
Fig. 8. Validation of predicted oral glucose tolerance test using engineered small intestine system(Reference Priyadarshini, Elumalai and Moses166)
The human in vivo method is the standalone approach that is used for testing purposes generally. If successfully validated and if a particular procedure has a strong correlation, then the protocol will be repeated and a complete ethical replacement may occur. For this scenario to be successful, a device can be formulated like the gut-on-a-chip(Reference Shim, Lee and Han120), with villi structures cultured carefully from the most relevant animal tissues based on desired selection criteria (homology, cost, maintenance and handling) or with artificially fabricated gastro-intestinal tissues analogues to the cultured tissues. This can also be automated for digestive and hormonal secretions supplementing with mass transfer parameters. Understandably, one single method cannot reproduce the exact glycaemic response. Each method has its own merits and demerits; starting from conventional GI methods (restricted and unrestricted) to emerging methods (dynamic models and gut-on-a-chip) improvements have been made to date to achieve accuracy. The in vivo animal models and ex vivo, in vitro and in silico methods can complement each other to achieve the best results. A judicious way to move forward is to have combined understanding of computational, mechanistic and omics data to deliver precise prediction for nutrient absorptivity and cytotoxicity with improved interspecies translation. This can also aid in the research and development of new food products and health supplements, in addition to providing an improved understanding of food–drug interactions, disease-related diet frameworks and personalised nutrition.
Conclusion
Digestion is a complex phenomenon, especially when it comes to glycaemic response, due to factors that affect glycaemic response such as food composition, eating rate, amylase activity, gastric emptying and intestinal motility. GI is influenced by various factors such as processing and nutrient composition. Estimating certain criteria using human trials, however, has several ethical issues. Different models such as animal models, static and dynamic in vitro models, isolated tissue models and in silico models have been developed to date, and the ability of these models to predict the glycaemic response has been reported in this work. The relevance of these models to in vivo records has also been compared. Each method has its own merits and demerits; starting from conventional GI methods (restricted and unrestricted) to emerging methods (dynamic models and gut-on-a-chip), improvements have been made to date to achieve accuracy. Nevertheless, it must be emphasised that every system mentioned in this analysis cannot be employed at the same implementation level. To achieve replication of the exact human glycaemic response to foods with different GI, we need to make complementary use of ex vivo, in vitro, and in silico models.
Acknowledgements
The author Priyadarshini S R acknowledges Council of Scientific & Industrial Research, India for senior research (09/1038(0009)2k19 fellowship.
Conflict of interest
There are none to declare.
Author contributions
Priyadarshini S R: data curation, original draft; Moses J A: review and editing, resources; Anandharamakrishnan C: conceptualization, review and editing, supervision.


