
The NBC Evening News cameras panned over drab schools, hardened lunch pail-carrying steelworkers, and an elderly woman sweeping leaves in front of her dated house. In voiceover, correspondent Del Donahoo intoned, “Youngstown is a workingman’s town [where] the people with money have moved to the suburbs.” Donahoo was there to answer a puzzling question: Why had voters in the Ohio city defeated six consecutive school levies? It was a question being asked not just by Donahoo and the college students going door-to-door for a locally sponsored survey designed to help boosters pass the next levy, but also by local and national journalists, social scientists, consultants, and public officials. Though not all observers used the term, each was trying to explain what was by then a full-scale “tax revolt.” While Youngstown and its six consecutive defeats was a dramatic example, it nonetheless captured an undeniable trend that would culminate a decade later in the revolt’s signature event, California’s Proposition 13.
Most scholarly and popular accounts treat Prop 13 as the beginning of the revolt, which then spreads outward and upward, first to other states and then to the federal government with Ronald Reagan’s 1980 election and subsequent tax cuts.Footnote 1 In these accounts, the revolt is understood as a conservative backlash driven by “mostly white taxpayers [who] saw themselves as being forced, through taxes, to pay for medical and other services for other disproportionately black and Latino people,” a realization that “moved [whites] decisively toward an even more individualistic, anti-tax perspective” and “against the public sector,” as one historian recently summarized.Footnote 2 The notion of the tax revolt as a white backlash against a racialized welfare state has its roots in Kevin Phillips’s 1969 book The Emerging Republican Majority and was articulated most clearly by journalists Thomas and Mary Edsall in their 1992 book, Chain Reaction. Footnote 3 According to the Edsalls, whites who had previously supported New Deal liberalism and the taxes that went with it turned against liberalism in the 1960s and 1970s because the Democratic Party’s growing racial liberalism “drove home the cost to whites of federal programs that redistribute social and economic benefits to blacks and other minorities.”Footnote 4
Other, more nuanced, accounts have challenged the backlash framing of the revolt by arguing that the revolt crossed ideological lines and had its roots in the structure of American taxation itself. Sociologist Isaac Martin, for example, argues that the modernization of property-tax assessment that many states undertook in the late 1960s and early 1970s caused the revolt by eliminating informal “fractional assessment” breaks that some homeowners enjoyed.Footnote 5 Like Martin, journalist Robert Kuttner has placed part of the blame for the revolt on modernization, but Kuttner suggests that “inequities in the tax systems” and the “broader economic distress” caused by the stagflation of the 1970s were the primary causes of the revolt.Footnote 6 Kuttner also notes that progressive activists, not just conservatives, organized around taxes in the early-1970s. Historian Robert Self likewise presents a more complicated narrative of the revolt in his history of postwar Oakland. According to Self, the revolt was driven by the breakdown of the “suburban compact,” under which local officials kept taxes on white suburban homeowners low by pursuing business-friendly development. But this strategy was no match for the assessment reforms cited by Martin and California’s rapid inflation in housing costs in the 1970s, which exposed previously insulated suburban homeowners to the pinch of rising property taxes. Conservative activists, Self argues, were able to use suburban whites’ frustration with rising property taxes to tap into their resentments “against rising welfare costs, state bureaucrats, county assessors, inflation, and rising service and education costs.” The result was the passage of Prop 13, which “laid the groundwork for the Reagan era in the national political culture and signaled a fundamental shift in the public’s relationship to liberalism and the long legacy of the New Deal.”Footnote 7
This article challenges the backlash and assessment modernization explanations of the revolt, as well as the notion that it was centered in sunbelt suburbs, while building on and complicating the argument that the revolt was a cross-ideological movement rooted in tax inequities and economic distress. This article demonstrates that the revolt began at the local level more than a decade before Prop 13 and years before assessment modernization—even occurring in states that did not pass assessment reforms. It also shows that the revolt was not confined to suburbs, whites, conservatives, or middle- and upper-class voters. While both economic and racial conservatives consistently opposed taxes, outside solidly Republican areas they were rarely sufficient in number to defeat local tax increases (or, later, pass tax-limitation initiatives). Instead, poor and working-class voters were the most likely to participate in this early revolt, not the well-off, and African Americans were just as likely as whites to vote against local levies and bonds. The early revolt occurred in urban, rural, and suburban communities. But declining industrial cities such as Youngstown, Ohio, where the regressive impact of the property tax was particularly acute, were especially susceptible to the revolt. Rather than represent a turn to the right, the revolt was driven by both rising tax burdens on low- and middle-income Americans and a growing realization that the tax system unfairly benefited the wealthy. Both of these issues intersected in the form of the property tax, which also happened to be the only type of tax on which most Americans could cast a vote.
More than a decade before voters cast ballots for Prop 13 and its progeny, they began defeating local property-tax levies and bonds at records rates.Footnote 8 In the early-1950s, local schools across the country could count on voters approving 80 percent of levies and bonds, but by 1970 approval rates had fallen to less than 50 percent.Footnote 9 Local officials confronted with these defeats struggled to explain them.Footnote 10 Some believed the phenomenon was a white backlash against civil rights and school integration.Footnote 11 However, national surveys actually found that whites supported local school levies at slightly higher rates than people of color.Footnote 12 Moreover, overwhelmingly white rural and suburban communities were facing educational revenue crises, too.Footnote 13 Others thought that the tax revolt portended rising antigovernment conservatism.Footnote 14 But the voters turning down school levies told pollsters that they supported the schools and did not believe teachers made too much money. Many also were voting Democrats into office.Footnote 15 Most observers and officials were simply puzzled. They could not understand why voters would spite their own schools and governments.
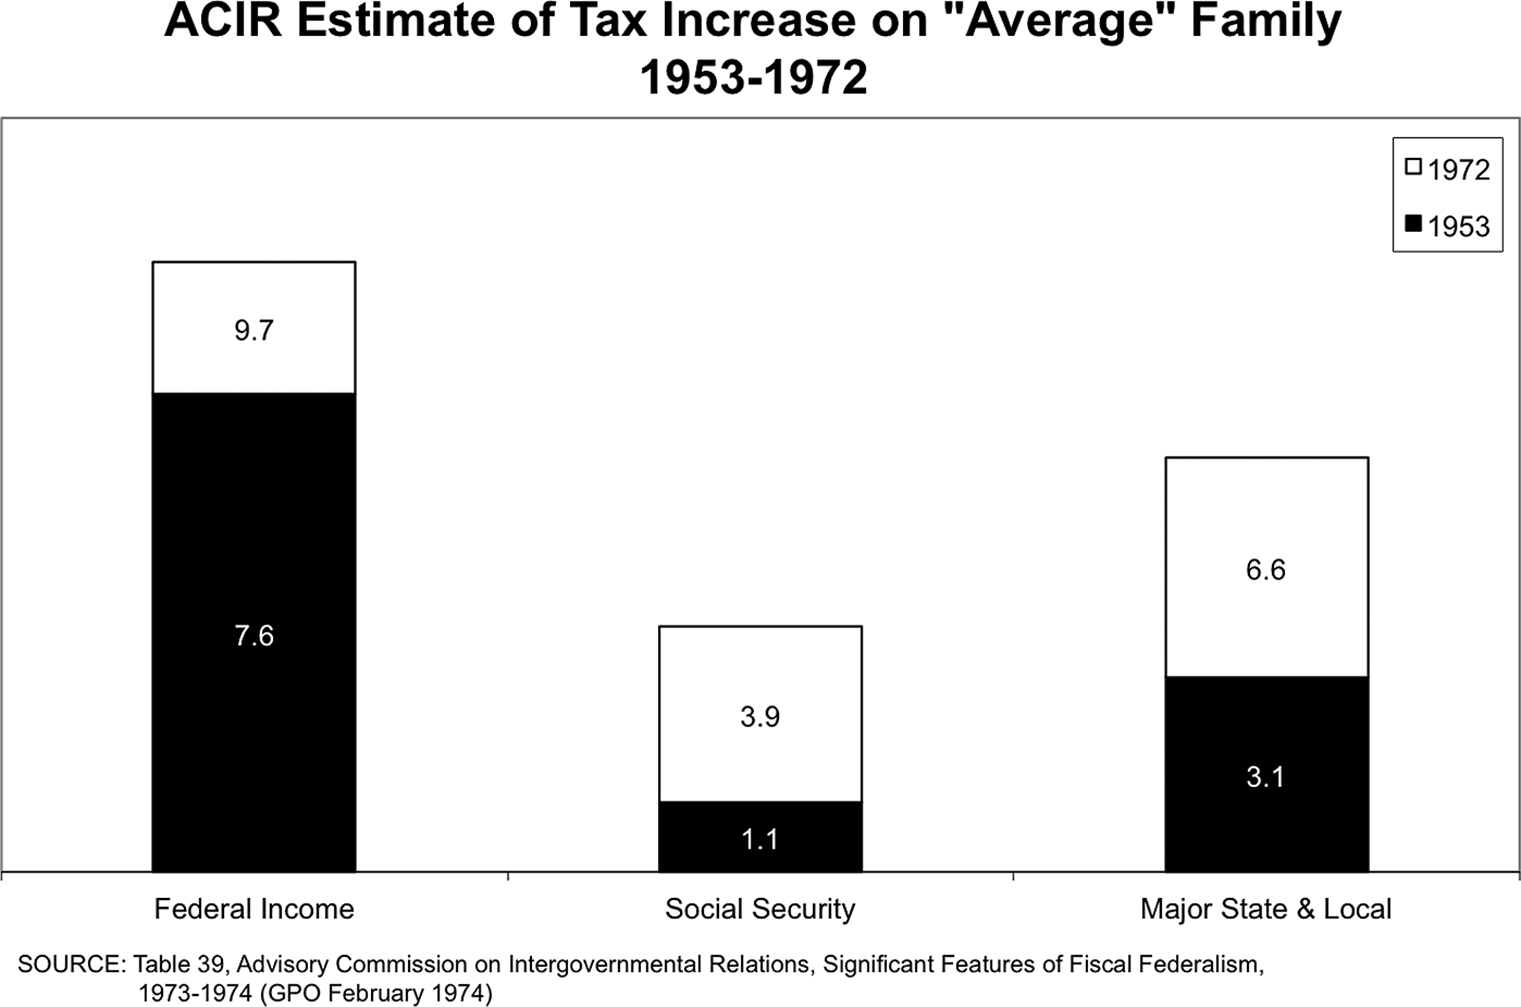
But voters had a simple explanation. As one African American worker in Youngstown told the door-to-door interviewers, “I earn approximately seven-to-eight thousand dollars a year… . I have five kids, and we don’t have any new automobiles … [and] we can’t save money because I think the taxes are too high.”Footnote 16 This worker had a point. Between the early 1950s and the early 1970s, taxes increased dramatically for most low- and middle-income Americans. Taxes on a family of four making just above median income almost doubled—from 11.8 to 20.2 percent—between 1953 and 1972, according to the Advisory Commission on Intergovernmental Relations. The biggest single increase came in state and local taxes. These taxes, especially sales and property taxes, were regressive, taking a greater percentage of income from lower-income taxpayers than higher-income taxpayers.Footnote 17 Combined with inflation, rising taxes created what was widely dubbed a “pocketbook squeeze” on low- and middle-income Americans.Footnote 18 In contrast, thanks to cuts in federal income taxes—one of the few progressive taxes in the American fiscal system—upper-income taxpayers’ burdens actually fell between 1953 and 1972.Footnote 19
The architects of those federal tax cuts, the Kennedy-Johnson “growth liberals,” largely missed this pocketbook squeeze. When making tax policy, they focused on growth, not distribution. Growth, they believed, had ushered in a middle-class society, its prosperity acting as a salve on the economic anxiety that had characterized the Great Depression and the years immediately following World War II. They thought, in Kennedy’s famous words, that a rising tide had lifted all boats.Footnote 20 In failing to address the roots of the revolt, both the growth liberals and the “New Democrats” who would follow them set the stage for Prop 13, which Republicans and conservative activists would successfully spin as a vindication of supply-side economics, permanently altering the direction of American taxation and American politics, more broadly.
Growth Liberalism and Its Discontents
When Time magazine placed British economist John Maynard Keynes, dead for nearly two decades, on its cover at the end of 1965, it was as much an endorsement of the Kennedy-Johnson administration’s “growth liberalism” as it was of Keynes himself. Kennedy, the magazine explained, was the first Keynesian president. His administration’s economic advisers “presided over the birth of the New Economics,” which meant “spur[ing] an expanding economy to still faster growth” through tax cuts.Footnote 21 The Kennedy-Johnson administration had little use for the tax populism of Franklin Roosevelt, who had declared, “Here is my principle: Taxes shall be levied according to ability to pay. That is the only American principle.”Footnote 22 For the Kennedy-Johnson team, distribution of income was secondary to the growth of the country’s total income. As Kennedy’s chair of the Council of Economic Advisers, Walter Heller, explained in 1961, “[I]t is far easier to achieve many of our common goals by enlarging the size of our economic pie than by transferring income and wealth from one group to another.”Footnote 23 The administration’s proposals strenuously avoided any appearance of redistribution by stressing the “across-the-board, top-to-bottom” nature of its tax program, as Kennedy put it.Footnote 24 Some progressives—from labor leaders George Meany and Walter Reuther to Former Truman economic adviser Leon Keyserling—objected to the administration’s neglect of issues of distribution and complained that various “loopholes” that benefited the rich were being left unplugged.Footnote 25 But Kennedy worried that debates about loopholes and distribution would delay passage of the tax cuts, and progressive critics were persuaded to drop their objections in order to facilitate speedier passage of the tax cuts.Footnote 26
While federal policymakers failed to act, the public’s frustrations about the fairness of the tax system grew. In the middle of the decade, a flurry of exposés outlining the inequities of the tax code hit newspapers, magazines, and bookstore shelves. In 1964, Philip Stern, an outspoken critic of the Kennedy-Johnson cut, published The Great Treasury Raid. The front cover of the mass-market paperback, which was excerpted widely in national and local publications, turning the tax treatise into an unlikely bestseller, blared, “MISSING: FORTY BILLION DOLLARS EVERY APRIL 15th! The story of: How five people had incomes of $5 million but paid no tax. How one person had an income of $20 million but paid no tax. How movie magnate Louis B. Mayer was saved $2 million by a special tax law all his own.” If the loopholes that allowed many of the richest Americans to pay less than middle-class families were closed, Stern explained, everyone, especially taxpayers with modest incomes, could pay much lower rates.Footnote 27The Great Treasury Raid was joined by high-profile examinations of tax loopholes by Newsweek and New York magazines, Tennessee Democratic Senator Albert Gore, muckraking journalist Jack Anderson, and humorist Art Buchwald, among others.Footnote 28
As publications’ pages overflowed with tales of loopholes in the federal tax code, most Americans needed only to look down their street to find examples of tax inequities much closer to home. Despite “fractional assessment,” Census data shows that homeowners and industrial and commercial property owners faced nearly identical assessments when measured as a percent of sales price.Footnote 29 But these averages concealed a great deal of variation.Footnote 30 In theory, assessors assigned each property an unbiased, scientifically determined market value that approximated what its sale price would be on the market. In practice, the assessment process was highly subjective. A combination of political favoritism, ineptitude, and the inherent difficulty of determining the value of an unsold good meant that similar properties varied widely in their assessments. As a result, lower-income homeowners usually faced the highest property tax rates. African American homeowners, in particular, faced both economic and racial discrimination in assessments. Meanwhile, high-income homeowners usually paid the lowest rates.Footnote 31 Among commercial and industrial property, small businesses, particularly minority-owned businesses, paid often strikingly high rates, while the largest manufacturers and commercial property owners usually paid the lowest, thanks to their economic and political clout.Footnote 32
By the 1960s, tales of both simple inequity in assessment and outright corruption in assessor’s offices dominated headlines across the country.Footnote 33 In 1965, a disgruntled tax consultant turned over his files to the California Attorney General, and the resulting investigation, centered on San Francisco’s assessor, ensnared officials in other counties and other states. Most dramatically, the San Diego assessor killed himself rather than stand trial.Footnote 34 Cities small and large saw similar scandals, including New York City, where a state investigation alleged that Mayor John Lindsay’s chief fundraiser—who also happened to be the city’s tax commissioner—gave lower assessments to businesses that donated to Lindsay’s campaigns.Footnote 35 Even ethical assessors avoided tangling with commercial and industrial landowners, who had the money to hire experts and challenge assessments. As a result, many assessors simply gave companies a favorable assessment from the start or let them assess themselves. Homeowners did not get the same benefit. “It was easier to go after the homeowners because they were a defenseless group,” explained Peter Behr, a member of California’s Marin County Board of Supervisors in the mid-to late 1960s. “Little grey-haired ladies would come in, widows sometimes, and they would say with tears in their eyes, ‘I can’t say I couldn’t sell my house for this amount, but I can’t afford to pay the taxes, and I don’t want to sell my house! I don’t know what I can do about it!’ Whereupon, county counsel, quite properly, would be forced to say, ‘Well, we certainly sympathize, but that’s not a legal reason for reducing the valuation.’ It was never a fair contest.”Footnote 36
Polls reflected the growing public cynicism about the tax system.Footnote 37 By the early 1970s, nearly 90 percent of Americans said that “the big tax burden falls on the little man in this country today,” three-quarters said that “the tax laws are written to help the rich, not the average man,” and 90 percent agreed that “there are a lot of tax loopholes for the rich to avoid taxes.” Sixty percent also agreed that “tax shelters are just a clever device to the let the rich pay less taxes than the average person,” though the higher one’s income, the more likely he or she was to disagree (with the richest respondents almost evenly split on the question). These two convictions—that taxes on low- and middle-income Americans’ taxes were causing a pocketbook squeeze and that the tax code was letting the rich off easy—were related. Seventy percent—particularly low- and middle-income respondents—said that tax shelters meant that “middle income people have to pay higher taxes” to cover for the taxes not paid by the rich. Americans also made the connection between their own rising tax bills and favoritism for the rich and well connected. Eighty-three percent of Americans told pollsters that the rich were using loopholes to avoid paying their fair share of taxes, and 62 percent of Americans said that they “would feel better about the taxes [they] pay” if “many of the loopholes for the rich were closed.”Footnote 38 Though they were angry about the tax system, few Americans had confidence that their concerns would be addressed. More than 80 percent lamented that “politicians promise tax relief before election[s] and then do nothing about it when elected.”Footnote 39 A fall Harris survey 1973 comparing the public’s views on government with state and local officials’ views found that “one local government function that earns the [government] leaders’ confidence but the public’s disdain is tax assessment.” Only 19 percent of Americans had “a great deal of confidence” in local tax assessment, less than in television news, organized labor, major companies, and even law firms. Among major government and social institutions, only the White House—in the middle of the Watergate scandal—was less trusted than local property tax assessors. As one Des Moines, Iowa, homeowner commented, “I’d like to know how the tax assessment works and why we seem to pay more than other people with better houses and more land.”Footnote 40
Not only was the local property tax rife with inequities, but property rates also were rising inexorably throughout the post World War II decades. What low- and middle-income taxpayers experienced as a pocketbook squeeze, local officials experienced as a slow-moving fiscal crisis. These problems were related, and they flowed down from the top. The federal government was complicit not only in its inaction on comprehensive tax reform but also in shifting of fiscal responsibility to states and localities as it created new programs from the New Deal to the Great Society. Federal mandates in areas like social welfare and medical care usually required states and localities to contribute their own revenue in exchange for partial federal funding.Footnote 41 When combined with the public’s increased demands for local services, which went hand-in-hand with a growing, modernizing economy, state, county, and local budgets felt the strain. The incentive at all levels of government was to shift the costs to a lower level, with cities and towns being the last in line. Most state lawmakers were loath to enact new taxes or raise existing taxes. Instead, states often pushed the burden onto localities. The final stop in the cascade of buck-passing was the local taxpayer.Footnote 42
Many national experts and policymakers lamented the decision to cut progressive federal income taxes when regressive state and local taxes were soaring and pointed to a solution. During hearings on the Kennedy-Johnson tax cuts, Keyserling told the Ways and Means Committee that policymakers should not focus solely on the federal burden, but should instead consider the “entire tax burden—federal, state, and local, direct and indirect.” According to Keyserling, it was “not the time to diminish the progressive nature of the federal personal income tax, either on economic or social grounds,” since “outlays of the states and localities have risen many times as fast as the outlays of the federal government,” resulting in rising regressive state and local taxes.Footnote 43 The president himself had once made a similar argument. On the campaign trail in 1960, Kennedy bemoaned that the property tax had reached “confiscatory” levels in many cities. The solution, Kennedy argued, was federal revenue sharing with states and localities.Footnote 44 “The next administration,” Kennedy explained, “is going to have the problem of attempting to provide the necessary revenues to be secured for the local and state and national governments in such a way that these communities can meet their problems.”Footnote 45 Despite Kennedy’s enthusiasm for revenue sharing, neither Kennedy nor Johnson pushed for its enactment.
The distributional upshot of the Kennedy-Johnson administration’s inaction on both tax reform and revenue sharing was that the tax burden on low- and middle-income Americans continued rising throughout the 1960s. The biggest culprit in this rise came from regressive sources, such as the federal payroll tax and the local property tax (Figure 1). The combination of cuts to the progressive income tax and increases in regressive taxes meant that, between the beginning of the 1950s and the end of the 1970s, the tax burden went up on average Americans, even as it fell for upper-income Americans (Figure 2). Inflation made matters worse in three ways. First, even when income gains were wiped out by inflation, rising nominal incomes pushed taxpayers into higher income tax brackets, since brackets were not indexed to inflation. Second, rising prices on consumer goods also indirectly increased sales taxes as a percentage of income for many Americans. Third, rising property values dramatically increased property taxes. Between 1960 and 1970, median home values in the United States increased from $11,900 to $17,000, before soaring to $47,200 in 1980. Higher rates often applied to these higher values, too. Property tax rates on FHA single-family homes increased by nearly 50 percent from 1958 to 1971.Footnote 46

Fig. 1. The Advisory Commission on Intergovernmental Relations’ 1974 study of the “average” family’s changing taxes over two decades showed significant increases in both federal payroll and state and local taxes. The latter was driven primarily by soaring property taxes.

Fig. 2. When combined with the rise in federal payroll and state and local taxes, the enaction of Kennedy-Johnson tax cuts meant that taxes on upper-income Americans fell in the early post-WWII decades as taxes on lower- and middle-class American rose.
These rising regressive taxes helped create a pocketbook squeeze on lower- and middle-income Americans. According to the Bureau of Labor Statistics, in 1970 more than half of all American families fell below what it called an “intermediate” family budget—a budget that assumed appliances lasted for decades, clothes lasted for years, no income needed to be saved, and families could go to the movies once a month for their only entertainment—and 30 percent fell below the level of its “lower” family budget, which was even tighter than the “intermediate” budget.Footnote 47 It was this pocketbook squeeze—and taxes’ role in its creation—that set the stage for an amorphous, unorganized revolt at the local level, where voters had a direct say in at least one form of taxation.
“The Lesson of Youngstown”
On a February evening in 1969, Americans across the country turned on their televisions to watch the nation’s top-rated show, Rowan and Martin’s Laugh-In. Footnote 48 After the show’s episode’s trademark “party” scene and a few sketches, Dan Rowan and Dick Martin took to the stage to award the people of Youngstown, Ohio, a city known for its steel production and organized crime, the “Flying Fickle Finger of Fate Award,” designed to recognize acts of “gigantic stupidity.”Footnote 49 Youngtowners received the dubious award because they had forced their city’s schools to close by defeating six consecutive school levies.Footnote 50 Already the subject of national articles and nightly news segments on its tax crisis, the city of Youngstown now was literally the butt of jokes. What the hosts of Laugh-In and national reporters did not realize was that within a few years Youngstown’s crisis would no longer be so notable, as dramatic levy and bond failures became a common occurrence throughout the country.
Youngstown’s levy crisis had begun innocuously enough. The first levy failure, in December 1966, barely made a ripple in even the local news. The levy had received nearly unanimous, bipartisan support from local leaders.Footnote 51 But on Election Day seven out of ten voters opposed the levy, and only a third of those eligible to vote went to the polls.Footnote 52 For their second attempt, city leaders mounted a larger pro-levy campaign. A Citizen’s Advisory Committee spread its “SOS” (“Save Our Schools”) slogan in ads that ran in the days leading up to the election, volunteers telephoned voters and passed out pro-levy leaflets at the gates of the city’s many steel mills, and forty fifth graders staged a pro-levy march, carrying signs like “Don’t Let Education Go Down the Drain” and “Pass the School Levy.”Footnote 53 The night before the election, all local television and radio channels simultaneously broadcast a live call-in show where proponents of the levy answered questions from skeptical voters.Footnote 54 But the expanded efforts failed. Even though twelve thousand more Youngstowners voted this time, as many of the new voters cast ballots against the levy as for it. The levy garnered only 35 percent of the vote citywide and failed to win a majority in any ward.Footnote 55 Five months later, the levy appeared on the ballot again. The usual endorsements rolled in from both political parties, numerous religious and civic organizations, and the city’s daily paper, the Vindicator. Footnote 56 Yet the levy failed again, with 44 percent of the vote.
The school board set a fourth vote for May, and supporters launched an aggressive public relations campaign.Footnote 57 Levy proponents put aside moral suasion and instead focused on instrumental economic appeals. When the Ohio superintendent of instruction, Martin W. Essex, visited Youngstown to make a headline-grabbing address to the teachers union’s annual dinner, he argued, “Youngstown citizens must support their schools in order to maintain their own property values, build an advancing economy for the city, and provide opportunities for young people.”Footnote 58 The point was echoed in Vindicator editorials, along with an advertisement by the Youngstown Area Board of Realtors (YABR) that read, “Good schools attract home buyers and thus support property values. Protect the value of your property and your neighbor’s, too; urge them to vote ‘YES’ for the school levy.”Footnote 59 But these new appeals to self-interest were not enough. The levy failed again, its support dipping slightly, to 42 percent. Perhaps the only consolation for levy’s supporters came in the fact that most other revenue-raising measures in nearby towns failed that day, including a tax hike in nearby Campbell. Only more well-off suburbs approved school finance measures.Footnote 60
Waiting only a few days more than the 25-day minimum, new superintendent William Zinser scheduled another vote for June. This time, because it was a special election, the board had to foot a $45,000 bill.Footnote 61 It also adopted a new tactic. As one analyst put it, “The desperate board resorted to the sleeper strategy, truly a ‘quiet election’—no media publicity, no billboards, and no literature.”Footnote 62 “[L]ittle was said about the levy,” another observer explained, “in the hope that opponents would stay home.”Footnote 63 The “sleeper strategy” succeeded in one sense: turnout plummeted over 25 percent. Unfortunately for the levy’s supporters, more pro-levy voters than levy opponents stayed home, and the levy received only 37 percent of the vote.Footnote 64
Despite the levy’s loss, schools opened that fall. The school board scheduled another vote on the 12-mill levy for November, and it warned that if this vote failed the schools would close.Footnote 65 The recent closing of Perry Local Schools, outside nearby Cleveland, made the threat all the more real. In a last-ditch effort to avert school closure, levy supporters staged their most publicized and provocative campaign yet. A new Committee to Keep Schools Open adopted the “shock[ing]” slogan “Give a Damn” for its campaign,Footnote 66 The committee also ran large, emotional ads asking Youngstowners to “VOTE FOR ALBERT … And Mary, and Jack, and Pete, and Joan.” In the fine print, the ads warned that, if the schools closed, “all our children lose … no one will want to move to Youngstown … business will not want to locate here … [and] all property values fall, that means dollars to you.”Footnote 67 Returning to a strategy from the May 1967 campaign, local television station WFMJ aired another hour-long call-in program where the board of education, superintendent, and levy committee chairman answered questions about the levy.Footnote 68 But Youngstowners narrowly defeated the levy, with 49 percent voting in support, marking its sixth loss in a row.Footnote 69
This time, the defeat produced one unmistakable fact: the schools closed. The closing brought with it a degree of national attention that undoubtedly surprised both Youngstown’s leaders and its citizens. All three national television networks and reporters from print publications across the country descended on Youngstown for a first-hand view of the closings. They painted a picture of a city in crisis. “Mrs. Jack W. Sullivan has three school-aged boys who are not in school,” read an Associated Press article. “They are home underfoot, watching television and fighting boredom.” The school closings “dumped more than 13,000 bodies into the city’s labor market … [creating] a sudden, fierce competition for full- and part-time jobs … in a town where there are already layoffs at some mills and strikes at other.”Footnote 70
Beyond chronicling the chaos, national reporters wanted one question answered: Why had Youngstowners spited their own schools? Superintendent Zinser told the press that “white ethnic groups” were to blame for the levy defeats, because of their refusal “to spend any money for other minority groups.”Footnote 71 Paradoxically, however, local black leaders worried that the city’s African American voters were failing to support the levy, perhaps as a form of social protest at the ballot box.Footnote 72 Conservatives hopefully speculated that the levy defeats were the result of a growing antitax, antigovernment sentiment.Footnote 73 According to the National Review, Youngstown’s crisis represented voters’ new “conservative mood” when it came to taxes.Footnote 74 Conservatives’ preferred explanation received an unexpected boost from the New York Times, where reporter Anthony Ripley blamed the teachers union for demanding raises, thereby necessitating higher property taxes. The levy defeats, in this telling, were a rejection of public-sector unions and big government.Footnote 75
One theory rarely voiced by pundits and local leaders was that voters were expressing distaste with the fairness of the property tax or the distribution of taxes, more broadly. Yet nearly every levy opponent who voiced his or her views in letters to the Vindicator called attention to pocketbook concerns.Footnote 76 One explained how “a great number of [Youngstown] taxpayers are presently living (or existing) on fixed incomes, pensions, Social Security, low wages, or even unemployment.” Low-income residents, the writer continued, “are unable to bear this additional burden no matter how good the cause may be.”Footnote 77 Some letter writers even appealed to notions of distributional fairness. “We must have education for our children … but it is not necessarily so that it must be borne on such an unequitable [sic] basis,” another Youngstowner wrote. “[L]awmakers must change our present laws … [and] tax on income according to ability to pay. … Failure of this levy should help to wake up the lawmakers to the injustices as they now exist.”Footnote 78
Regardless of how the defeat was explained, national attention to the school closures ensured that Youngstown’s leaders were determined to end the revolt at six levy defeats. As a result, the united pro-levy front presented by political, civic, religious, business, and labor organizations during previous levy drives paled in comparison to the seventh campaign. The idea for the campaign came from two senior girls at Chaney High School, who proposed “Operation Armband,” which called for all seven thousand of the city’s high-school students to wear red armbands in support of the levy.Footnote 79 What began as a heartfelt appeal by two high school girls quickly morphed into an expensive media campaign. Youngstown Sheet & Tube’s (YS&T) “advertising men,” who thought that the girls’ idea made “great copy,” designed ads that ran in the Vindicator almost every day in the weeks leading up to the levy and also appeared regularly in the city’s black newspaper, the Buckeye Review. Footnote 80 “Your ‘Yes’ vote,” one version of the ad explained, “keeps our schools open / gives our young people a chance / maintains your property values / insures continued business development (this means jobs) and provides your family with a secure future here.”Footnote 81 City leaders stressed that the levy’s passage was in Youngstowners’ self-interest. “The very survival of basic industry here begins on making Youngstown a desirable area which attracts new families and commercial enterprise,” YS&T president Robert E. Williams told the Vindicator. “A faltering school system makes it difficult … to keep property values up, as well as maintain a capable labor force.”Footnote 82 Doubling down on their earlier appeals to homeowners, the YABR pitched the levy as homeowners’ best defense against plummeting property values, distributing fifty thousand leaflets that read: “IF YOU HAD TO SELL YOUR HOUSE TOMORROW? DON’T PAINT IT. DON’T FIX IT UP. DON’T CUT THE GRASS. IT WON’T BE WORTH ANTHING WITHOUT SCHOOLS. VOTE FOR THE SCHOOL LEVY.”Footnote 83 The YABR also conducted and publicized a study that claimed that home values in Youngstown were down 20 percent compared to surrounding suburbs because of levy defeats and predicted that property values would fall even further if it failed again.Footnote 84
Notably, some levy supporters began to alter their pro-levy appeals to address the possibility that concerns about the distribution of the tax burden had been motivating some “no” votes. Even as it endorsed Youngstown’s levy, the Chesterton Club, a Catholic lay group, “strongly recommend[ed] to all who are working for passage of the levy to expend equal energy and attention to redress the inequities of the present system of taxation with an end toward affording relief for those on retirement, Social Security, or other fixed limited income.”Footnote 85 The Buckeye Review agreed. “The defeat was caused … by the attitude of the public against taxes in general, and more specifically a rebellion against property taxes,” it argued in an editorial.Footnote 86 Voters, the Review conceded, “justly” felt “that the [school] tax should be more equitable and in some other form—a sales tax or income tax.”Footnote 87 Likewise, school board member Abe Harshman acknowledged that many Youngstowners saw the 12-mill levy, which was projected to raise taxes on an $11,000 home by $55 per year (in 1969 dollars), as a “regressive and unfair tax” and were therefore “revolting against taxes in general and against specific taxes in particular.”Footnote 88
But for those who believed that the root cause of the revolt was racism, not regressivity, the events in the weeks leading up the seventh levy vote did little to help its chances. In late April, the Youngstown Welfare Rights Organization (YWRO) staged a sit-in at the Mahoning County jail and office building, and the local press gave the sit-in extensive—and racially charged—coverage.Footnote 89 The Vindicator devoted several articles and spread dozens of photos over multiple pages to document the peaceful, if contentious, protest, which eventually resulted in twenty-three arrests. “Chicken Is ‘Sit-In’ Menu,” read the headline for an article that went on to explain how “county commissioners’ conference rooms deteriorated into a confusion of orange peels, chicken bones, wax paper, and sleepy children late Monday night.”Footnote 90 As the Buckeye Review reported, “much of the white community appeared to be shocked over the welfare protests,” and “persons who telephoned the various ‘talk’ radio programs [to discuss the protests] expressed everything from concern to outright racial bigotry.”Footnote 91 If working- and middle-class whites were voting against the levies because of rising race-based antiwelfare sentiment, then the YWRO’s protests were serious setbacks for pro-levy efforts.
In the weeks leading up to the levy, supporters seemed determined to pass the levy by sheer force of action.Footnote 92 The Vindicator turned itself into a de-facto pro-levy newsletter. The combination of official “Arm Band” advertisements, pro-levy advertisements from smaller organizations, and various thinly veiled pro-levy photos and articles meant that in the days leading up to the levy, every third or fourth page of the Vindicator contained some kind of pro-levy message.Footnote 93 The paper printed a series of cartoons “illustrating the plight of Youngstown’s public school children” and ran articles profiling each of the city’s forty-six schools.Footnote 94 Those who ignored the local press could not avoid the rallies, marches, and get-out-the-vote efforts that reminded voters to pull the lever for the levy. Schools throughout the city dismissed students a half-hour early so teachers and school staff could attend a rally kicking off the campaign, and in the weeks leading up to the vote schools across the city staged various “Join the Arm Band” events”Footnote 95 A bevy of door-to-door campaigns and phone banks also meant that thousands upon thousands of Youngstown residents received personal contact about the levy. The local PTA and NAACP undertook “a giant sign-up campaign,” where volunteers “canvass[ed] every home asking for signers, whose names will be printed in advertisements backing the levy.”Footnote 96 Three hundred Youngstown State University (YSU) students, who spent the Saturday before the election canvassing all seven of the city’s wards, joined them.Footnote 97 The NAACP also mounted its own telephone campaign, while other levy supporters manned flier-distribution centers.Footnote 98 The disparate strands of the pro-levy campaign came together in a final, powerful advertisement, which took up ten pages in the Vindicator the day before the levy and featured the names of thousands of levy supporters in fine print. The first page read “*Join the Arm Band. WE DID! IT’S GROWIN AND GROWING… . YOU CAN JOIN US ON MAY 6th BY VOTING “YES” FOR THE SCHOOL LEVY.”Footnote 99 If this campaign failed, it was hard to see what could top it. “We’ve done everything humanly possible to explain and clarify the issue for the people of Youngstown. Now it’s up to them,” Harshman told the Vindicator. Footnote 100
Luckily for supporters, the levy passed. The victory understandably left many of the campaign’s organizers patting themselves on the back. But the voting data cast doubt on their self-congratulation. In fact, a Vindicator “straw poll” conducted prior to the “Arm Band” campaign’s kick-off already showed public opinion shifting in favor of the levy.Footnote 101 It seemed that the school closings and the associated negative attention from the national press pushed enough opponents of the levy to support it or, at least, stay home. After the record 53,000 turnout of the November 1968 election, the May special election saw less than 48,000 Youngstowners cast ballots. The levy received about 1,500 more votes in May than it had in Decembers, but due to a whopping 6,500 fewer opposing votes, it passed by a substantial 57–43 percent margin.Footnote 102
Now that the city’s levy crisis was over, local officials received clear answers about the cause of the revolt. After the sixth levy failure, representatives from YSU, the board of education, and the Chamber of Commerce all seized on the idea of a comprehensive study to assess the causes of the levy failures. Two YSU professors designed a questionnaire based on complaints voiced in call-in talk radio shows, letters to the editor, and interviews with Youngstown voters. The two professors also broke the one-thousand-person survey into two waves, so that the second could be used to ensure that the final data represented a cross-section of “public vs. parochial school parents; union vs. nonunion voters; Blacks vs. Caucasians; home owners vs. renters; the childless vs. those with school-age children; and other pertinent categories.”Footnote 103 Though it failed to garner a mention in either the Vindicator or the Buckeye Review, the final report offered the most complete and compelling account of the heart of Youngstown’s levy crisis. Nothing in the study, the authors noted, demonstrated “organized resistance against the school tax levies”—“no evidence of a ‘white backlash’” or a “concerted Negro opposition.” Fifty-nine percent of blacks said they voted for the levy, while 53 percent of whites did, and on a range of specific school and community issues the study found that “the attitudes of the Caucasians and Negroes were quite similar.”Footnote 104 The survey also debunked the notion that the levy defeats represented an antigovernment backlash. Only 15 percent of respondents felt that either teachers or nonteaching staff, such as janitors, made too much money. Instead, the study placed pocketbook concerns at the center of the levy defeats. “Resistance [to the levy] was due primarily to rejection of increased taxes,” the study concluded. The “rejection of increased taxes,” however, was not evenly distributed among the city’s economic classes. Both waves of the survey found a clear income-based patter to voting, which would subsequently be confirmed by studies in other states and national data. The lower one’s income, the less likely he or she was to vote for the levy (Figure 3). Those for whom an increase in the regressive property tax represented an economic squeeze were the ones who defeated the levy.Footnote 105

Fig. 3. Youngstown State University’s comprehensive survey showed that most armchair theories of the levies’ defeats were incorrect. Income, not race or ideology, drove opposition to the levies.
Although, in retrospect, the pocketbook roots of Youngstown’s levy defeat seemed clear, more and more cities would find themselves in Youngstown’s positions and would, likewise, find themselves searching for answers and ways to quell to the tax revolt.
From Local Shame to National Crisis
Just as Youngstown’s revolt ended, other Ohio cities became engulfed in their own school finance crises. Despite the good news from Youngstown, the executive secretary of the Ohio Education Association dubbed May 5th “black Tuesday,” because less than half of the 181 tax and bond proposals on ballots around the state were approved, a record low in Ohio’s history. In Parma, a Cleveland suburb, voters rejected a levy for the third time in six months, despite threats that the schools would close.Footnote 106 In Columbus, voters defeated a school bond issue for the first time in thirty years. In Freemont, levy defeats forced a seven-week “recess.”Footnote 107 Every election, it seemed, marked a new low. By the end of 1970, the previous year’s record was eclipsed, as Ohio voters approved just 29 percent of proposed school-tax levies.Footnote 108 In 1971, sixty-seven districts put previously defeated school issues back on the ballot, including seventeen that were being presented to voters for the fourth time or more. Twenty-five schools also applied to the state auditor’s office for a special audit, the first step toward closing the schools.Footnote 109
States across the country experienced their own property tax revolts in the late 1960s as well.Footnote 110 By the time a Wall Street Journal reporter dubbed the national epidemic of school levy and bond rejections a “taxpayer revolt” in late 1968, the phrase had already become a cliché.Footnote 111 One report that year that found that at least 150 school systems across the country had recently experienced a budget crisis.Footnote 112 The tally was staggering, and it included communities with little in common besides a financial crisis. For the first time in nineteen years, wealthy Grosse Point, Michigan, rejected a tax proposal, and it did so by a two-to-one margin. In New Jersey, a state-record 145 school budgets were rejected. In California, over half of all local spending referenda went down to defeat “and the percentage [was] rising every year.”Footnote 113 The situation had become so dire in 1968 that U.S. Commissioner of Education Harold Howe II, took to the pages of Parents magazine to plead for votes. In an article titled “Why You Should Vote ‘Yes’ on School Bond Issues,” Howe despaired over the “disturbing trend” of school finance referenda failures and called on parents to do their part to stem the tide.Footnote 114 But Howe’s pleading changed little. As a U.S. News and World Report explained, the “taxpayer revolt ke[pt] on rolling” in 1969.Footnote 115 As the number of local tax revolts mounted, it became clear that Youngstown’s experience was “pattern-setting rather than exceptional,” as the Christian Science Monitor put it.Footnote 116
Though few states kept comprehensive records on the fate of local school finance initiatives, data from those that did revealed a clear pattern. In states from Ohio to California, approval rates for levies and bonds had been falling since the late 1950s. The same occurred in states such as New Jersey, where school districts submitted school budgets to voters each year (Figure 4).Footnote 117 By 1970, even the White House was taking notice. At a March 1970 legislative meeting, Daniel Patrick Moynihan made a presentation to President Richard Nixon and his advisers that included a chart showing the success rate of local school bond initiatives with the striking title “SCHOOL BOND DEFEATS HAVE INCREASED 70% IN FIVE YEARS.” According to the national bond data presented by Moynihan, bond approval rates exceeded 70 percent in the early 1960s but had fallen into the low 40 percent range by 1970.Footnote 118

Fig. 4. Both state and national data showed the collapse of school levy and bond approval rates between the 1950s and the late-1960s.
Yet while the extent of the tax revolt was crystal clear by the early 1970s, understanding of its causes continued to elude commentators and local policymakers. The Wall Street Journal referred to “the lesson of Youngstown.” But the Journal, like most observers, did not seem to know what the lesson was. Local finance initiative defeats “undoubtedly stem[med] partly from a general voter reluctance to approve new local taxes at a time when inflation and higher federal and state taxes already are pinching family budgets,” the Journal concluded, before going on to speculate that “the reasons for the rebellion run deeper,” including “white voter reactions against demonstrations by Negroes.”Footnote 119 While the overlooked “Community Attitudinal Survey” only supported the former conclusion in Youngstown, academics and civic boosters across the country undertook their own studies to identify and explain the typical antilevy or antibond voter.
Before the 1960s, few examinations of the dynamics of local finance elections even existed, but by the mid-1970s they were a growth industry.Footnote 120 Crucially, most of the studies undertaken in the 1960s and 1970s assumed that “no” voters were white. In doing so, many studies of levy defeats echoed explorations of white working-class “authoritarianism” and “alienation” among George Wallace’s voters.Footnote 121 But this assumption was mistaken. National polling done by Gallup for the journal Phi Delta Kappan showed that, as in Youngstown, “non-white” Americans supported local school finance initiatives at rates nearly identical to whites (Figure 5). However, this reality conflicted with both popular stereotypes about African Americans’ relationship to the state, which saw blacks as benefit recipients rather than “taxpayers,” and flawed previous research, which claimed that blacks overwhelmingly supported finance referenda because of their disproportionately high levels of “public-regardingness.”Footnote 122 What such assumptions missed was the fact that the combination of racial- and income-based discrimination in the property tax meant that African Americans were most likely to face ruinous property-tax bills, a pocketbook reality that overwhelmed blacks’ partisan affiliations and pro-government attitudes.Footnote 123 In nearly every city examined in a 1973 congressional study, “blighted” neighborhoods—which were disproportionately black—paid the highest effective property tax rates, and in the most unequal cities the average tax in “blighted” neighborhoods could be as much as ten times higher than the rates in “upward transitional” neighborhoods.Footnote 124

Fig. 5. Despite persistent beliefs that African American and other “non-white” voters were more likely to approve of local finance initiatives, national Gallup polling, like the Youngstown survey, revealed scant evidence for that theory.
Ultimately, the local tax revolt was driven by discontent with the level and distribution of the tax burden, not the amorphous alienation or racial backlash cited by many local officials and social scientists. By the late 1960s, lower- to middle-income Americans across the country had good reason to resent the property tax. An ACIR study of local property tax burdens found that local property tax could eat up over 16 percent of poor homeowners’ incomes, between 4 and 7 percent middle- or working-class homeowners’ incomes, and less than 3 percent of rich homeowners’ incomes. The committee concluded that “no other major tax in our public finance system bears down so harshly on low-income households, or is so capriciously related to the ability to pay taxes.”Footnote 125 In another report, the ACIR warned that “heavy pressure on property and consumer levies poses sharp equity and fiscal problems.”Footnote 126 Given the twin pressures on residents pocketbooks and policymakers budgets, the committee predicted that “unless the subsistence of low-income families is shielded from the reach of property and sales tax collectors, the productivity of these powerful revenue instruments is bound to be jeopardized by growing public protest. The demand of elderly homeowners for property tax relief is becoming especially strident, and public opposition to bond issues is becoming more apparent.”Footnote 127
Nationally, as in Youngstown, the taxpayers’ revolt against school levies and bonds was inextricably linked to income. Those with the lowest “ability to pay” were saying “no” to more regressive taxation. The Gallup/Phi Delta Kappan polls found that opposition to local school finance referenda was a direct reflection of income. Low-income people opposed levies, while high-income people supported them (Figure 6). The Gallup/Phi Delta Kappan surveys also confirmed the conclusion reached by the Youngstown survey and other local studies that the revolt was not rooted in conservative antigovernment sentiment. Less than 10 percent of Americans surveyed by Gallup felt teachers were being paid too much.Footnote 128 Instead, studies revealed that lower-income voters worried more than upper-income voters that their tax bills would become “excessive” if school finance measures passed.Footnote 129 The income-based pocketbook squeeze was driving the revolt. As property taxes went up, voters’ willingness to approve levies and bonds went down. As a joint Ford Foundation/RAND Corporation study of 1,600 California school tax elections held from the mid-1950s through the early 1970s concluded, “We can say with confidence that the proposed tax rate and the increase in tax rate are the strongest and most consistent correlates of tax election passage.” To test the significance of tax rates on approval rates, a Ford/RAND study attempted to predict the percent of “yes” votes a levy would receive using only a district’s change in tax rates, household income, and turnout. This simple model, ignoring all demographic and political variables, predicted the approval level with surprising accuracy.Footnote 130

Fig. 6. Like the Youngstown study, the nationally Gallup survey found a clear link between respondents’ income and their willingness to vote for local property tax hikes.
While the efforts of left grassroots activists, such as Ralph Nader and the aforementioned George Wiley, would eventually bring the pocketbook-centered interpretation of the tax revolt to wider attention, few local officials or academics understood the distributional roots of the tax revolt in the late 1960s.Footnote 131 Instead, local officials faced with seemingly implacable, possibly alienated, and irrational levy opponents attempted to shift voters’ opinions on finance measures anyway they could. Though Youngstown’s pro-levy campaigns may have seemed excessive to many observers at the time, by the late 1960s, extensive levy campaigns like the one waged in Youngstown became the norm.Footnote 132 A flood of reports and handbooks explained to school officials how to pass initiatives in the face of the taxpayers’ revolt. With titles like “Four Things to Do When the Public Votes No,” “Get the Taxpayers on Your Team,” and “Take These Six Steps to Pass a Bond Issue,” this new school finance literature ignored structural issues like the level and mix of taxes and instead argued that with better campaign strategies and improved public relations school measures might once again find favor with voters.Footnote 133
These surprisingly data-free “how to” guides treated as fact the common assumption that working-class whites were a referenda’s worst enemy and that African Americans were a referenda’s best friend. They advised local officials to focus on mobilizing the “large reservoir of potential pro-voters” comprised of women and blacks, while appeasing or demobilizing “white, working class, residents of single dwellings, with moderate or low incomes.”Footnote 134 Insofar as local officials needed to rely upon “alienated” whites, the manuals encouraged local officials to downplay the cost of the levy or bond by mentioning the smallest amounts possible—discussing weekly or daily, rather than yearly, tax totals.Footnote 135 Avoiding numbers altogether was even better. “Graphs, charts, tables—these hold little interest for the bridge devotee, the factory worker, the housewife, or many professional people,” one guide explained.Footnote 136 But as some local officials discovered, these patronizing appeals were often counterproductive. One teacher canvassing an area with low educational levels in Columbus, Ohio, “tried to achieve rapport by using the language of the people.” But this stab at affability backfired. As one parent explained, “That man who came down here to talk to us talked so bad and seemed so stupid that we figured if he was educated, we didn’t want our kids to have none of it.”Footnote 137
In keeping with the white backlash theory of the revolt, many observers believed that the tax revolt would stay contained to urban areas. But the eroding tax bases and maxed-out “tax efforts” that crippled urban centers like Youngstown began spreading outward to suburbs and rural communities.Footnote 138 “The older suburban communities are taking on physical, social, and economic characteristics similar to the central city’s … [and they] are neither uniformly affluent nor free of fiscal woes,” one 1968 study explained.Footnote 139 “[H]igh local tax burdens can crop up in individual communities under a variety of different economic circumstances,” another study concluded.Footnote 140 By the late 1960s and early 1970s, many white suburbs were facing serious financial crises. When four suburban districts north of St. Louis closed their doors to 46,000 students in 1970, the New York Times noted with surprise that all were “predominantly white, middle-class districts.” The state had recently considered an income tax to help relieve the local property-tax burden, but rural voters defeated the measure, while it carried in suburban areas like Ferguson-Florissant. “If the state money had come through,” Ferguson-Florissant superintendent Warren M. Brown said, “we wouldn’t have had to ask for a local tax increase.” Brown also blamed rising inflation, which he said both drove up school costs and hurt residents’ pocketbooks, making them less likely to support finance measures.Footnote 141 In nearby Hazelwood, one senior girl mused, “I never thought we’d have to campaign to stay in school, but we’ve been parading, ringing door bells, and talking with older folks … to get them to approve a tax.”Footnote 142 Urban problems could be ignored. Suburban ones could not. “Now that fiscal crisis has come to suburbia, the land of milk and honey,” one study quipped, “perhaps drastic financial reforms—reforms long urged by schoolmen from bankrupt cites and impoverished rural areas—will at last be engaged by sluggish, shortsighted state legislatures.”Footnote 143
Eventually, further studies would undermine the few remaining psychological and cultural explanations of the revolt. The revolt began with education finance, which made sense given that local school taxes accounted for the majority of state and local property-tax collections in the late 1960s.Footnote 144 But time would reveal that the revolt was not limited to urban schools and all their attendant political controversies. Eventually, research would show that approval of all municipal bonds—including infrastructure bonds—began a downward slide in the 1950s that accelerated through the 1960s.Footnote 145
The tax revolt, it seemed, was really about the distribution of the tax burden.
From Youngstown to Prop 13
Between the late 1960s and early 1970s national policymakers’ views on the tax revolt shifted markedly. In 1968, the Johnson administration’s Commissioner of Education, Harold Howe II, flatly rejected appeals for federal intervention into local finance. Instead, he called on “citizens in every community to accept the responsibility for the quality of their schools.”Footnote 146 Hoover Institution economist Roger Freeman—who would serve as a local finance expert in both Nixon’s administration and Ronald Reagan’s gubernatorial administration—likewise dismissed public complaints about the unfairness of the property tax.Footnote 147 As the 1972 elections approached, however, leaders in both parties began to recognize the necessity of aiding states and localities stung by the revolt as well as the political advantage to be had in relieving taxpayers of the property tax’s regressive burden.
Nearly every candidate in the 1972 Democratic primaries made tax inequities, in general, and property taxes, in particular, key issues in their campaign. Both Edmund Muskie and George McGovern ran television ads offering sympathy to the agitated taxpayers who were voting down local tax measures and pledging progressive property tax relief if elected.Footnote 148 Democratic candidates had been pushed to address the property tax issue by progressive activists such as Ralph Nader, whose newly created Tax Reform Research Group uncovered what Nader called in a letter to Muskie a “national scandal of corruption” that cost local governments $6 billion annually, largely due to preferential assessments for industrial property.Footnote 149 “If all taxpayers were to bear their proper share of the tax burden, taxes on residential and small business property could be decreased as much as 25 percent,” Nader said.Footnote 150
President Nixon had noticed the revolt, too. By 1971, Nixon reelection campaign officials were pointing to “all the schools that have closed in the last two years” and arguing that property taxes were an “all-important” political issue in states like California.Footnote 151 John Ehrlichman worried that “the tax issue is being forced upon us” by Democrats and activists like Nader, and Chuck Colson urged the administration “to make this issue ours before Muskie or someone else really seizes upon it.”Footnote 152 In response, Nixon shifted to the left on taxes, calling local property taxes “oppressive and discriminatory” in his 1972 State of the Union address and pledging to find ways for the federal government to cut them.Footnote 153 At the end of one property tax-themed Committee to Reelect the President television commercial, a voiceover intoned, “The president is determined to do something about property taxes. That’s why we need President Nixon now more than ever.”Footnote 154
Despite the bipartisan promise to address property taxes at the federal level, Watergate overtook all other issues following the election. “The property tax never really sort of got off the ground,” Lee Enfield, Muskie’s Intergovernmental Relations Subcommittee staff member, who dubbed herself “Miss Property Tax,” explained later. “We started to do it. We geared up to think about hearings. And Watergate came along and it just sort of subsumed everything, the Watergate hearings.”Footnote 155
After Watergate, the action on property tax reform shifted to the state level. In states such as California and Massachusetts, progressive groups affiliated with Nader, Saul Alinsky, and ACORN pushed policymakers to provide progressive property tax relief on the state level. Moderate Democrats such as Jerry Brown and Michael Dukakis had little interest in pursuing such reforms.Footnote 156 Meanwhile, conservative activists and Republican officials were more interested in tax reforms that aided businesses and upper-income individuals. Initially, voters rejected these conservative entreaties. In California, the man who eventually would make history with Prop 13, businessman Howard Jarvis, failed time and time again to gather enough signatures to qualify his tax initiatives for the California ballot.Footnote 157 In both 1968 and 1972, Los Angeles assessor Philip Watson succeeded in placing a tax-limitation initiative on the ballot. But opponents portrayed Watson’s proposals as handouts to the rich, and both lost by a better than two-to-one margin.Footnote 158 In 1973, Governor Reagan put his considerable political weight behind Proposition 1, a now-almost-forgotten proto-Prop 13 plan to cap California’s spending and slash taxes that was drawn up by a who’s-who of conservative intellectuals (including Milton Friedman, James Buchanan, William Niskanen, and Anthony Kennedy) and backed by deep-pocketed donors, such as Dart Industries, Standard Oil, and the California Chamber of Commerce.Footnote 159 It, too, went down to defeat. Polls showed that conservatives and upper-income voters had supported Prop 1, while the lower- and middle-income voters who were rejecting local school levies had opposed it.Footnote 160 Even antitax initiatives in more conservative states failed to find support. Arizona Representative Sandra Day O’Connor placed a Prop 1 clone on the Arizona ballot in 1973. But even in Barry Goldwater’s home state, voters defeated conservative tax limitation.Footnote 161 Yet another Prop 1-influenced initiative, Michigan’s Proposal C, failed in 1976.Footnote 162 Time and again, voters made clear to conservatives that opposition to regressive local school finance initiatives did not translate into support for regressive tax-limitation ballot measures.
The passage of Prop 13 in June 1978, however, seemed to create amnesia among observers who had followed the local tax revolt as it had unfolded in the preceding decades. “That angry noise was the sound of a middle-class tax revolt erupting,” Time wrote of Prop 13, “and its tremors are shaking public officials from Sacramento to Washington, D.C.” The newsweekly noted that “on the same Tuesday that Proposition 13 swept to victory, taxpayers in Ohio turned down 86 of 139 school tax levies, including emergency outlays designed to save public schools in Cleveland and Columbus from bankruptcy.”Footnote 163 What Time neglected to mention was that it had already christened the beginning of the revolt eight years earlier when covering the precipitous rise of levy failures in Ohio.Footnote 164
Republicans encouraged this amnesia by aggressively spinning the passage of Prop 13. They argued that Prop 13 marked a sudden shift to the right by average taxpayers and represented victory for the conservative vision of small government. In a speech just after Prop 13 passed, Reagan claimed that Prop 1 was “the beginning of the tax revolt,” representing an idea “whose time had not quite arrived” in 1973, but one that had finally emerged victorious with Prop 13.Footnote 165 Friedman likewise argued that Prop 13 was proof that “the populace is coming to recognize that throwing government money at problems has a way of making them worse, not better.”Footnote 166 Both Democrats and the press largely bought this spin. Echoing conservatives’ interpretation, Fortune magazine claimed that the voters who approved Prop 13 were “Voting for Capitalism,” while U.S. News and World Report explained that Prop 13 was a “message to city halls, state houses, and Washington, ‘Roll back spending and cut our taxes.’”Footnote 167 Buffeted by Republicans and the press, many Democrats acceded to the conservative interpretation of Prop 13, too. President Carter declared that Prop 13 “sent a shock wave through the consciousness of every public servant.”Footnote 168 Carter’s pollster, Pat Caddell, told the president, “This isn’t just a tax revolt. It’s a revolution against government.”Footnote 169 Because the Carter White House believed that California voters had embraced antigovernment conservatism, they rejection the suggestion—once embraced by both McGovern and Nixon—that the federal government should use its revenue to help California avoid drastic program cuts. “We should not willy-nilly replace state spending with federal spending,” OMB director James McIntyre warned Carter, “unless we are willing to ignore the message from the voters of California.”Footnote 170
Republicans moved quickly to capitalize on the moment. In September, thirty prominent Republicans, including Reagan, Jack Kemp, William Steiger, Bob Dole, David Stockman, and Alan Greenspan, staged what they called the “Tax Cut Blitz.” They grabbed national headlines by flying around the country in a jet dubbed the “Tax Clipper.”Footnote 171 At stops in seven states, the “Tax Blitz” team held rallies and gave speeches to drum up support for both the Kemp-Roth across-the-board income-tax-cut plan and a capital-gains-cut proposal authored by Steiger, a Wisconsin Republican.Footnote 172 Reagan and other Republicans argued that their “supply side” cuts were an extension of Prop 13. “What these Republican proposals in Washington have in common with Proposition 13,” Reagan said, “[is that] they show our party’s faith in the good sense of the American taxpayer.”Footnote 173 In response to the Blitz, congressional Democrats dropped their opposition to the Steiger bill, which gave the top 10 percent of taxpayers 90 percent of its cut. Carter, who had also previously opposed the bill, signed it into law, paving the way for Reagan’s regressive tax cuts three years later.Footnote 174 Within a few short months, conservatives had turned a California ballot initiative that had passed as a result of rising regressive taxes on low- and middle-income Americans at the state and local level into a justification for cutting taxes on the rich at the federal level, and their framing of the revolt would endure for decades to come.
But rising conservatism had not led to the passage of Prop 13; the arithmetic of the household budget had. As one Los Angeles Times headline put it, “Prop. 13’s Biggest Booster Was Inflation, Not Anger Against All Government.”Footnote 175 Prior to the 1970s, property values in California rose between 4 and 5 percent per year. Between 1958 and 1971, average property tax rates on FHA-insured single-family homes nearly doubled in cities like Los Angeles and San Francisco, according to the ACIR.Footnote 176 But that steady increase paled in comparison to what took place in the mid-1970s, when homeowners in California were routinely subjected to yearly assessment increases of between 10 and 15 percent. This was accompanied by a dramatic shift in the property tax burden from commercial and agricultural to residential property. Had Prop 13 not passed, property taxes on homeowners would have increased by 92 percent between 1975 and 1978 but only 14 percent on commercial, industrial, and agricultural property. By 1977, many middle-income Californians paid more than 10 percent of their income in property taxes.Footnote 177
This financial distress did not turn voters to the right, but it did make them more willing to overlook their objections to the distribution of the cuts contained in measures like Prop 13. Like Reagan’s Prop 1, support for Prop 13 increased with income. Unlike Reagan’s Prop 1, however, Prop 13 received enough support from low- and middle-income voters to pass.Footnote 178 But the moderates and liberals who reluctantly cast a vote for Prop 13 had not embraced conservatism. Even as they passed Prop 13, two-thirds of Californians said they opposed eliminating welfare because they believed “people really need” it.Footnote 179 Confounding the idea of a turn to the right even further, the same California voters who passed Prop 13 were also enacting a raft of progressive rent-control measures opposed strenuously by businesses and conservatives.Footnote 180 Californians’ seemingly paradoxical passage of Prop 13 and strong support for “big government” led some observers to surmise that Californians wanted “something for nothing.”Footnote 181 But the pocketbook squeeze caused by rising, regressive property taxes explained the paradox. As one progressive tax activist said after deciding to cast a vote for Prop 13, “I prefer [progressive tax reform], but I want to keep my home.”Footnote 182
Ultimately, Prop 13 was neither the beginning of the tax revolt nor an affirmation of the conservative vision of top-heavy tax cuts. Instead, Prop 13 was the logical outcome of the pocketbook-driven tax revolt that had begun in places like Youngstown more than a decade earlier, the causes of which had been left unaddressed ever since.