Introduction
Bauxites are rocks enriched in aluminum hydroxide minerals, such as gibbsite, böhmite and diaspore, formed in humid tropical to subtropical climates from the weathering of aluminosilicate-rich parent rocks (Bárdossy and Aleva, Reference Bárdossy and Aleva1990). Bauxite resources are estimated to be 55 to 75 billion tons, with reserves in Africa (32%), Oceania (23%), South America and the Caribbean (21%) and Asia (18%) (Bray, Reference Bray2016). Brazil has the third largest reserves of this ore (2.6 billion tons), after Australia (6.2) and Guinea (7.4), and is the third largest producer with an estimated amount of 35 million tons of bauxite mined in 2015 (Bray, Reference Bray2016). Around 97% of the Brazilian reserves are concentrated in the Amazon region, mostly on siliciclastic rocks (Lucas, Reference Lucas and A. Carvalho1997). Such reserves constitute important deposits, some in operation, as at Trombetas, Juruti and Paragominas (Costa et al., Reference Costa, Silva Cruz, Faria and Pöllmann2014) with others under investigation such as at Rondon do Pará (Oliveira et al., Reference Oliveira, Costa and Prazeres Filho2016).
The main restriction on bauxite mining in the Amazon region is the up to 25 m thick overburden made of yellowish clays, known as Belterra clay (Sombroek, Reference Sombroek1966), along with the difficult and costly chemical and mineralogical quantification of bauxites, particularly for determining available alumina and reactive silica using traditional wet chemistry methods. Those methods are relatively slow, require large amounts of chemical reagents and considerable space and handwork (Feret, Reference Feret2013).
Rietveld refinement (Rietveld, Reference Rietveld1969) using powder X-ray diffraction is considered a practical, fast and less expensive technique when compared to mineral quantification by traditional methods, and so has been an alternative route towards bauxite's mineralogical quantification. The refinement also provides crystal information to evaluate solid solutions, such as the Al-for-Fe substitutions in goethite and hematite, contributing to a better understanding of the chemical and micro-textural aspects observed in the Al-rich ore.
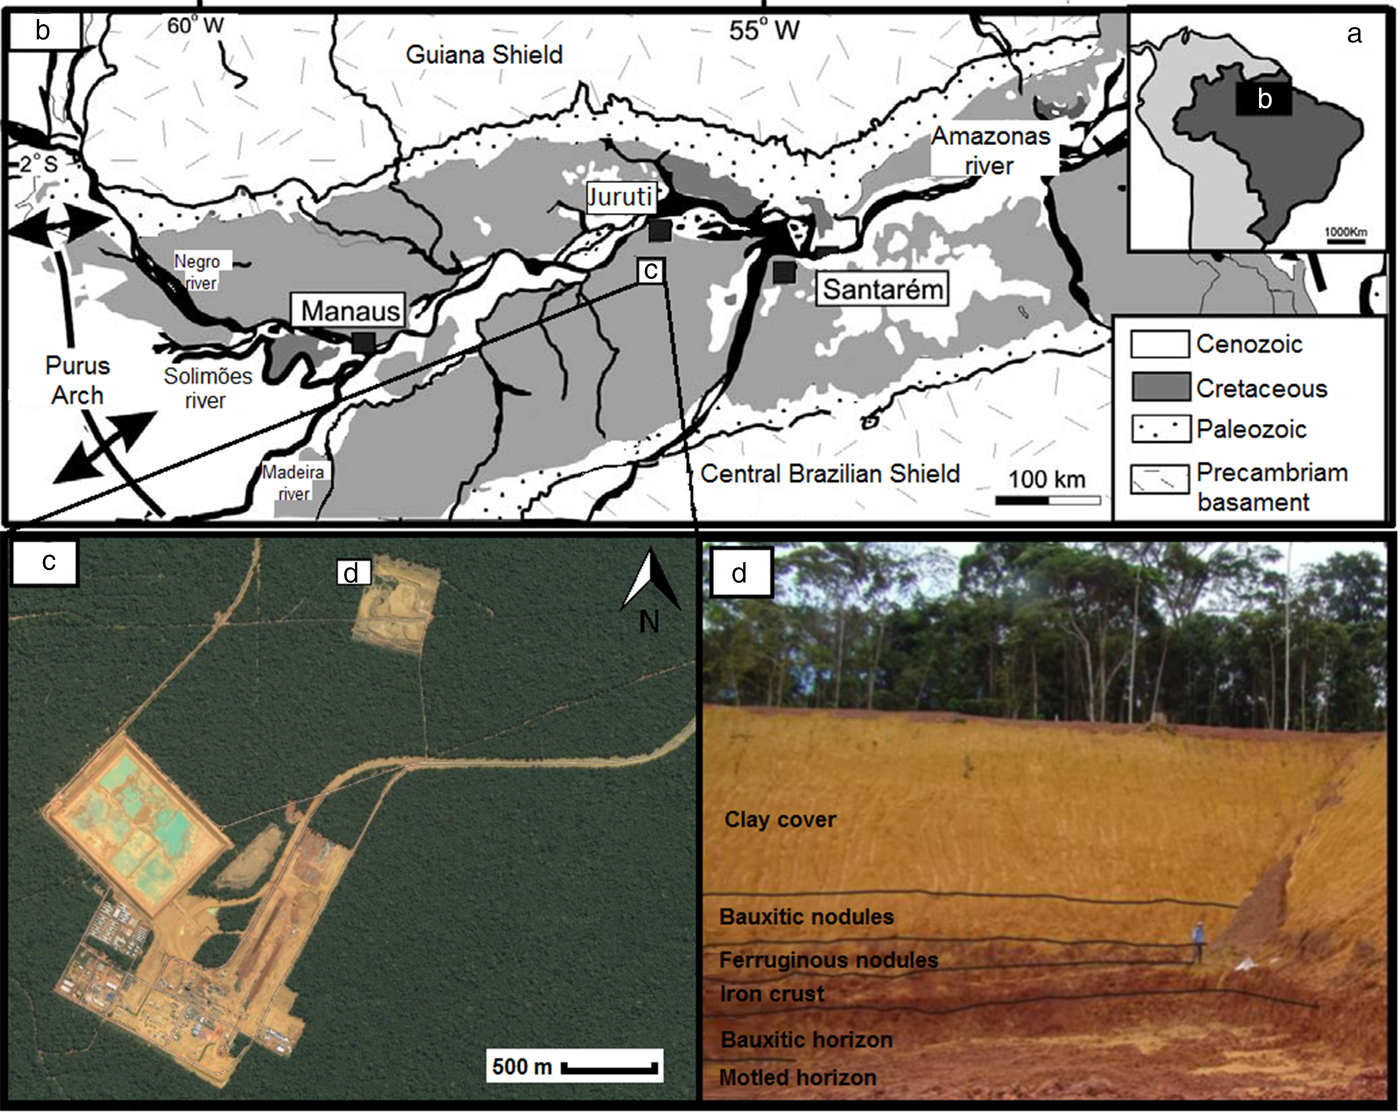
The bauxite deposit of Juruti is located in the Lower Amazon region (Fig. 1), in the northwest portion of the State of Pará, Brazil, ~200 km west of the city of Santarém, on the right bank of the Amazon River. Within the Juruti's ALCOA mine district, a bauxite-bearing regolith is exposed in a mining trench at the Capiranga Plateau (Fig. 1). The bauxites of Juruti developed on sedimentary rocks of the Cretaceous Alter-do-Chão formation (Costa et al., Reference Costa, Silva Cruz, Faria and Pöllmann2014), representing the deposition of continental sequences terminating sedimentation in the Amazon Basin (Silva et al., Reference Silva, Lopes, Vasconcelos, Bahia and Bizzi2003). Like most lateritic profiles in the Amazon, the bauxites of Juruti were formed in the Paleocene–Eocene with a new bauxitization phase in the Miocene, responsible for the yellowish clay cover (Belterra clay) formation, about 6–10 Ma ago (Costa et al., Reference Costa, Silva Cruz, Faria and Pöllmann2014).
Fig. 1. (a) General location of the area studied; (b) geological sketch map of the Amazon Basin with location of the bauxite deposits in Juruti; (c) ALCOA bauxite mine facilities in Juruti; and (d) strip mining bank in the Capiranga plateau with exposition of different horizons of the bauxite-bearing regolith, in yellow the clay cover (Belterra clay). Modified from Mendes et al. (Reference Mendes, Truckenbrodt and Nogueira2012) and Cruz (Reference Cruz2011).
The bauxite-bearing regolith, 23 m in depth (Fig. 1d), comprises a mottled horizon at the bottom with kaolinite, quartz and hematite; a central bauxitic horizon consisting mainly of gibbsite with kaolinite, hematite and anatase in minor proportions; an iron crust with dominant hematite and goethite; a horizon with ferruginous nodules and clayey matrix composed of hematite, goethite, gibbsite and kaolinite; a horizon with bauxitic nodules and clayey matrix where gibbsite turns into the dominant phase; and a clay cover horizon comprised mainly of kaolinite and goethite, with gibbsite, anatase and quartz in minor proportions.
Materials and methods
Thirteen samples were selected from a complete bauxite regolith and its clay overburden in the mine district of Juruti, studied previously by Cruz (Reference Cruz2011) and Costa et al. (Reference Costa, Silva Cruz, Faria and Pöllmann2014). The samples were described and studied under optical microscope, scanning electron microscope (SEM), X-ray fluorescence (XRF), powder X-ray diffraction (XRD) and thermal analysis. The analyses were made partly in the Institute of Geosciences of the Universidade Federal do Pará in Belém, Brazil, and in the mineralogical laboratories of the Martin-Luther-University Halle-Wittenberg in Halle, Germany. A Zeiss AXIOLAB POL optical microscope and JEOL JSM3600 scanning electron microscope were used for the micro-textural aspects of the study.
The grinding of the samples for XRD and XRF analyses was performed manually using a mortar and pestle to achieve fineness. After mineralogical characterization by XRD, the mineralogical quantification was performed by stoichiometry using chemical data determined by X-ray fluorescence (a SIEMENS SRS3000 spectrometer), by loss on ignition (LOI) and supported by thermogravimetric results. For the stoichiometry calculations the theoretical chemistry composition of the XRD-identified minerals was used: first by applying all the SiO2 to kaolinite; then the remaining Al2O3 to gibbsite; any remaining LOI to goethite; finally, the hematite was quantified with the Fe2O3 after goethite; and the entire TiO2 content was considered as anatase. In a sample of the nodular ferruginous horizon, the Rietveld quantified goethite content was considered as correct to enable the stoichiometric calculations. Mass loss from the different temperatures of dehydroxylation of the phases was also used to calculate gibbsite, kaolinite and goethite contents. For a precise stoichiometric content of goethite and hematite, their theoretical formula was calibrated after determination of their Al and Fe contents.
Approximately 10 mg of sample was heated in an alumina crucible using a heating rate of 10 K min–1 to perform thermogravimetric (TGA) and differential scanning calorimetry (DSC) in a thermal analyser NETZSCH STA 449 F3. The results were used to compare the mineral quantifications and determine temperatures of phase transitions.
Powder X-ray diffraction analysis for the Rietveld refinement was performed on an X´Pert Pro MPD (PW 3040/60) PANalytical diffractometer with CuKα radiation and a NiKβ filter. The diffraction patterns were acquired from 5° to 70.00° (2θ) at 0.01o steps, a counting time of 20 s per step, resulting in a 20 mins measuring time. The mineralogical characterization and the Rietveld refinement were carried out with the PaNalytical software HighScore Plus 4.5, supported by the PDF4 + 2012 relational database. Crystal-structure data were obtained from the FIZ Karlsruhe database to which the CAPES foundation provided access. Rutile from KRONOS® 2900 was added to the material (0.4 g amounting to 20%) as an internal standard for the amorphous content quantification.
The refinement was performed with automatic background determination with granularity ≈20. The scale factors, the lattice parameters and the profile parameter W were constrained for almost all minerals in the first steps of the refinement. The preferred orientation of gibbsite (002) and kaolinite (001) were refined for all the samples where these minerals represent the main phases.
Differences in intensity and even in some peak positions of the kaolinite in the clay cover compared to published structures of this mineral were broadly observed in the diffraction patterns. To perform a better profile fitting and quantification, a calibrated hkl phase model was produced for the kaolinites using the Le Bail fit method in the HighScore 4.5 package. The unit cell and space group of the structure of kaolinite in the International Crystal Structure Database (ICSD) code 63192 was used in the Le Bail fit. The calibration of the hkl file was achieved using a carefully refined diffraction pattern of the clay cover, with its kaolinite content determined by stoichiometry. The obtained hkl calibrated file was used in the refinement of all other kaolinite-rich samples.
Further crystal-structure data used in the refinement include the ICSD codes 6162 for gibbsite (Saalfeld and Wedde, Reference Saalfeld and Wedde1974), 109411 for goethite (Li et al., Reference Li, O'Connor, Low, van Riessen and Toby2006), 82137 for hematite (Sadykov et al., Reference Sadykov, Isupova, Tsybulya, Cherepanova, Litvak, Burgina, Kustova, Kolomiichuk, Ivanov, Paukshtis, Golovin and Avvakumov1996), 9853 for anatase (Horn et al., Reference Horn, Schwerdtfeger and Meagher1972), 83710 for rutile (Howard et al., Reference Howard, Sabine and Dickson1991) and 83849 for quartz (Norby, Reference Norby1997).
Results and discussion
Microscopy and micromorphology
Gibbsite occurs as the main phase in the bauxite-rich horizons (bauxite horizon and the horizon with bauxitic nodules) along the profile. It appears both in the fine matrix, associated with cryptocrystalline kaolinite and iron (oxy)hydroxide plasmas (Fig. 2) and, as well-shaped prismatic and tabular crystals along fissures and filled microvoids (Fig. 2).
Fig. 2. Microtextural aspects of the bauxite-bearing regolith. (a) Dissolution pore filled by gibbsite in a cryptocrystalline aluminium-rich matrix; (b) dissolution pores filled by goethite and gibbsite in a dark hematite matrix; (c) and (d) bauxite micro-texture with well-shaped gibbsite crystals in the fine gibbsitic matrix; (e) detail of ferruginous nodules with pores; and (f) sub-spherical hematite aggregates.
In the horizon with ferruginous nodules, remaining iron nodules are partially dissolved and involved with an external goethite cortex and ‘meso-gibbsite’ crystals in the inner part (Fig. 2). Those features associated with an Al-rich matrix with pores filled by gibbsite, indicate a partial aluminium remobilization through the regolith, probably associated with the dismantling of the iron crust as observed by Costa et al. (Reference Costa, Silva Cruz, Faria and Pöllmann2014). As a result, a cavernous texture is observed under SEM where sub-spherical hematite crystal aggregates and prismatic well-formed gibbsite crystals occur inside many of the secondary dissolution pores (Fig. 2).
The kaolinite is present along all the horizons of the regolith, being the dominant phase in the clay horizon and the clayey overburden, where it is characterized predominantly as nano-crystalline, forming micro aggregates associated with goethite and nano-anatase (Costa et al., Reference Costa, Silva Cruz, Faria and Pöllmann2014).
Chemical composition
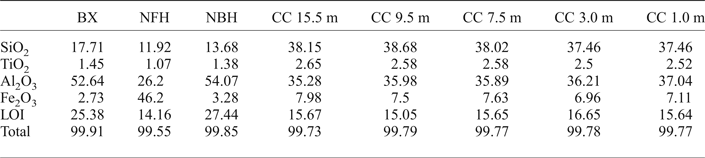
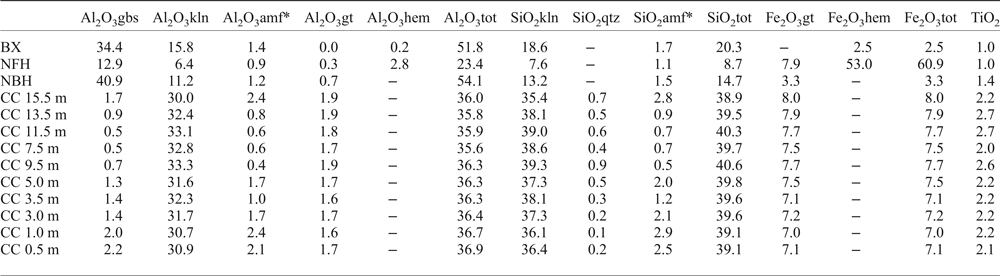
The bulk chemical composition of the bauxite bearing regolith in Juruti (Table 1) is similar to most of the bauxite deposits in the Amazon. The bauxite has characteristic high contents of alumina and considerable silica due to the presence of kaolinite. Iron is the main constituent of the nodular ferruginous horizon, where substantial Al contents still remain. High contents of SiO2 and Al2O3 in the clay cover are typical from Belterra clays of other localities, with a quasi-homogeneous composition, while TiO2 contents increase gradually upwards through the profile.
Table 1. Content of the major chemical element oxides (wt.%) and Loss on Ignition (LOI) in the bauxite-bearing regolith sequence of the Juruti mine.
BX: bauxite; NFH: nodular ferruginous horizon; NBH: nodular bauxitic horizon; CC: clay cover.
Mineralogical composition by Rietveld refinement and stoichiometry
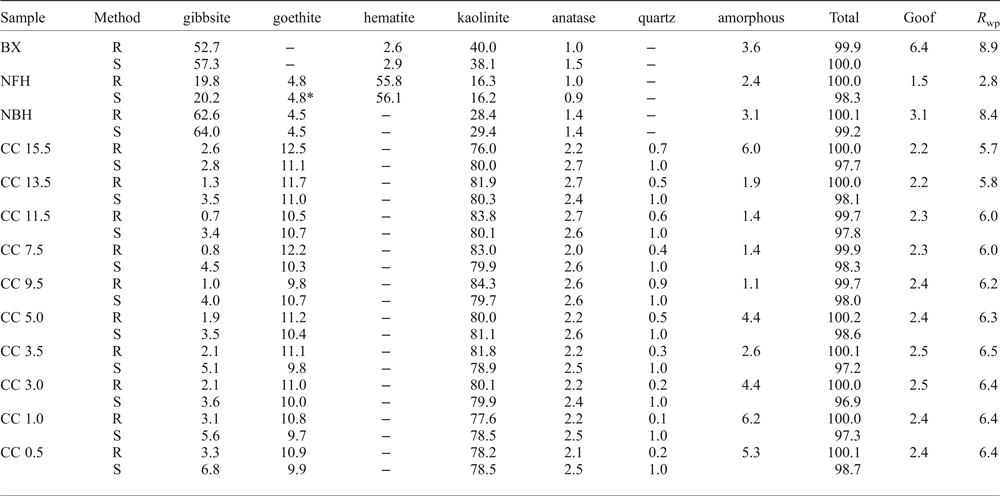
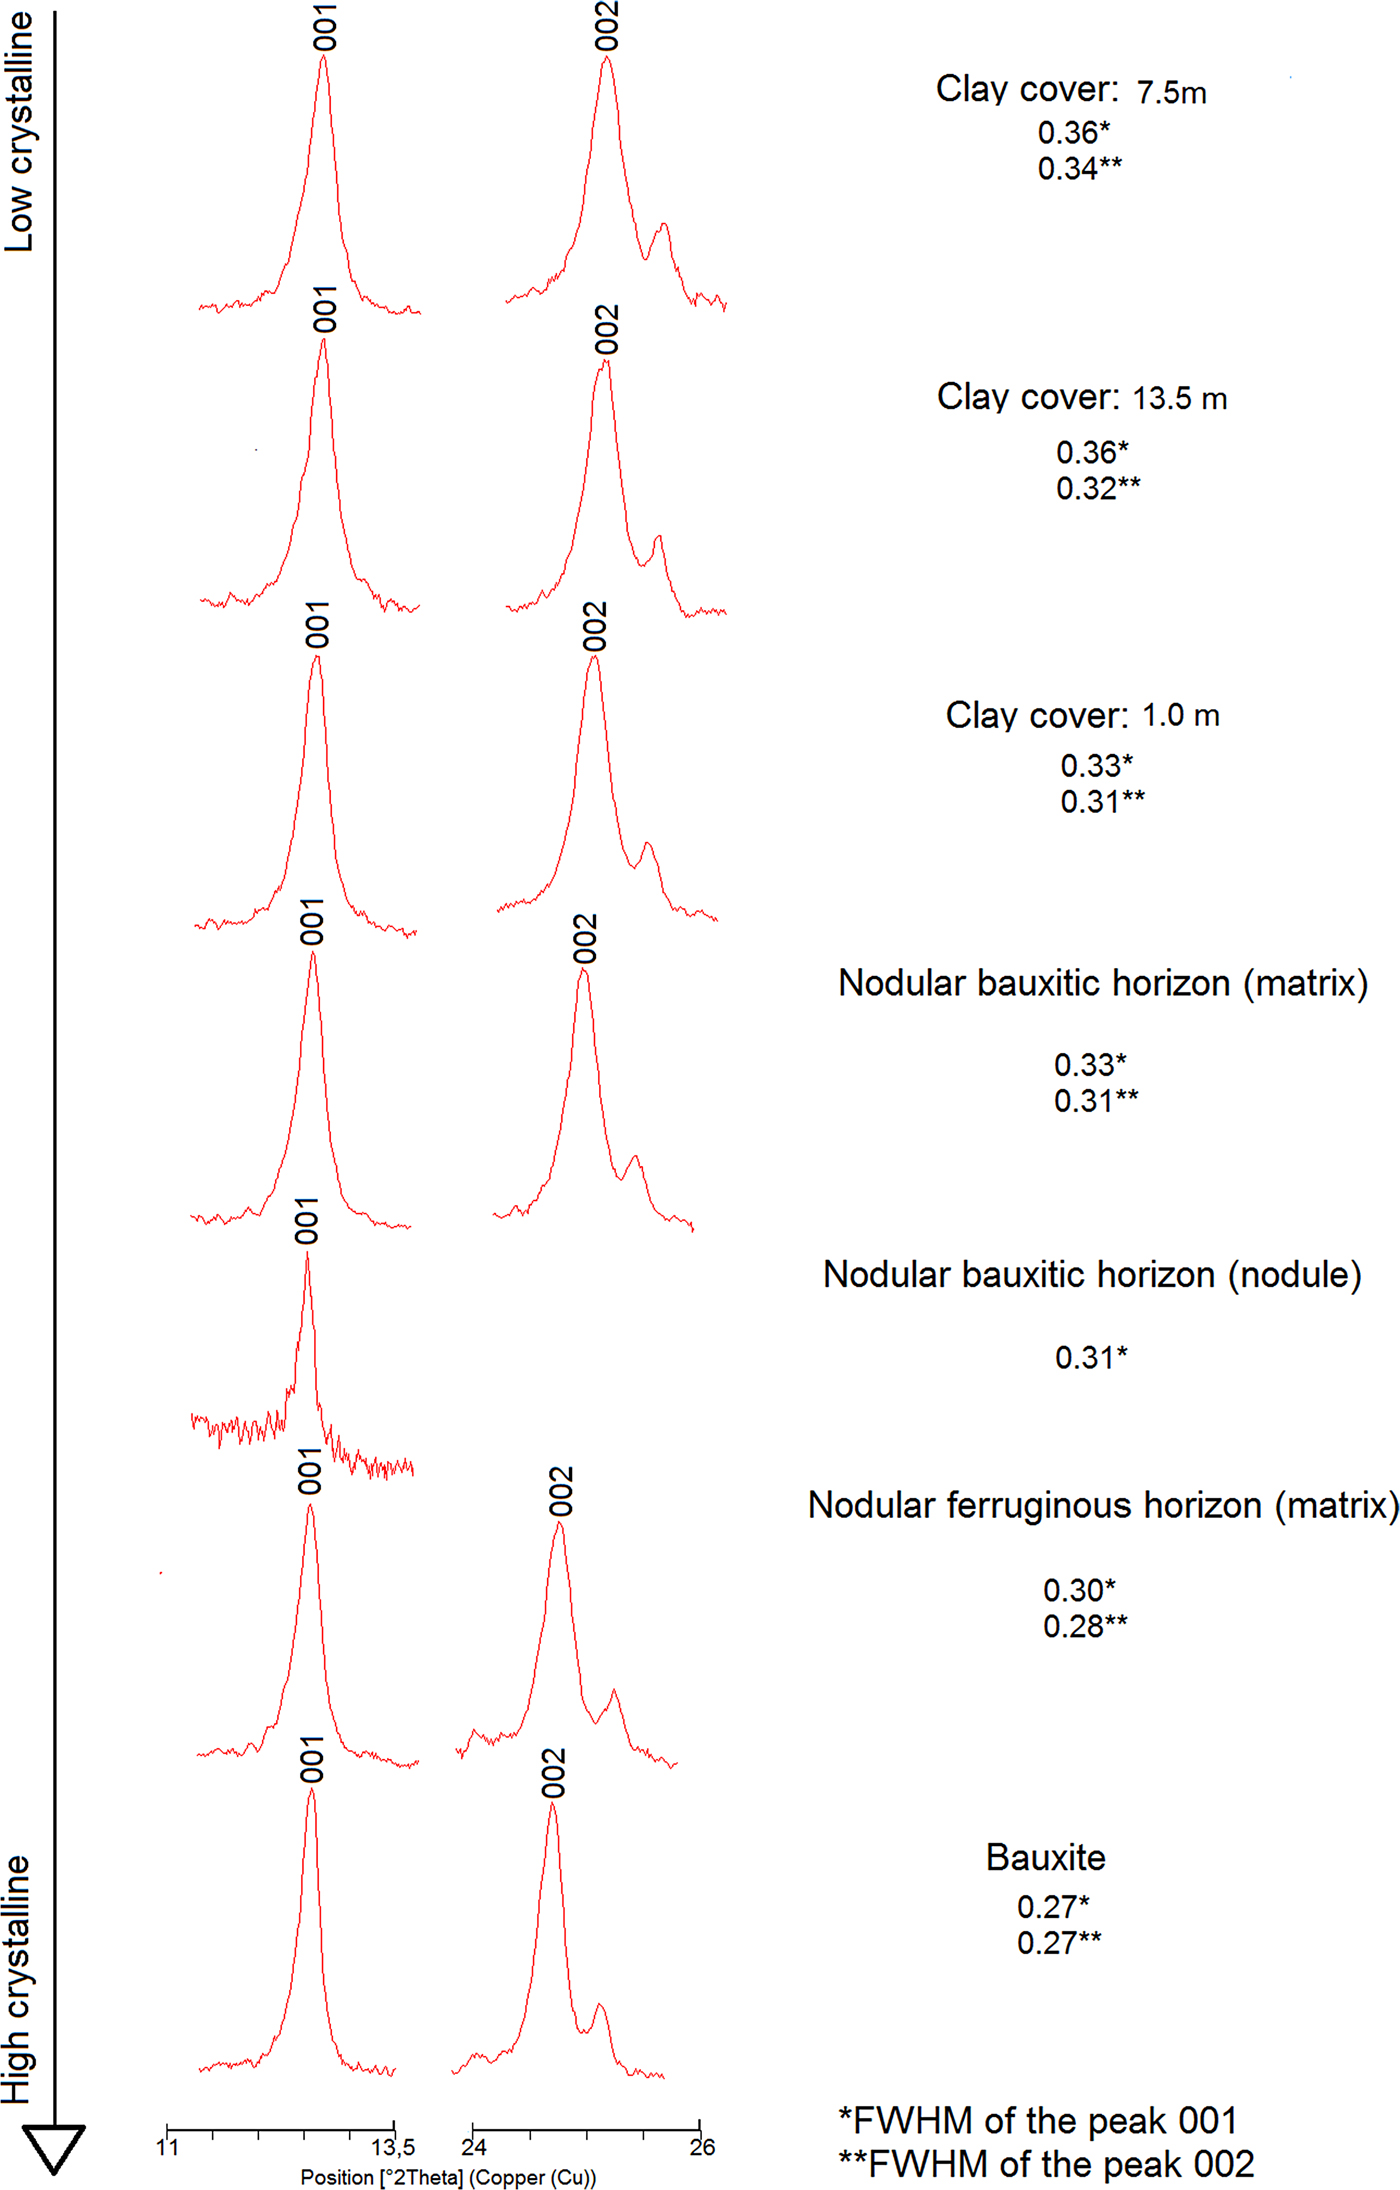
The Rietveld results displayed in Table 2 and compared with the stoichiometric calculations shows that gibbsite, kaolinite, goethite and hematite are the main minerals. Gibbsite is the major constituent of bauxite, being less frequent in the iron crust and its ferruginous nodules, and an accessory in the clay cover. Hematite and goethite are, as expected, the most abundant minerals of the iron crust and its dismantled products, while in the clay cover kaolinite and goethite prevail. According to XRD at least two generations of kaolinite can be recognized: a residual kaolinite and a newly-formed kaolinite that is very fine, nano-scale crystals and is concentrated in the clay cover.
Table 2. Average of the triplicate of all the mineral quantification by the Rietveld refinement (R) and stoichiometric (S) results along the regolith sequence.
BX: bauxite; NFH: nodular ferruginous horizon; NBH: nodular bauxitic horizon; CC: clay cover; Goof: Goodness of fit; R wp: R-weighted profile. * – Rietveld calculated content for goethite.
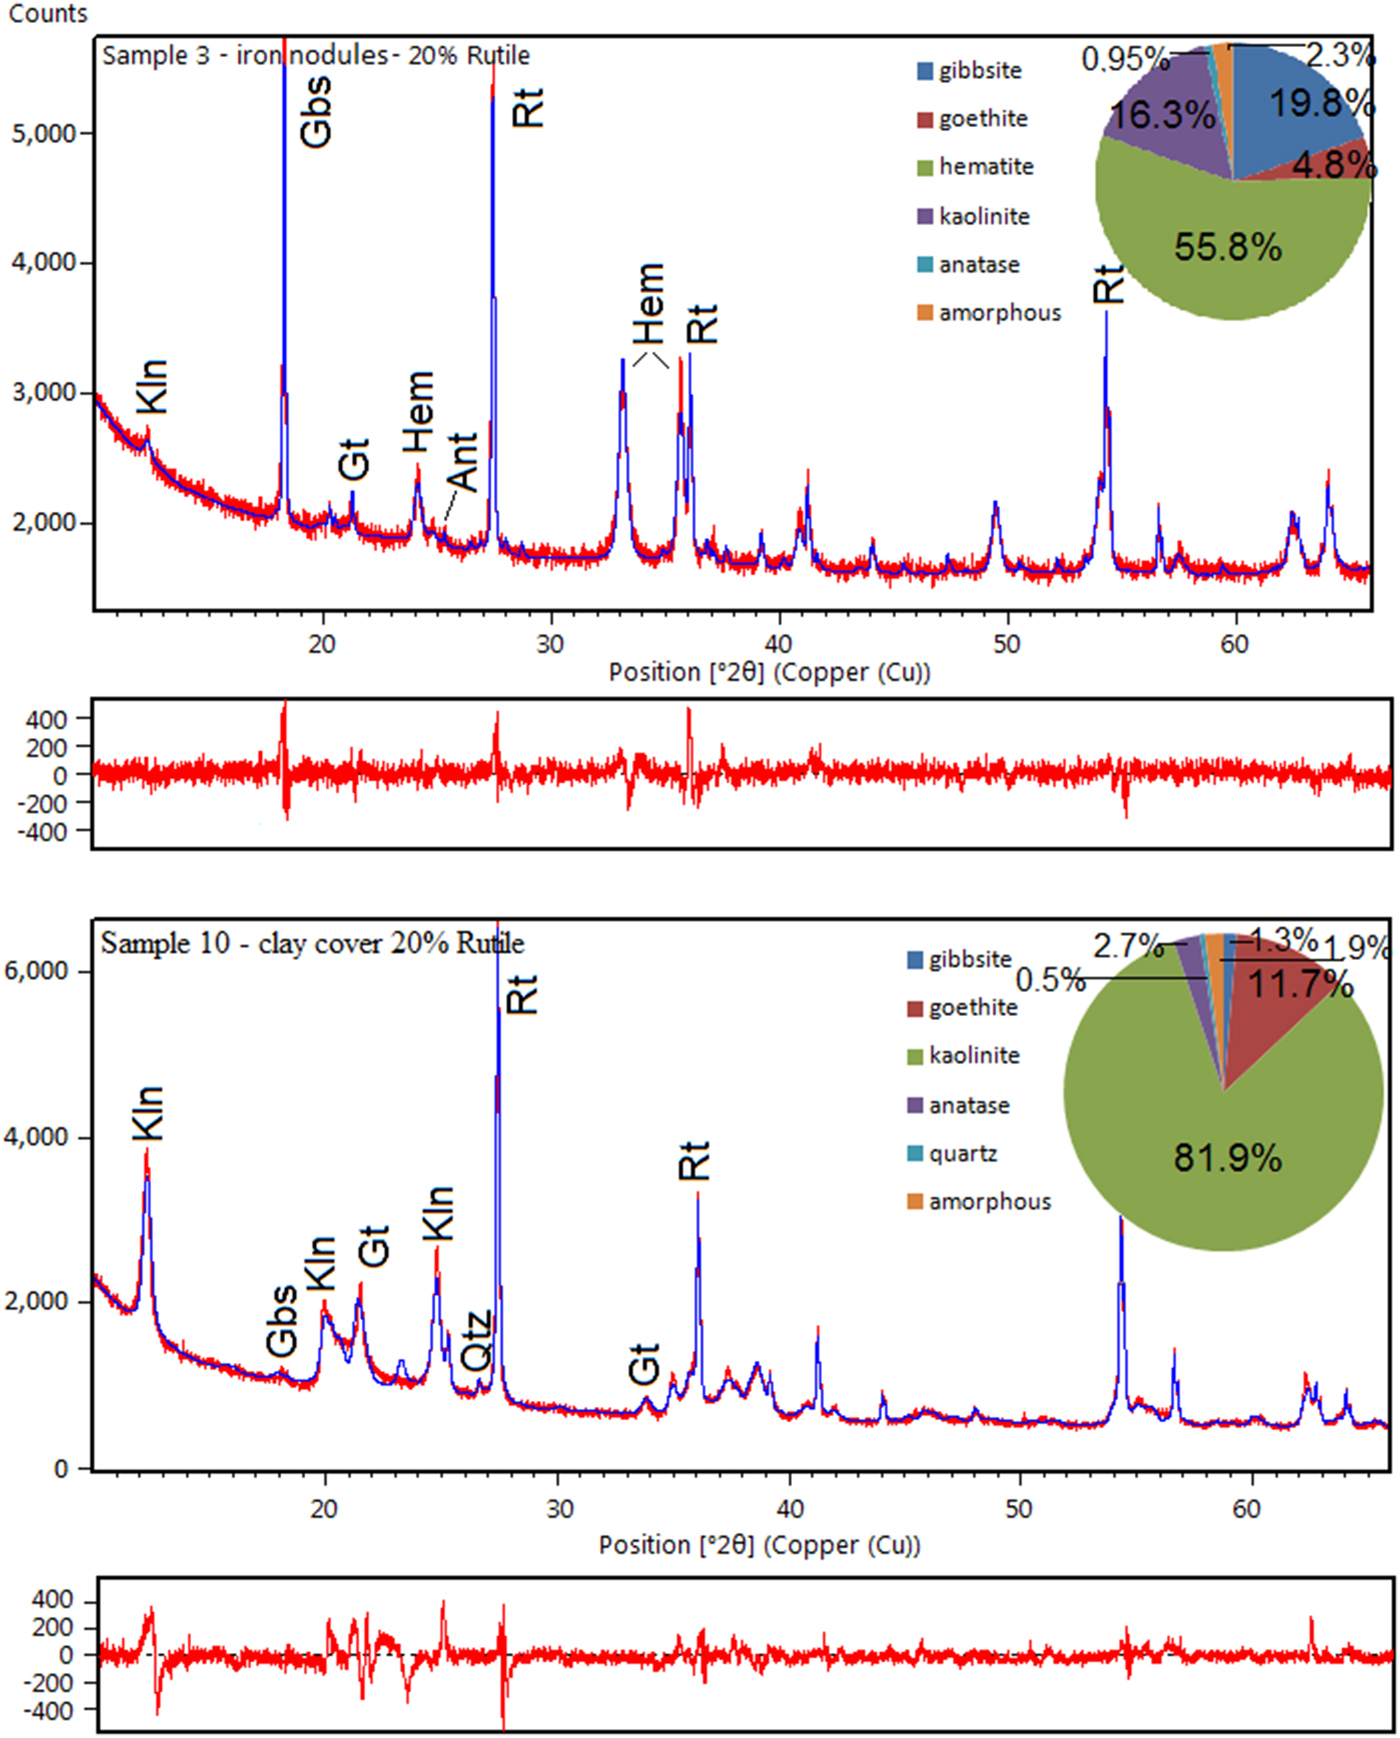
The average of triplicate mineral quantification using Rietveld refinement of the complete profile, with Goodness-of-Fit (Goof) and R-weighted pattern (R WP) values, followed by the stoichiometric results are shown in Table 2. Despite the good agreement obtained between the measured profile and the Rietveld calculated pattern (Figs 3 and 4), some peak overlaps influenced the performance of the calculations.
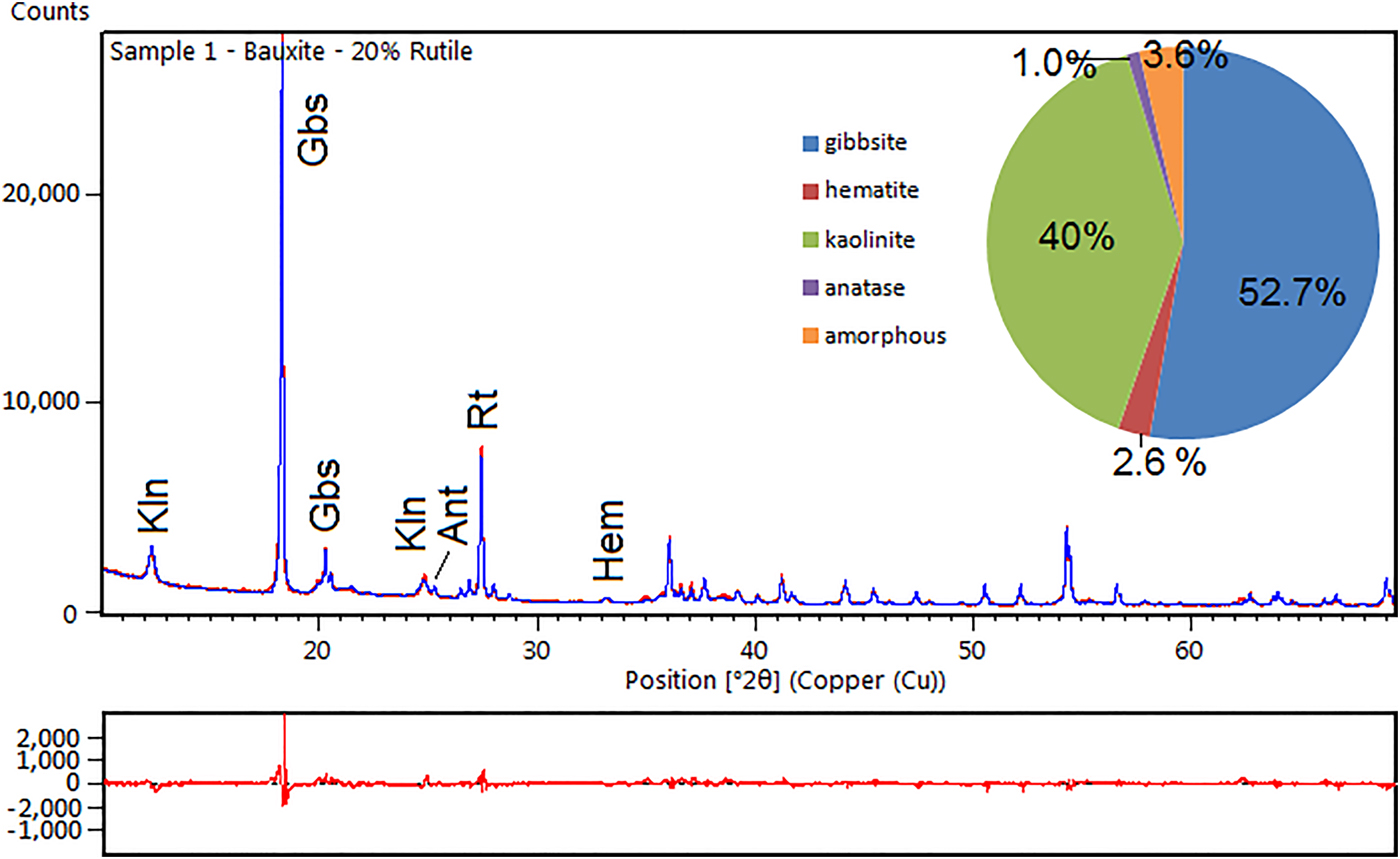
Fig. 3. XRD diagram and difference plot of a refined bauxite sample. Kln – kaolinite; Gbs – gibbsite; Ant – anatase; Rt – rutile (internal standard); and Hem – hematite.
Fig. 4. XRD diagrams and difference plots of a refined pattern from the ferruginous nodules and a refined pattern from the clay cover. Kln – kaolinite; Gbs – gibbsite; Ant – anatase; Rt – rutile; Hem – hematite; Qtz – quartz; and Gt – goethite.
When compared to the stoichiometric calculation the most important difference was the amorphous phases. After the Rietveld refinement the bauxitic horizon consists predominantly of gibbsite (52.7%) and kaolinite (40%), with 2.6% hematite and 1.0% anatase. The calculated amorphous content reaches 3.6%.
In the nodular ferruginous horizon, hematite (55.8%) and gibbsite (19%) are the main minerals, with kaolinite reaching 16.3%, goethite 4.8% and anatase 0.95%. The calculated amorphous content is 2.35% indicating, according to the chemical analysis (Table 1), that the amorphous materials should be mostly iron (oxy)hydroxides.
The horizon with bauxitic nodules has gibbsite as the main phase representing 62.6% of the mineral content, whereas kaolinite reaches 28.4%, goethite 4.5% and anatase 1.4%. The amorphous content is 3.1%. According to the chemical analysis the amorphous material might consist of strongly disordered phases like aluminium hydroxides and hydrous aluminosilicates.
With the greatest amounts of kaolinite (76.0–84.3%), the samples of the clay cover horizon were refined using an hkl model of kaolinite. The goethite and anatase contents are also higher in these samples, reaching 12.5% and 2.7%, respectively, whereas gibbsite occurs subordinately (up to 3.3%) and the amorphous contents range from 1.1 to 6.6%.
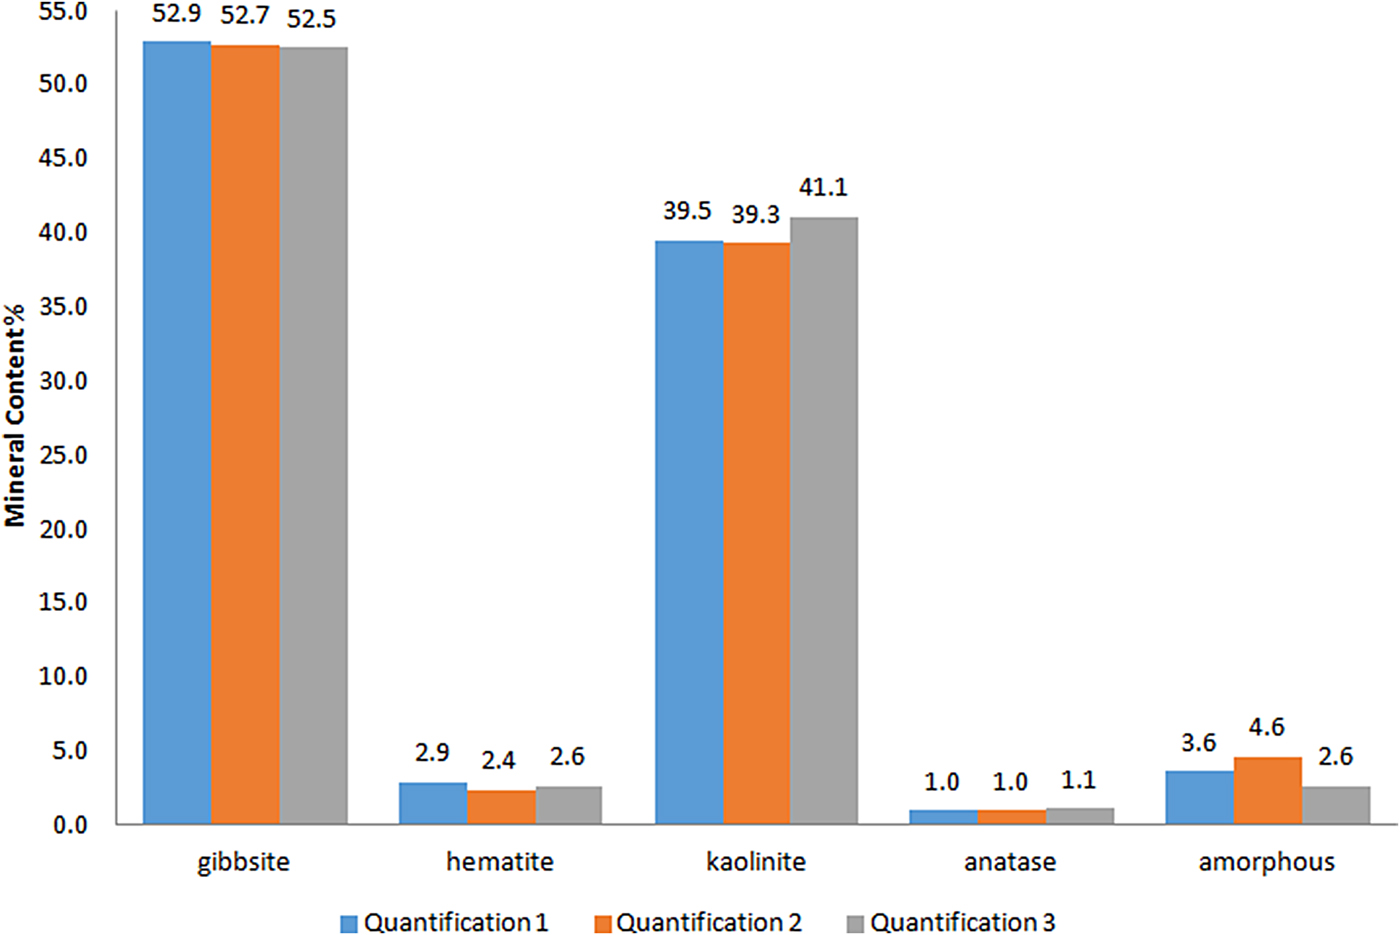
The statistical indicators Goof and R wp are considered the best indices to evaluate the refinement (Toby, Reference Toby2006) and are given in Table 2. The reproducibility of the method was tested by preparing, measuring and refining each sample in triplicate. The refined diffraction patterns show no significant discrepancies, attesting to good reproducibility of the method (Fig. 5).
Fig. 5. Comparison of the results of the Rietveld refinement quantification in triplicate (Quantification 1, Quantification 2 and Quantification 3) for a bauxite sample.
DSC and TGA results
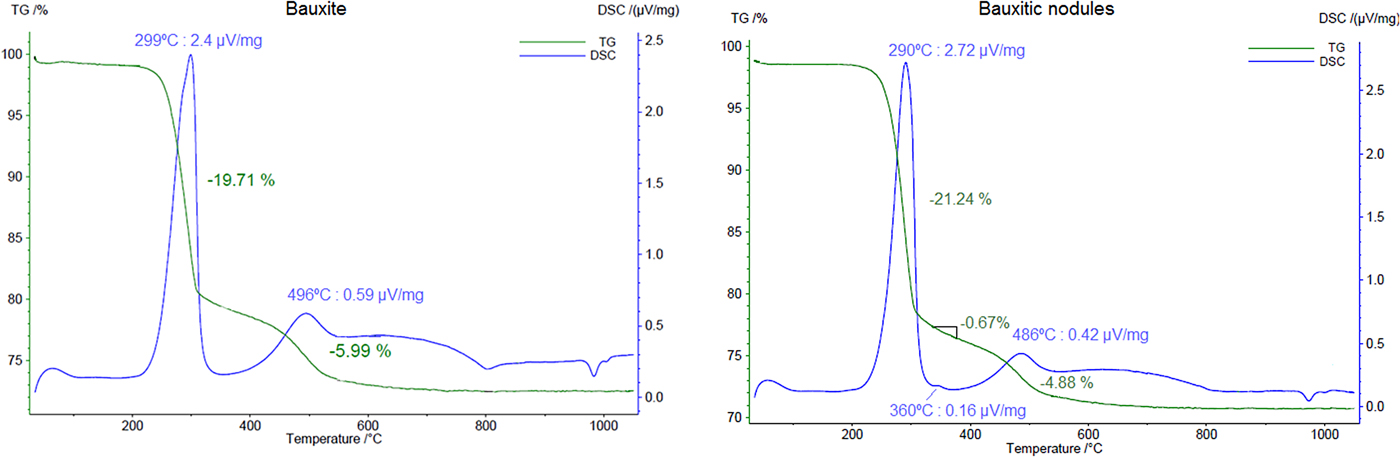
Fine gibbsite decomposes to χ-Al2O3 from temperatures of 270°C (Brindley and Choe, Reference Brindley and Choe1961), whereas goethite dehydroxylates around 300°C (Schulze and Schwertmann, Reference Schulze and Schwertmann1984) and kaolinite at temperatures near to 500°C (Yeskis et al., Reference Yeskis, Koster van Groos and Guggenheim1985). The thermal results of the bauxite sample shows two endothermic peaks in the DSC curve (Fig. 6), one at 299°C and the other at 496°C. They correspond to the decomposition of gibbsite and kaolinite, respectively. The associated mass loss of 19.71% and 5.99% may represent the dehydroxylation of these minerals. Using stoichiometrics these values represent 56.8% of gibbsite and 46% of kaolinite.
Fig. 6. TGA and DSC results of a sample of bauxite and a sample of the bauxitic nodules. Heating rate: 10 K min–1.
When compared to the bauxite sample, the bauxitic nodules also show, besides gibbsite and kaolinite dehydroxylations, goethite, which is represented by a small peak in the DSC curve at 360°C (Fig. 6). A mass loss of 0.67% accounts for the loss of water of goethite at this temperature and accounts for 6.0% of goethite in the sample, whereas the goethite quantified by the Rietveld method was 4.5%. The first loss of TGA curve (5.31%) is addressed to the decomposition of gibbsite and represents 61.3% of gibbsite in the sample, a value close to the quantified content by the Rietveld method (62.6%, Table 2).
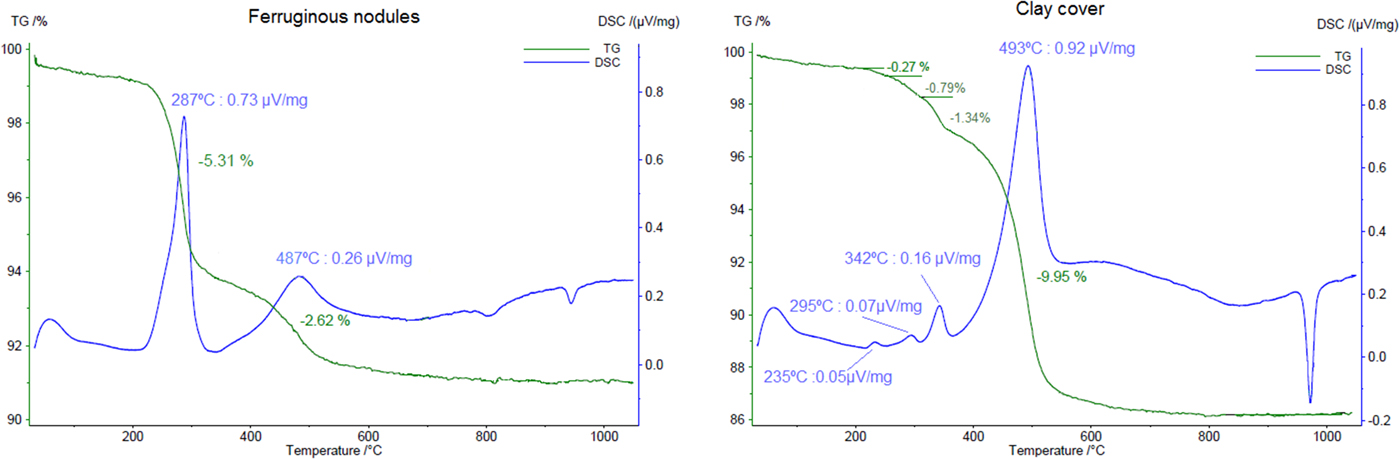
The dehydroxylation of goethite is not observed as clearly in the sample of ferruginous nodules as in the other samples, but seems to be represented by a small shoulder in the DSC curve (Fig. 7) near to 400°C, overlapped by kaolinite, which dehydroxylates in this range of temperature, reaching its maximum at 487°C. As a deconvolution of these peaks was not possible, the mass loss of 2.62% represents not only the kaolinite water, but also, partly, the goethite content.
Fig. 7. TGA and DSC results for a sample the ferruginous nodules and a sample of the clay cover. Heating rate: 10 K min–1.
When polycrystalline grains of coarsened gibbsite are heated, a water overpressure is developed in the inner part of these grains, forming an environment close to hydrothermal conditions, transforming part of the gibbsite into poorly crystallized χ-Al2O3 and the inner part into bohemite (Mercury et al., Reference Mercury, Pena, De Aza, Sheptyakov and Turrillas2006). This results in two endothermic peaks: one around 230°C and other near 280°C, this latter endotherm is attributed commonly to the formation of boehmite (Colombo and Violante, Reference Colombo and Violante1996). Therefore, two small peaks at 235°C and 298°C in the DSC curve are related to the decomposition of gibbsite in a sample of the clay cover (Fig. 7). Another peak at 342°C represents the dehydroxylation of goethite with a loss of mass of 1.34%, which accounts for a calculated 12.0% of goethite in the sample, close to that obtained in the Rietveld refinement (11.7%). The kaolinite decomposition, and probably some böhmite, is represented by the peak with its maximum at 493°C.
Mineral chemistry
Goethite
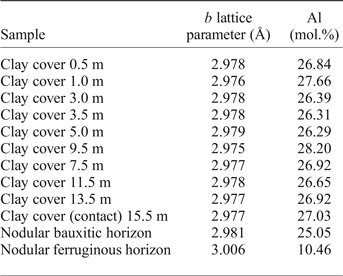
Partial Al substitution for Fe in goethite is very common (Norrish and Taylor, Reference Norrish and Taylor1961; Thiel, Reference Thiel1963; Schulze, Reference Schulze1984; Fazey et al., Reference Fazey, O'Connor and Hammond1991; Schwertmann and Carlson, Reference Schwertmann and Carlson1994; Li et al., Reference Li, O'Connor, Low, van Riessen and Toby2006; Neumann et al., Reference Neumann, Avelar and Costa2014) and has been frequently described in lateritic profiles, including bauxite-bearing profiles (Fitzpatrick and Schwertmann, Reference Fitzpatrick and Schwertmann1982; Trolard and Tardy, Reference Trolard and Tardy1989; Kotschoubey et al., Reference Kotschoubey, Calaf, Lobato, Leite, Azevedo and Marini2005; Neumann et al., Reference Neumann, Avelar and Costa2014; Costa et al., Reference Costa, Silva Cruz, Faria and Pöllmann2014). This corresponds to the partial solid solution goethite–diaspore and has the general formula (Fe1–xAlx)OOH, as proposed by Thiel (Reference Thiel1963) for Al-rich goethites. These substitutions result in a linear shift of the d 111, d 130, d 140 and d 021 goethite peaks. Schulze (Reference Schulze1984) described the linear decrease of the b lattice parameter related to the increasing substitution of Al-for-Fe (XAl, in molar fraction) in synthetic goethites as:
Appling the Vegard's law with the b cell parameters of goethite, refined by the Rietveld method, the results suggest that this mineral in the Juruti regolith shows increasing Al content in the bauxite nodules (25.05 mol.%) and in the clay cover, ranging from 26.31% to 27.66 mol.%, below the maximum value of 36 (mol.%) determined by Schwertmann and Carlson (Reference Schwertmann and Carlson1994) in natural samples. The goethites are much less aluminous in the nodular ferruginous horizon, but still contain 10.46 mol% of Al.
Hematite
Hematite is also likely to have Al in their composition, forming a limited solid solution with corundum, as proposed by Stanjek and Schwertmann (Reference Stanjek and Schwertmann1992). In contrast to goethite, the substitution of Al-for-Fe in hematite has no direct correlation with the lattice parameters, due to a coupled OH– for O–2 substitution, resulting in the postulated general formula for the Al-rich hematite: (Fe1–xAlx)2–z/3(OH)zO3–z. Stanjek and Schwertmann (Reference Stanjek and Schwertmann1992) correlated the lattice parameters and the volume of the unit cell to the Al contents and the loss on ignition in synthesized hematite. Neumann et al. (Reference Neumann, Avelar and Costa2014) derived the equations from Stanjek and Schwertmann (Reference Stanjek and Schwertmann1992) correlating the Fe, the Al and the OH occupancy (Xn, in molar fraction) to variation in the a and c lattice parameters of hematite:
The a and c lattice parameters of hematite obtained with the Rietveld refinement are presented in Table 4 together with the calculated Al, Fe and OH contents (in mol.%) from equations 2, 3 and 4, the vacancy at the Fe(Al) site and the OH–/Al relation. According to the results, the hematites are characteristically less aluminous than goethites (Table 3), nonetheless hematites of the nodular ferruginous horizon and of the bauxite present 7.27 and 10.22 (mol.%) of Al, respectively, while the OH contents are 12.46 and 0.6 (mol.%).
Table 3. Al (mol.%) contents of the goethites along the regolith, calculated according to Schulze (Reference Schulze1984).
Table 4. Mineral composition of the hematites refined by the Rietveld method, calculated according to Stanjek and Schwertmann (Reference Stanjek and Schwertmann1992).
The vacancies at the Fe(Al) site result from a compensation of charge imbalance due to the hydroxyl input, as the presented hematite formula requires ⅓ of the Fe(Al) position for each OH–-for-O–2 substitution (Neumann et al., Reference Neumann, Avelar and Costa2014). The increase in Al contents in hematite are thus associated with an increase in OH groups (Pinney and Morgan, Reference Pinney and Morgan2013) and the OH/Al substitution ratio is close to 2.2, as averaged by Stanjek and Schwertmann (Reference Stanjek and Schwertmann1992). Although most of the OH might surround the vacant Fe(Al) sites formed during hematite crystal growth (Cao et al., Reference Cao, Kang, Yang, Zhen, Liu, Chen and Wei2015), Neumann et al. (Reference Neumann, Avelar and Costa2014) considered that loss of water by hematite crystals might be common during ageing of bauxites, providing low relations of OH/Al substitutions, similar to that presented in Table 4.
Kaolinite
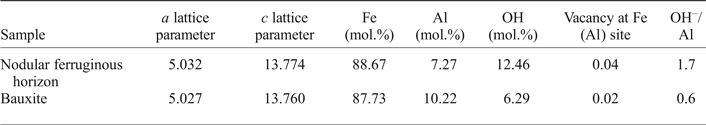
Crystallinity indices for kaolinite such as the Hinckley Indices ‘HI’ (Hinckley, Reference Hinckley1963), ‘QF’ of Range and Weiss (Reference Range and Weiss1969), ‘R2’ of Liètard (Reference Liètard1977), ‘IK’ of Stoch (Reference Stoch1974), ‘H&B’ of Hughes and Brown (Reference Hughes and Brown1979) and the ‘expert system’ of Plançon and Zacharie (Reference Plançon and Zacharie1990) could not be used in the samples of the regolith due to significant peak overlap in the observed XRD patterns. An alternative was the methodology proposed by Amigó et al. (Reference Amigó, Batista, Sans, Signes and Serrano1994), that only uses the (001) and (002) reflections of kaolinite that are not overlapped. Amigó et al. (Reference Amigó, Batista, Sans, Signes and Serrano1994) related the full width at half maximum (FWHM) of the (001) and (002) kaolinite reflections to their crystallinity. According to those authors, low FWHM are related to highly ordered kaolinites, whereas high FWHM values would represent less-ordered ones.
Using these relations, the kaolinite shows different crystallinity index values along the regolith (Fig. 8). The bauxitic horizon and the horizon with ferruginous nodules have the kaolinite with the highest order of the profile, whereas the horizon with bauxitic nodules and the clay cover have the lowest ordered ones. When compared to the study by Amigó et al. (Reference Amigó, Batista, Sans, Signes and Serrano1994), the kaolinite can be considered to have high to medium crystallinity.
Fig. 8. Range of the kaolinite crystallinity (order) along the regolith sequence, calculated after Amigó et al. (Reference Amigó, Batista, Sans, Signes and Serrano1994). Clay Cover: 7.5 m (this number means depth) and so on.
The loss of order in kaolinite reflects the large number of stacking defects that may occur during the formation and growth of this mineral (Aparicio and Galán, Reference Aparicio and Galán1999). These defects may also be influenced by the presence of Fe3+ in the Al (octahedral) position of kaolinite structures (Mestdagh et al., Reference Mestdagh, Vielvoye and Herbillon1980).
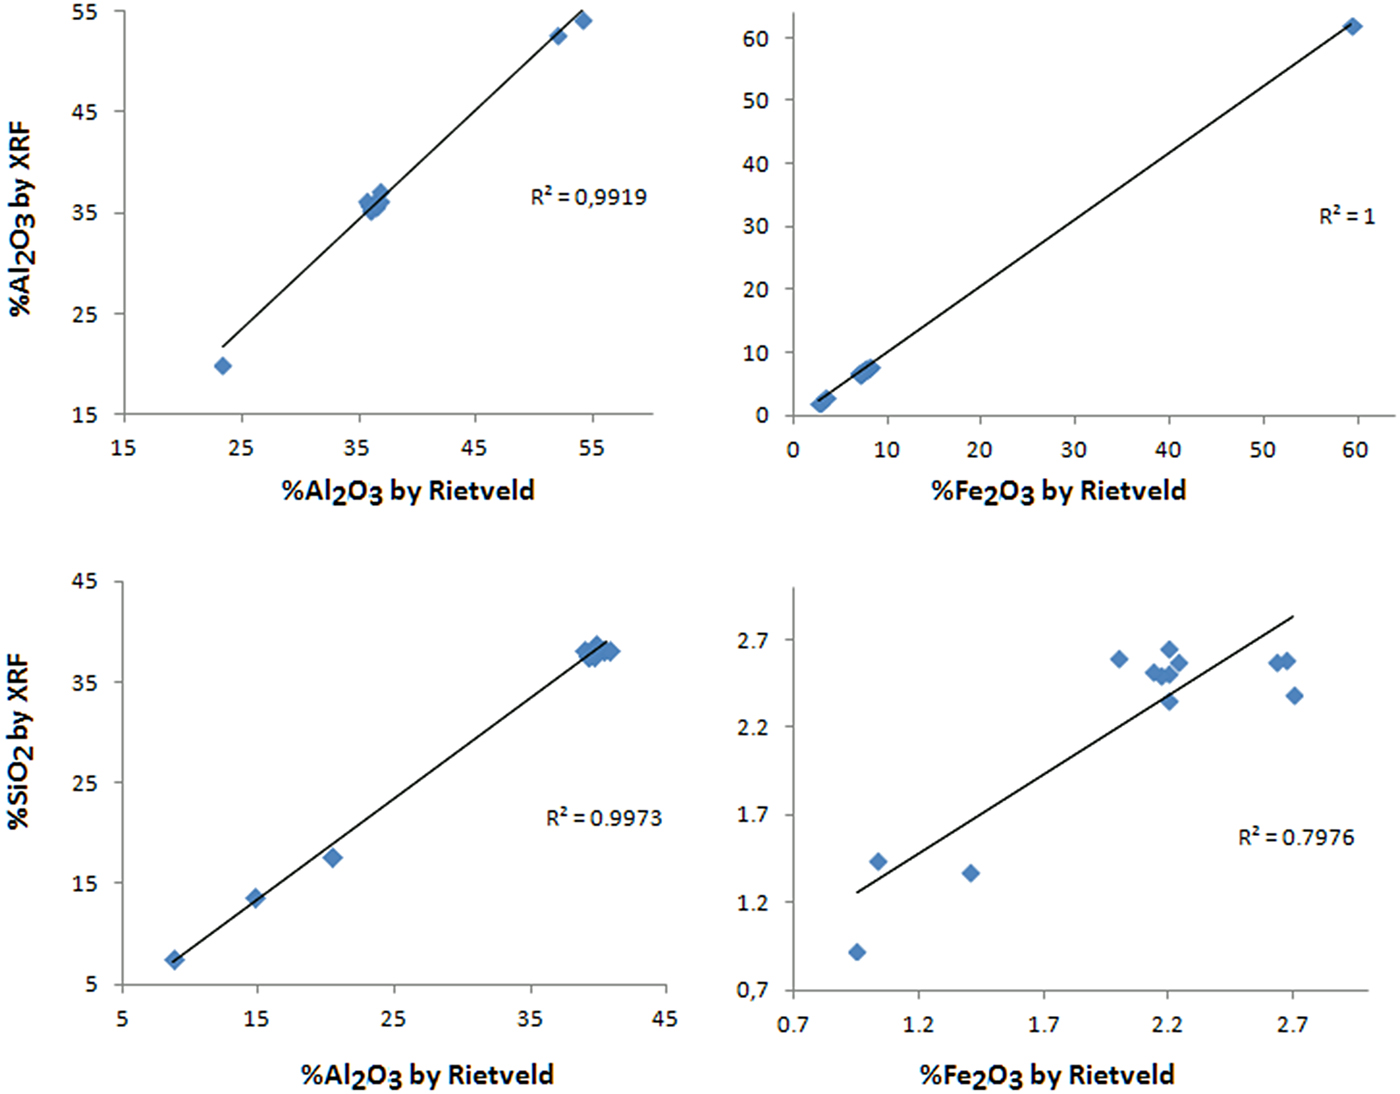
The results of the mineral quantification by stoichiometry and by the Rietveld refinement are very close (Table 2 and Fig. 9). The greatest difference is in the gibbsite contents, with lower values when quantified by the Rietveld method for almost all samples. Anatase is also frequently in disagreement with the stoichiometric results. Nevertheless the chemistry calculated after the Rietveld results also shows a good correspondence to the chemistry by stoichiometry using X-ray fluorescence, with the main differences in the Al2O3 and TiO2 concentrations.
Fig. 9. Comparison between the mineral quantifications obtained by the Rietveld refinement and stoichiometry. For more details about lithology see Fig. 2.
As observed by Paz et al. (Reference Paz, Angélica and Scheller2012), the principal differences between the diffraction patterns of kaolinite from the Amazon region and the diffraction patterns of published structures of this mineral are not in the peak positions, but in the relative intensity of the peaks. Therefore an hkl calibrated phase for kaolinite was used in the refinement. When observed by SEM the kaolinite are formed by nanometric sized (~200 nm) crystal aggregates, commonly associated with nano-anatase (Costa et al., Reference Costa, Silva Cruz, Faria and Pöllmann2014).
Feret (Reference Feret2013) reported considerable amounts of amorphous material in bauxites, which may come from several sources simultaneously and labelled the result ‘X-ray amorphous’. The author also used synchrotron radiation to obtain diffractograms that are sharper, more intense and with reduced background, allowing the partial identification of the so-called ‘X-ray amorphous’ phase. The quantified amorphous content for the samples studied can be high as 6.2% in a sample of the clay cover. In most samples with high contents of amorphous phases, gibbsite or kaolinite are underestimated when compared to stoichiometric results, suggesting this amorphous phase is related mainly to kaolinite, gibbsite or goethite that were not well solved in the refinement and therefore show up in the contents of ‘X-ray amorphous’. Another possibility is that this material is in fact amorphous and possesses a similar chemical composition to these phases.
The chemistry calculated after the Rietveld refinement (Fig. 10 and Table 5) shows that the quantified amorphous content does not have a chemical composition like kaolinite in the nodular ferruginous horizon, but is probably chemically similar to hematite and goethite. A probable contribution for the underestimation of hematite here might be related to the use of a Cu-anode, giving some fluorescence effect.
Fig. 10. Linear trend line of the chemical contents obtained by XRF and by Rietveld refinement.
Table 5. Content of the major chemical element oxides (wt.%) by mineral, along the regolith sequence, calculated using the Rietveld refinement.
BX: bauxite; NFH: nodular ferruginous horizon; NBH: nodular bauxitic horizon; CC: clay cover. kln – kaolinite; qtz – quartz; amf* – amorphous considered as kaolinite; gbs – gibbsite; hem – hematite; gt – goethite; tot – total.
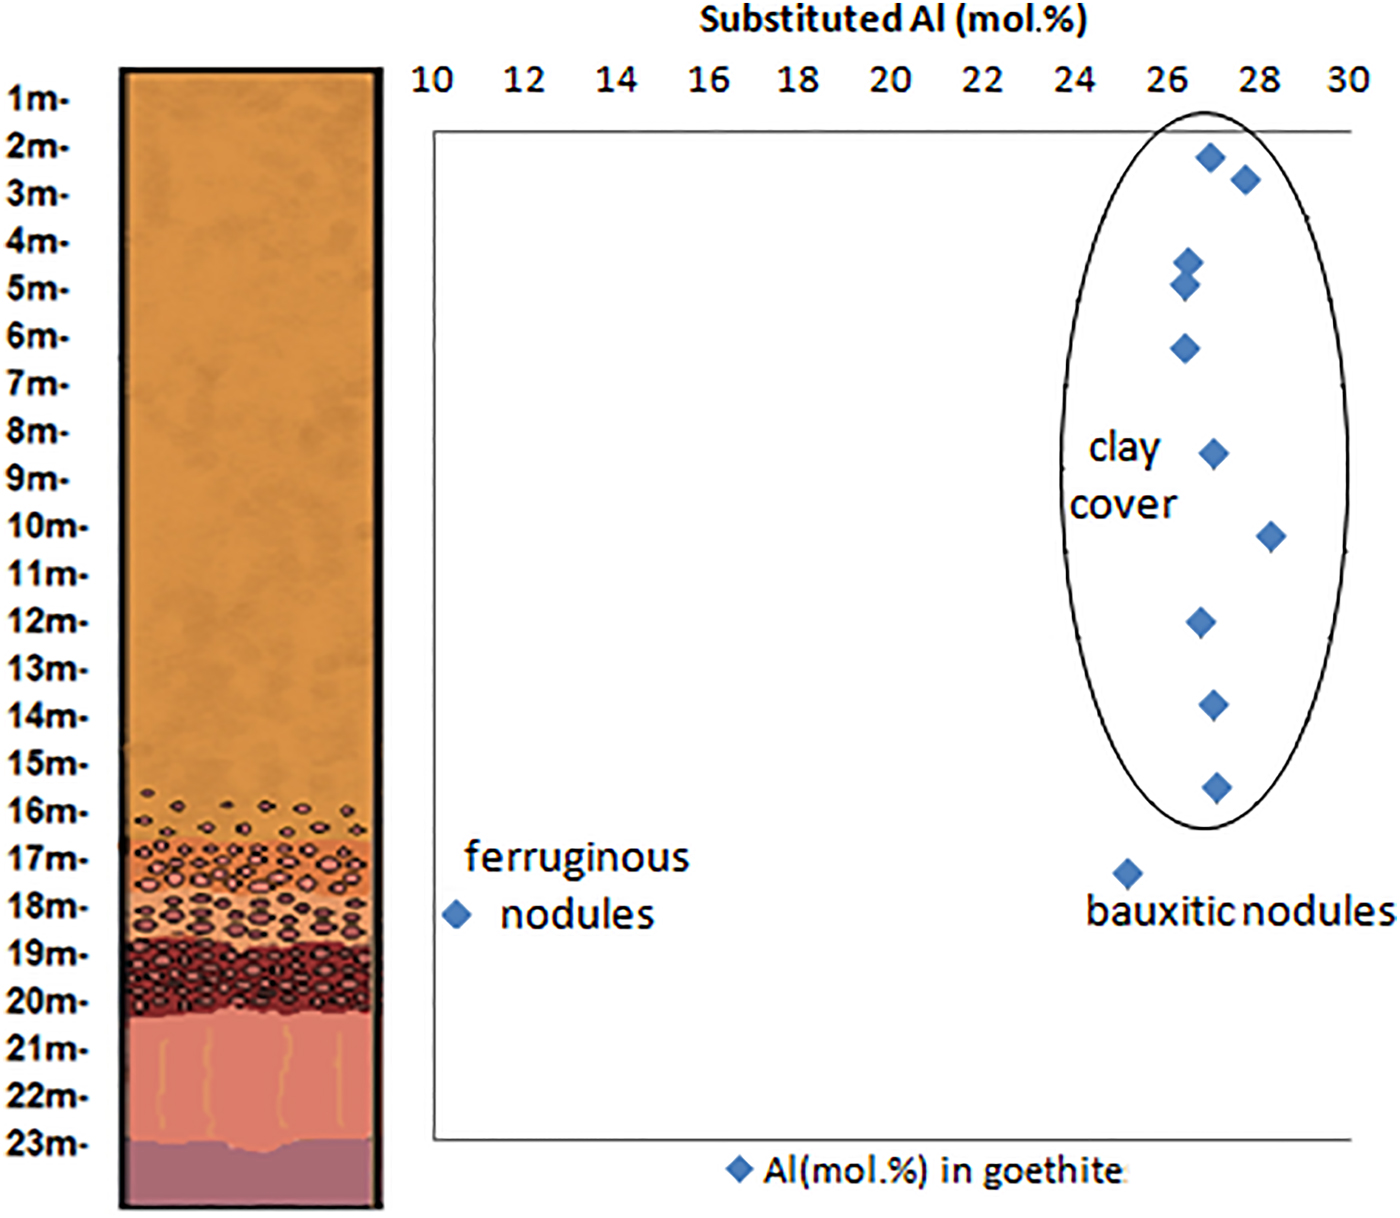
Along the Al-rich horizons of the regolith, aluminium plays a major role as the main chemical element constituent for gibbsite and kaolinite and also for replacing Fe in the crystal structures of goethite and hematite (Fig. 11 and Table 5). These substitutions reach up to 10.2% in hematite found in the bauxitic horizon and 28.2% in goethite found in the clay cover horizon. Fitzpatrick and Schwertmann (Reference Fitzpatrick and Schwertmann1982) observed significant negative correlations between the crystallinity of goethites and the substituted Al content, suggesting lower crystallinity for Al-rich goethites, which agrees with the generally not well-defined goethite peaks in the X-ray diffractograms.
Fig. 11. Substituted Al (mol.%) contents in the hematites and goethites through the investigated regolith.
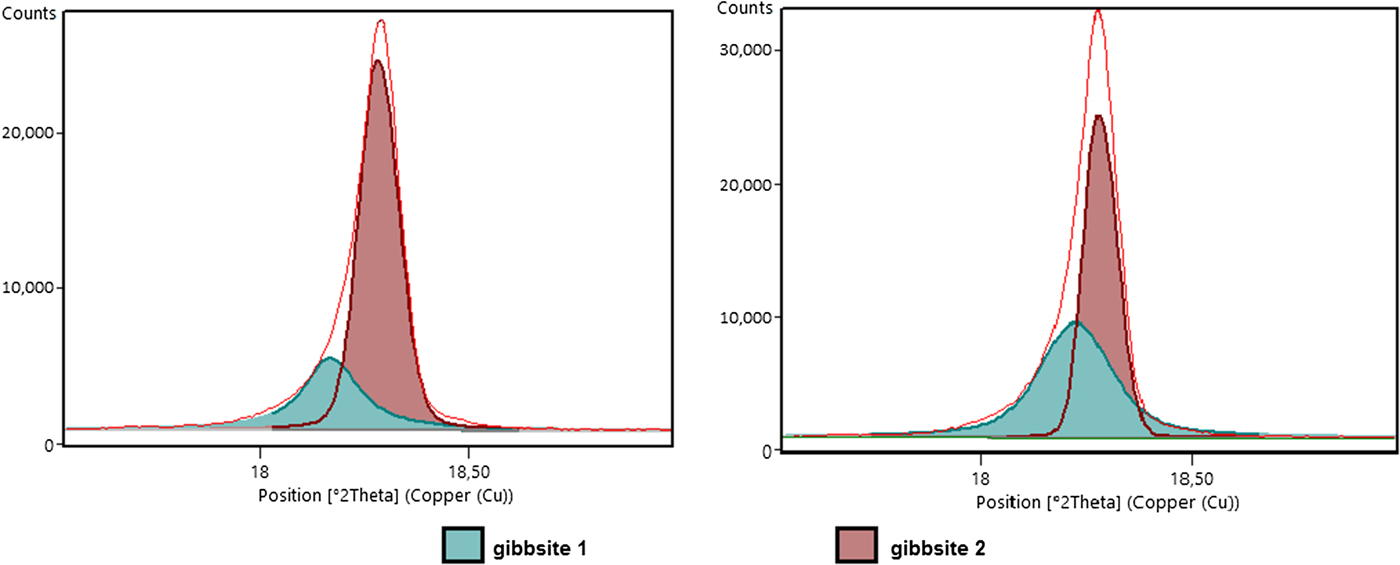
The asymmetric shape of the 002 peak of gibbsite seems to be common in gibbsite-rich horizons of the regolith. König et al. (Reference König, Angélica, Norberg and Gobbo2012) observed a probable asymmetric pattern in other bauxites from the Amazon, and related the pattern to the presence of two generations of gibbsites, resulting in convoluted 002 peaks of the same mineral. After observation of gibbsites under the SEM, at least two generations were identified in the aluminium-rich horizons of the regolith, one coarser filling microvoids and another in the fine matrix. In addition to the different crystal size of these gibbsites, different crystallinities may also influence the XRD pattern. To solve the asymmetric peak problem due to the convoluted gibbsite peaks (Fig. 12), the crystallographic information file (cif) of this mineral was duplicated for a better fitting profile (Figs 3 and 4).
Fig. 12. Asymmetric (002) reflections of gibbsite reflecting the presence of two distinct generations of this mineral.
The quantified anatase contents by stoichiometry differ from those obtained by Rietveld refinement with a maximum overestimation of 30% in the clay cover and an underestimation of up to 50% in the bauxite sample, where TiO2 content by XRF was 1.5% and the quantified anatase by Rietveld reaches up to 1.0%. As anatase is the main TiO2 carrier (Costa et al., Reference Costa, Silva Cruz, Faria and Pöllmann2014), the TiO2 contents are considered as the real anatase contents. The overestimation obtained by the Rietveld refinement may occur due to flat background lines in kaolinite-rich samples, principally by the (101) anatase reflection, which occurs partially convoluted with the 002 peak of kaolinite, causing a slight increase in the background, and difficulty with a precise background determination. The Rietveld refinement underestimations are mainly in samples with lower anatase and kaolinite contents, where the anatase peaks are smaller and frequently remain partially indistinguishable from the background, as in the ferruginous nodules.
Conclusions
Gibbsite, goethite, hematite, kaolinite and anatase are confirmed as typical mineral associations in lateritic profiles in the tropical region of the Amazon. The main mineral phases have variable concentrations and show different crystalline and chemical aspects along the regolith profile, as Al-rich goethite, kaolinite and partly Al-rich hematite. Compared with stoichiometric quantifications, the results were consistent, when the amorphous phase is considered as an amorphous analogue of kaolinite or gibbsite. With few exceptions, the thermal results are also in good accordance with the quantified mineralogy.
The hkl calibrated file used to refine kaolinite showed consistent results along the samples and was essential in the refinement as no proper crystal-structure data for this mineral are yet described. The reproducibility of the method showed accuracy for the dominant phases. For the subordinate minerals, the quantified contents show no significant differences. The discrepancy may occur due to a possible limitation of the method for phases with concentrations below 5%, but can be improved due to chemical analysis. The Goof and R wp refinement indices indicate a satisfactory quality of refinement for this type of material with reproducible results. Rietveld refinement might be improved in the material by using synchrotron radiation for higher-resolution diffraction patterns.
Despite some minor limitations in the quantification of the bauxite-bearing regolith in Juriti, Brazil, the Rietveld refinement provides promising refined data, with importance at least in the bauxite exploration phase. These data can especially give important results due to its convenience, speed and quantification of the mineralogy of the phases.
Acknowledgements
The authors thank ALCOA for access to its Juruti bauxite mine and for allowing collection of samples along a complete profile. Financial support of the Brazilian National Research Council (CNPq) through research grants (Nr. 304.519/2009-0; 477.411/2012-6), the Science Without Borders program and the INCT – GEOCIAM/CNPq project is also gratefully acknowledged. The time consuming proof reading of the manuscript was undertaken by Prof. Ian Lerche.