Introduction
Landraces or local varieties arise from the process of multiplication, selection and conservation of seeds by farmers and their communities (Zeven, Reference Zeven1998). The genetic structure of landraces results from a complex interaction between natural evolutionary processes and farmer management practices (Brown, Reference Brown1978; vom Brocke et al., Reference vom Brocke, Christinck, Weltzien, Presterl and Geiger2003; Pusadee et al., Reference Pusadee, Jamjod, Chiang, Rerkasem and Schaal2009; Rabbi et al., Reference Rabbi, Geiger, Haussmann, Kiambi, Folkertsma and Parzies2010). Farmer practices may either reduce within-population variability by seed or plant selection, or increase it by seed exchange (Parzies et al., Reference Parzies, Spoor and Ennos2004). In turn, seed exchange may reduce genetic differentiation among landraces, while selection and local adaptation may increase it.
Bulb onion (Allium cepa L.) is one of the most important vegetable crops, after tomato (Shigyo and Kik, Reference Shigyo, Kik, Prohens and Nuez2008). It is an outcrossing, biennial diploid (2n= 2x= 16), which is highly susceptible to inbreeding (Brewster, Reference Brewster2008). In Uruguay, onion was introduced by European immigrants and subsequently multiplied by household farmers. Today, local varieties many times outperform the introduced varieties in yield, post-harvest keeping ability and field resistance to specific diseases (Galván et al., Reference Galván, González Idiarte and Sollier1997; Galván et al., Reference Galván, González and Vilaró2005). For this reason, local varieties have been the basis of successful recent cultivar development by public breeders. As the process of substitution of cultivars for landraces accelerates (Vicente et al., Reference Vicente, Vilaró, Rodríguez, Galván, González, Spina, Reggio, Ibáñez, Pereira and González2010, Reference Vicente, Rodríguez, González, Vilaró, Reggio and Ghelfi2013), it is imperative to collect, characterize and conserve local germplasm for future use.
Onion is grown in two main geographical regions in Uruguay; each region specializes in a particular production system, cropping and harvesting seasons. Short-day (SD) and intermediate-day (ID) varieties are preferably cultivated in the northern and western regions of the country, whereas some ID and long-day (LD) varieties predominate in the southern region, mostly in the department of Canelones. Local onion seed is produced by a seed–bulb–seed method (González et al., Reference González, Colnago, Peluffo, González Idiarte, Zipítría and Galván2011). At the end of the first year, onion bulbs are harvested and stored under commercial conditions until the following cropping season. Usually, bulbs are phenotypically selected by farmers according to their preferences and market demands. Then, in the second year, the selected bulbs are planted again for seed production. This process provides several opportunities for both natural and artificial selection.
A number of different studies have addressed genetic diversity in onion using molecular markers (Bark and Havey, Reference Bark and Havey1995; Bradeen and Havey, Reference Bradeen and Havey1995; Cramer and Havey, Reference Cramer and Havey1999; Kutty et al., Reference Kutty, Gowda and Anand2006; Baldwin et al., Reference Baldwin, Pither-Joyce, Wright, Chen and McCallum2012; Mallor et al., Reference Mallor, Arnedo-Andrés and Garcés-Claver2014). We selected inter-simple sequence repeats (ISSRs) because they produce highly polymorphic band patterns, such as random amplified polymorphic DNA (RAPDs), but are more reproducible because of the longer length of their primers (Bornet and Branchard, Reference Bornet and Branchard2001), and they have successfully been used in onion and related species (Smolik et al., Reference Smolik, Rzepka-Plevneš, Kowalczys and Grabiec2007). Male-sterile individuals have been observed in some onion landraces (Galván and Sollier, Reference Galván and Sollier1994). There are two sources of cytoplasmic male sterility (CMS) used for hybrid production in onion (Havey, Reference Havey, Rabinowitch and Currah2002), which can be identified to provide additional genetic information (Leite et al., Reference Leite, Galmarini and Havey1999). In this study, we examined the overall structure of the genetic diversity within a set of 27 onion populations and two released cultivars derived from them in Uruguay, using ISSR and CMS marker polymorphisms.
Materials and methods
Plant material
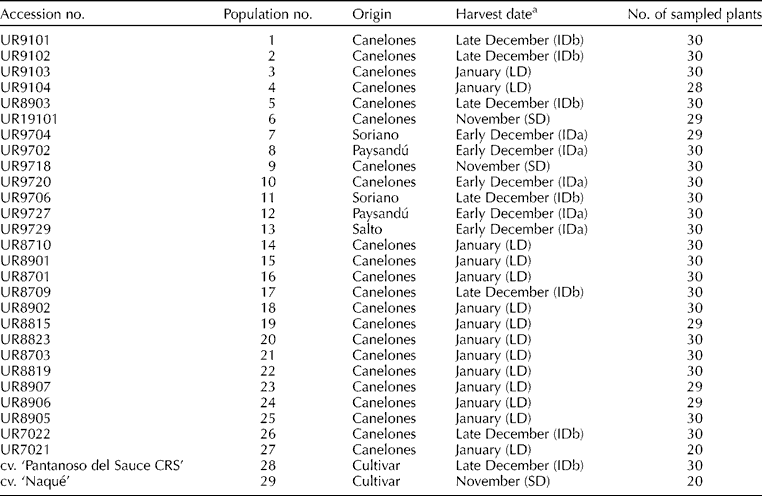
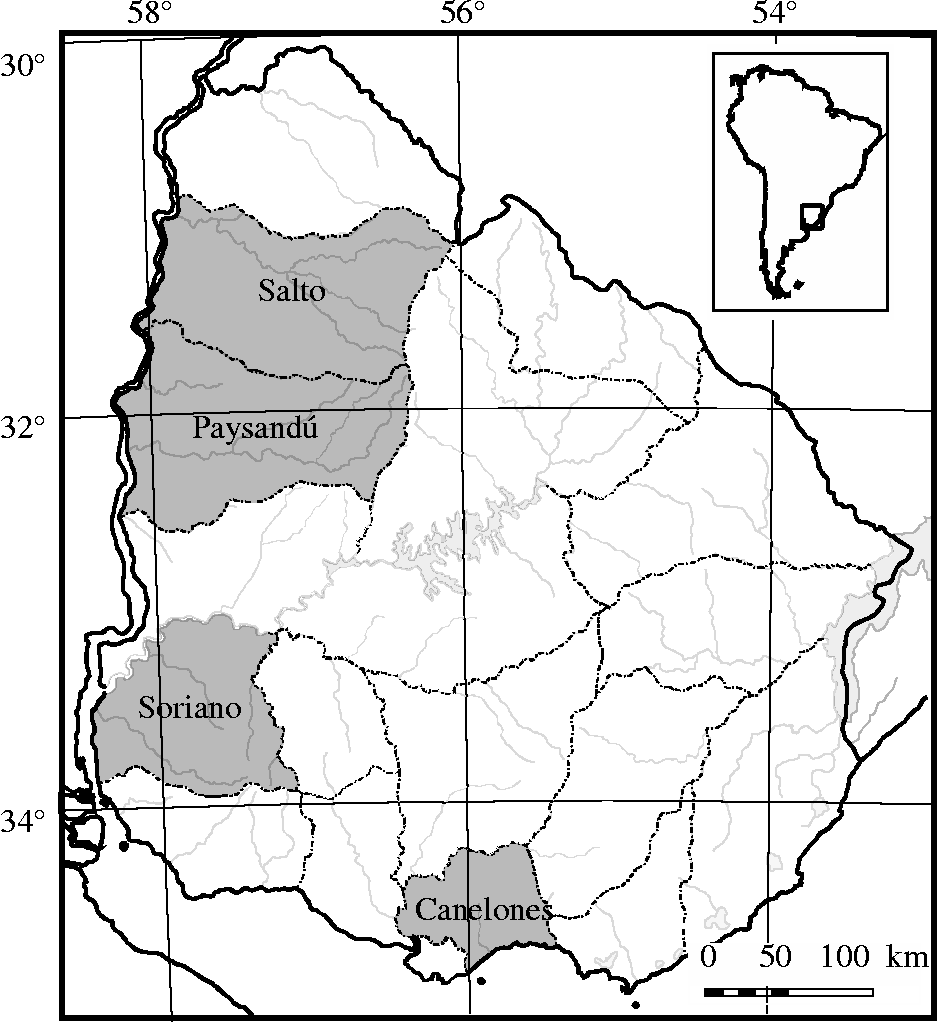
A total of 843 individuals from 27 local onion populations and two Uruguayan cultivars derived from them (‘Pantanoso del Sauce CRS’ and ‘Naqué’) were evaluated. Most populations were collected in the period 1987–1999 (Galván et al., Reference Galván, González Idiarte and Sollier1997; González Idiarte and Vilaró, Reference González Idiarte and Vilaró1999), and preserved at the Germplasm Bank (Facultad de Agronomía). Of these local populations, three were collected from the northern region of the country, two from the central region of the country and the rest from the southern region (Table 1 and Fig. 1). These local populations and cultivars were classified, based on their photoperiodic responses, into three varietal types: SD, ID and LD (Table 1). Fully developed leaves from 27 to 30 individuals of each population were sampled at random and stored in hermetically sealed bags with silica gel for DNA extraction. Total genomic DNA was isolated from dried leaves using the standard cetyltrimethyl ammonium bromide (CTAB) method (Doyle and Doyle, Reference Doyle and Doyle1987). DNA quantity and quality were verified by electrophoresis in 1% agarose gel.
Table 1 Accessions, origin, harvest date (cycle) and individuals sampled for the 27 local onion populations and two onion cultivars derived from them in Uruguay

a(SD) short-day onion type; (ID) intermediate-day, subdivided into early (IDa) or late (IDb) December harvest date; (LD) long-day onion type.

Fig. 1 Sampling regions of the 27 local onion populations studied. The areas where the accessions were collected are marked in grey.
ISSR analysis
A total of ten ISSR primers were tested during an initial screening of two randomly selected individuals from each accession. The primers (CTTCA)3 and (CT)8GG were selected for further analyses. Polymerase chain reactions (PCRs) were carried out in a 25 μl mix containing the following reagents: 1 × commercial buffer, 1.5 mM MgCl2, 1.7 units of Taq DNA polymerase (Invitrogen, Carlsbad, Ca), 0.15 mM dNTPs and 1.25 μM primer. DNA was amplified using a Thermo Electron Corporation Px2 (Milford, CT, USA) thermal cycler, and by the following conditions: an initial denaturation step at 95°C for 5 min, followed by 38 cycles of 94°C for 1 min, the annealing temperature for 1 min, and 72°C for 2 min and 30 s, followed by a final extension step at 72°C for 5 min. The annealing temperature was set at 58°C in the first cycle and was decreased by 1°C per cycle for six cycles, followed by 32 cycles at 52°C. Amplification products were separated by electrophoresis on 1.5% agarose gel at 6 V/cm, stained with ethidium bromide, and photographed on a UV transilluminator.
Cytoplasmic determination
Cytoplasmic determination was carried out for the same individuals and populations used for ISSR analysis with the primer combinations reported by Kim et al. (Reference Kim, Lee, Cho, Han, Bang, Patil, Ahn and Yoon2009). PCRs were performed in a 10 μl volume containing: 1 × commercial buffer, 0.2 μM forward primer (Mk-F: 5′-CATAGGCGGGCTCACAGGAATA-3′), 0.2 μM reverse primer 1 (Mk-R1: 5′-AATCCTAGTGTCCGGGGTTTCT-3′), 0.2 μM reverse primer 2 (Mk-R2: 5′-CAGCGAACTTTCATTCTTTCGC-3′), 0.2 μl dNTPs (10 mM each), and 0.5 U Taq DNA polymerase (SBS, Shaghai, China). The amplification conditions consisted of an initial denaturation step at 94°C for 5 min, followed by 40 cycles at 94°C for 30 s, 60°C for 30 s, and 72°C for 90 s, and a final extension step at 72°C for 10 min. The amplification products were further analysed by electrophoresis as described in the ISSR analysis.
Analysis of diversity and population structure
For the ISSR analysis, gel images were digitally processed, inverted and analysed with CrossChecker 2.91 software (www.plantbreeding.wur.nl/UK/softwarecrosschecker.html). Amplified bands were scored as presence (1) or absence (0), and the resulting binary matrices were analysed with the GENALEX 6.4 package for MS Excel (Peakall and Smouse, Reference Peakall and Smouse2006). The Shannon diversity index (H') was calculated for each population as follows:
where n i is the number of individuals in population i and N is the total number of individuals. The percentage of polymorphic bands (PPB) for each population was also calculated.
To assess the structure of genetic diversity within and among the populations, four complementary approaches were used: an analysis of molecular variance (AMOVA), an unweighted pair-group method using arithmetic average (UPGMA) cluster analysis, a principal coordinate analysis (PCoA) and a Bayesian model-based clustering method.
The AMOVA was used to describe the genetic structure and variability within and among the populations using the GENALEX 6.4 package (Peakall and Smouse, Reference Peakall and Smouse2006). Nei's genetic distances among the populations, bootstrap values (10,000 replicates) and an UPGMA tree were calculated from the binary matrix using GENDIST, SEQBOOT, NEIGHBOR and CONSENSE programs of the PHYLIP 3.69 package (Felsestein, Reference Felsestein2005). The PCoA was performed with the GENALEX 6.4 package (Peakall and Smouse, Reference Peakall and Smouse2006). Significance tests for AMOVA were estimated by 1000 permutations.
The software STRUCTURE version 2.3.3 (Pritchard et al., Reference Pritchard, Stephens and Donnelly2000) was used to detect population structure and to assign individual plants a probability of belonging to the clusters within the collection. This software estimates the most likely number of clusters (K) of alleles in the collection by calculating the log probability of data for each K value (Pritchard et al., Reference Pritchard, Stephens and Donnelly2000). The basic admixture model with unlinked loci and uncorrelated allele frequencies was used, in which the assumed number of populations (K) varied from 1 to 29, with ten replicates for each K value, 100,000 burn-in runs followed by 500,000 Markov Chain Monte Carlo (MCMC) generations. First, the K values showing the highest likelihood were considered. Because the application of this criterion resulted in a wide range of K values (K= 2 to K= 12) with high and constant likelihood scores, a complementary criterion based on identify clusters of individuals that remained grouped at all the K values in the selected range was applied. The lowest K values that showed these groupings is presented. The graphical display of the results of STRUCTURE was generated using the Distruct software (Rosenberg, Reference Rosenberg2004).
Results
ISSR analysis
The primers (CTTCA)3 and (CT)8GG amplified a total of 83 polymorphic bands that ranged from 240 to 2200 bp. The first one amplified 38 bands from 240 to 1490 bp in length, whereas the latter yielded 45 different bands from 260 to 2200 bp. All loci were polymorphic at the global level and no private or fixed alleles were identified in any accession.
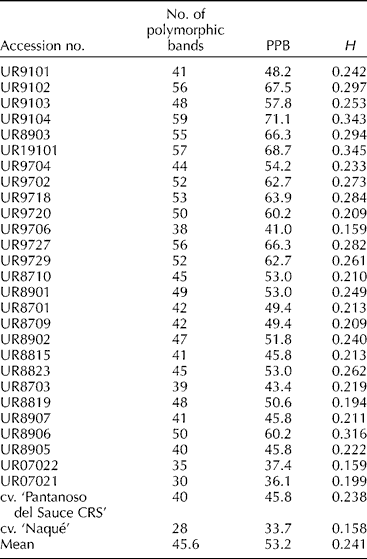
Within the populations, the number of polymorphic ISSR loci ranged from 28 (cv. ‘Naqué’) to 59 (population 4), with a mean of 45.6 (Table 2). Within the populations, the PPB values varied from 33.7% for cv. ‘Naqué’ to 71.1% for population 4, with a mean of 53.2%. The Shannon diversity index (H') showed an average of 0.241 within populations ranging from 0.158 (cv. ‘Naqué’) to 0.345 (population 6). Both cultivars were included among the accessions with the lowest diversity indices with the open-pollinated cv. ‘Naqué’ showing the lowest values of the collection.
Table 2 Number of polymorphic bands, percentage of polymorphic bands (PPB) and Shannon diversity index (H') for the 27 onion populations and the two onion cultivars derived from them in Uruguay

Analysis of diversity and population structure
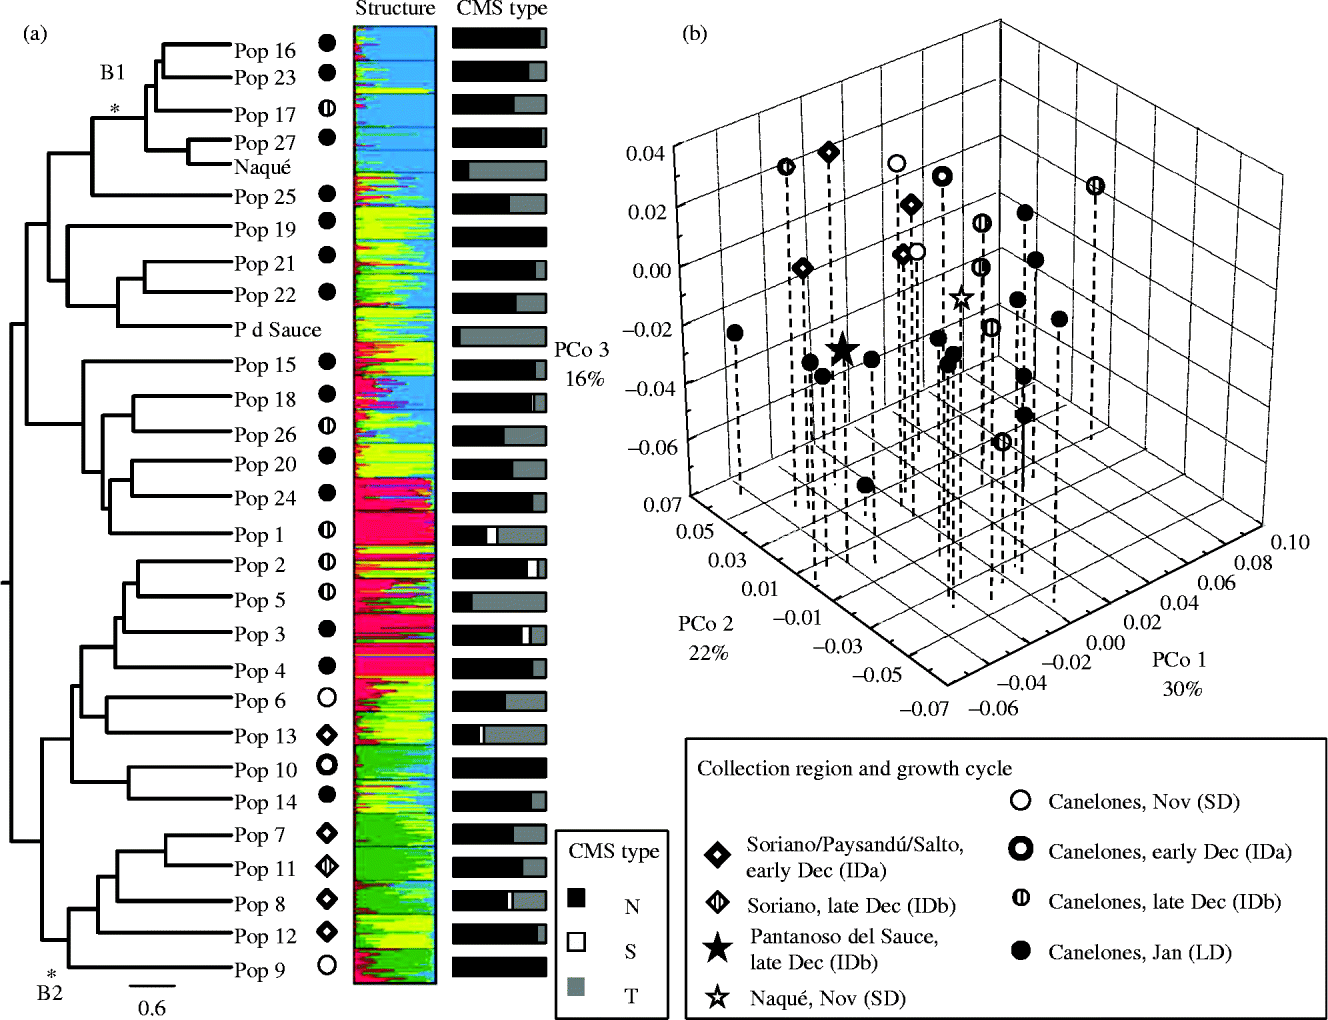
The overall AMOVA showed that a high proportion of genetic diversity resided among the individuals within each population (66%), whereas the remaining 34% resided among the populations (P= 0.01; Table 3). When the AMOVA considered the cropping cycle and geographical regions as sources of variation, it also resulted in a higher percentage of the genetic variability within the populations. Genetic differences between the populations collected from the southern and northern regions were significant, although only 4% of the variation was explained by this partition. The AMOVA revealed no significant variation among the growing cycles (Table 3). The UPGMA dendrogram of the 29 populations showed only two groups with a bootstrap support higher than 90 (Fig. 2(a)). Group B1 comprised four LD southern populations and the SD cultivar ‘Naqué’, and group B2 consisted of four ID north-western populations (7, 8, 11 and 12) and one SD accession (9) from Canelones (Fig. 2(a)).
Table 3 Analysis of molecular variance (AMOVA) for the 27 local onion populations and the two cultivars derived from them in Uruguay based on 83 ISSR polymorphic bands

**Significant at the 0.01 probability level.

Fig. 2 Population structure analyses based on ISSR markers and CMS types of the 27 local onion populations and the two cultivars (‘Pantanoso del Sauce CRS’ (P d Sauce) and ‘Naqué’) derived from them in Uruguay. (a) UPGMA, STRUCTURE and cytoplasmic discrimination analyses. The asterisks indicate the branches (B1 and B2) with a bootstrap support higher than 90. The bar indicates Nei's genetic distance. (b) Principal coordinate analysis (PCoA).
For the STRUCTURE analyses, the criterion for obtaining the most likely value of K revealed that at values from K= 2 to K= 4, the main clusters were already identified. Further increases in the K values resulted in a higher subdivision of individual assignments into the same four clusters. In addition, clusters obtained at K= 4 were consistent with phenotypic data of the landraces and the results obtained with the PCoA and dendrogram. Thus, K= 4 was chosen as the most likely number of clusters. At this K value, the analysis revealed a cluster of alleles (represented in green) that predominate in five SD and ID accessions from different geographical origins (Fig. 2(a)). Most of these populations were also present in group B2 of the UPGMA tree. Then, a second cluster (represented in blue) predominated in the ID and LD accessions from Canelones, and the SD cultivar ‘Naqué’. Most populations belonging to this cluster were included in group B1 of the UPGMA tree. The remaining two clusters (represented in yellow and red) contained the rest of the ID and LD accessions from different geographical origins. Some of these accessions had no predominant genetic background, but had a mixture of two or more clusters (Fig. 2(a)).
In the PCoA, the first three principal coordinates together explained 68% of the total genetic variation (Fig. 2(b)). This analysis showed a clear grouping of the SD and ID populations from the northern (Salto) and western (Soriano) regions of Uruguay (populations 6, 7, 8, 9, 11, 12 and 13). Most of these populations also clustered together in both the UPGMA (cluster B2) and STRUCTURE (represented in green) analyses. In contrast, the more numerous group of the ID and LD populations from the southern region (Canelones) and the two cultivars showed a widespread distribution (Fig. 2(b)).
Cytoplasmic discrimination analysis based on the orf725 region and the coxI gene showed that 24 of the 27 local populations presented sampled plants with CMS types, while the remaining three populations (populations 9, 10 and 19) had the N-type cytoplasm for all the sampled plants (Fig. 2(a)). The CMS-S or CMS-T types predominated in three local populations (populations 1, 5 and 13) and both cultivars. The CMS-S-type cytoplasm showed a lower frequency in the collection, as it was present in only five accessions (average 8.4%), mainly in the ID accessions (populations 1, 2, 3 and 13) except for LD population 3. The CMS-T-type cytoplasm was present in 24 local onion populations (average 32.2%), predominantly in local populations 1, 5 and 13 and both cultivars (maximum frequency for cv. ‘Naqué’ 92%). In contrast, the CMS-N-type cytoplasm was predominant in 19 of the 27 populations, particularly in the LD accessions (populations 3, 4, 14, 15, 16, 18–25 and 27; Fig. 2(a)).
Discussion
Previous studies in Uruguayan onion landraces revealed high levels of variability in morphological and agronomical traits (Galván et al., Reference Galván, González Idiarte and Sollier1997; González Idiarte and Vilaró, Reference González Idiarte and Vilaró1999; Galván et al., Reference Galván, González and Vilaró2005). In the present study, we also found high levels of genetic variability in 27 Uruguayan landraces and two cultivars using molecular markers. High levels of genetic diversity are expected for local populations, especially for outcrossing species as has been reported for onion cultivars using RAPD (Kutty et al., Reference Kutty, Gowda and Anand2006) and restriction fragment length polymorphism (RFLP) (Bark and Havey, Reference Bark and Havey1995) markers. Until now, population studies in onion have been performed using dominant molecular markers, particularly RAPD (Bradeen and Havey, Reference Bradeen and Havey1995; Kutty et al., Reference Kutty, Gowda and Anand2006; Leite and Anthonisen, Reference Leite and Anthonisen2009), but not ISSR (reviewed by Reddy et al., Reference Reddy, Chinnappareddy and Khandagale2013) markers. Indeed, the latter were used in a study conducted on Indian landraces (Chaurasia and Adsul, Reference Chaurasia and Adsul2009). In the present study, we also used ISSR markers and found them to be sufficiently informative and reasonably cost- and labour-effective.
The results of AMOVA showed that most of the marker variation was due to the differences between individuals within the populations. This was also supported by the Shannon diversity indices (H'), the PPB values and the overall lack of private alleles, suggesting the absence of genetic isolation among the populations. This structure is expected for an outcrossing species, where most of the genetic variability resides within rather than among the populations (Hamrick and Godt, Reference Hamrick and Godt1997). In addition, genetic differentiation between the geographical regions or growing cycles was low. Indeed, the genetic structure analysed by different approaches (AMOVA, PCoA and STRUCTURE) did not reveal a clear separation between the northern and southern populations or between the ID and LD populations. However, STRUCTURE assigned most of the accessions into four clusters of related alleles. One of these four groups, which was also evident in the PCoA, mostly comprised the accessions of short and intermediate cycles. Despite the low genetic differentiation between the growing cycle types revealed by the AMOVA, this cluster of accessions suggests that the SD populations may be related to the same source of germplasm, thus implying that the SD populations in Canelones may have originated from plant material already present in the northern and western regions.
Most of the ID and LD populations from Canelones (the most represented in the collection) showed a more scattered distribution in the PCoA (Fig. 2(b)). Some of these populations or individuals were assigned to a mixture of different genetic pools in the STRUCTURE analysis (Fig. 2(a)). Although weak, the association among the accessions with the SD and ID cycles from different geographical origins, and the lack of population structure among the long and intermediate growing cycle accessions from Canelones suggested that, despite generalized admixture, a certain degree of structuring is present in this collection. Indeed, we observed highly dynamic seed exchange or the deliberate mixing of bulbs in seed-producing crops, aiming at genetic improvement. These practices were observed and/or reported by farmers themselves in the surveys during seed collection (Galván et al., Reference Galván, González Idiarte and Sollier1997). Gene flow among the populations may also involve unintentional events such as cross-pollination among the populations as a consequence of inappropriate isolation during seed production.
The PCoA and STRUCTURE analyses did not differentiate between the red skin (populations 9, 10 and cv. ‘Naqué’) and yellow-brown skin (the other populations and cv. ‘Pantanoso del Sauce CRS’) onions. The red and yellow onions appeared scattered throughout the different groups. Skin colour in onions is controlled by a few major genes (Clarke et al., Reference Clarke, Jones and Little1944; Khar et al., Reference Khar, Jakse and Havey2008), and it is thus easy for farmers and breeders to fix different colours without affecting the overall genetic background of a population. In addition, both cultivars presented earlier harvest dates than the landraces that clustered with them. This suggests that selection for agronomic traits implied direct or indirect selection for uniform earlier cycles while not affecting the genetic background or excessively narrowing the genetic base of these populations. Growing cycle, determined by the photoperiodic threshold for bulbing, is another trait controlled by major genes (Taylor et al., Reference Taylor, Massiah and Thomas2010) and, as skin colour, it is unlikely to be tagged by the neutral markers used in this study. This lack of the relationship between population structure and morphological or agronomic traits has also been observed, among others, for seed size in common beans (Blair et al., Reference Blair, Díaz, Buendía and Duque2009) and for cultivar groups of Tulipa gesneriana (Tang et al., Reference Tang, Shahin, Bijman, Liu, van Tuyl and Arens2013).
Cytoplasmic characterization showed that most accessions had a high percentage of individuals with CMS (S and T). Leite et al. (Reference Leite, Anthonisen, Fernandes and Rodrigues2006) found all the three cytoplasm types (N, S and T) present in Brazilian onion varieties, with CMS-T type being the most frequent, while the CMS-S type being the less represented. Sterile cytoplasm types, which seem to be spread out in South American onion landraces, were originally discovered in European varieties. The CMS-S-type cytoplasm was primarily discovered in cv. ‘Italian Red’ (Jones and Emsweller, Reference Jones and Emsweller1936; Jones and Clarke, Reference Jones and Clarke1943), while the CMS-T-type cytoplasm was originally discovered in cv. ‘Jaune paille des Vertus’ (Berninger, Reference Berninger1965). The CMS-T-type cytoplasm appeared in 27 of the 29 accessions along with the N-type cytoplasm, while the CMS-S-type cytoplasm appeared in a low proportion of mostly southern accessions clustered in the PCoA diagram. Unexpectedly, cv. ‘Naqué’ and cv. ‘Pantanoso del Sauce CRS’ showed a high proportion of the CMS-T-type cytoplasm. Probably a high frequency of fertility restoration genes has allowed for fertile seed production in the source populations and during the breeding process.
In conclusion, diversity in onion has been previously reported for large collections at much broader sampling levels (Baldwin et al., Reference Baldwin, Pither-Joyce, Wright, Chen and McCallum2012; Mallor et al., Reference Mallor, Arnedo-Andrés and Garcés-Claver2014). In this study, we emphasized the analysis of genetic differentiation in a large collection of local populations representing a small geographical area and related it to production systems. We found that, in spite of the relatively small cultivated source area and widespread seed exchange among farmers, a low degree of genetic structure is maintained and could be detected in our preliminary analysis based on nuclear and cytoplasmic markers. We suggest that this population structuring is probably maintained by the actual productive practices of local farmers reinforced by the seasonal specialization of the crop in the different geographical areas and reproductive isolation due to flowering dates. These results help to understand the main forces that shape genetic structure in Uruguayan onion landraces, which constitutes the basis for efficient in situ maintenance of genetic diversity and breeding strategies based on local germplasm. In particular, the relationship between the shorter-day populations from the main production area in Canelones and the northern populations may deserve further study.
Acknowledgements
This study was partially funded by the INIA-FPTA (Uruguay) Project 250.


