


1. INTRODUCTION
Maritime traffic safety is becoming ever more important as the world's fleet size increases and the number of maritime accidents increases. A considerable percentage of maritime accidents result in casualties and/or catastrophic damage to the environment. Challenging waterways, such as the Istanbul Straight, have additional hazards and bring extraordinary risk to the environment, and also threaten local inhabitants. The importance of the Istanbul Strait in terms of geopolitical, geographical, and historical aspects has been highlighted in several studies (Aydogdu et al., Reference Aydogdu, Yurtoren, Kum, Park and Park2012; Ozgecan et al., Reference Ozgecan, Uluscu, Ozbas, Altıok and Or2009; Akten, Reference Akten2004). The Istanbul Strait has the world's second most dense traffic volume, after the Malacca Strait. The volume of maritime traffic in the Strait is three times higher than in the Suez Canal, four times higher than in the Panama Canal and twice that in the Kiel Canal (Kum et al., Reference Kum, Fuchi and Furusho2006). It has an “S”-shaped structure and river-like features, and has different characteristics in different regions. About 14 million people live in Istanbul and more than one million passengers are transported by ferries on a daily basis (Aydogdu et al., Reference Aydogdu, Yurtoren, Kum, Park and Park2012). For these reasons, the Istanbul Strait is considered one of the world's most difficult waterways.
Due to its shape, accidents and challenges, the Istanbul Strait draws the attention of researchers and newly developed models have been tested using data from the Istanbul Strait (Sarioz and Narli, Reference Sarioz and Narli2003; Or and Kahraman, Reference Or and Kahraman2002). Also, there have been a considerable number of studies regarding accident statistics and accident-causing factors in the Strait. In the existing literature, however, there are no comparative studies comparing accident statistics data and the risk perception of stakeholders including ship captains, maritime pilots, and Vessel Traffic Services (VTS) operators. Analyses of maritime accidents may expose structural maritime traffic problems that cause accidents; on the other hand, risk perception and mental motivation have different effects on practical life (Kum et al., Reference Kum2008). The location of previous maritime accidents and the expected risk at particular locations might differ or verify each other (Bulut et al., Reference Bulut, Duru and Aydogdu2010).
The aim of this study is to illustrate differences between the risk perceptions of Strait stakeholders and maritime accident statistics by using a generic fuzzy analytic hierarchy process (GF-AHP) model. For this purpose, criteria were determined and face-to-face interviews with a total of 37 stakeholders (15 maritime pilots, 15 VTS operators, seven transit ship captains) were conducted. At the same time, maritime accident statistics between 2000 and 2011 were obtained from the official website of the Turkish Ministry of Transportation, Maritime and Communication and analysed. According to the accident statistics, 310 accidents occurred in the territory of the Istanbul Harbour Master. 232 of those accidents were in the Istanbul Strait and 109 of them took place at the south entrance of the Strait, not including the anchorage area, as an indication of the dangers in this area. However, the middle part of the Strait where most of the sharp turns take place was found to be perceived to be the most dangerous area to navigate from the questionnaire study of stakeholders.
This paper is organized in five additional sections. Section 2 provides a literature review and Section 3 discusses the determination of accident causing criteria to be used in the GF-AHP. Section 4 describes the methodology used in our study to reveal the most hazardous perceived areas on the Istanbul Strait. In section 5, the numerical results of expert consultation and statistical data are calculated for comparison. Section 6 concludes the study and suggests further research areas.
2. LITERATURE REVIEW
There are several types of studies regarding the Istanbul Strait that focus on accident and risk analysis. For instance, Or and Kahraman (Reference Or and Kahraman2002) analysed possible factors contributing to accidents in the Istanbul Strait. The simulation model takes into account the characteristics and the critical traffic rules and behaviour of the Strait, and then uses the conditional accident probabilities determined via the Bayesian method. Simulation results indicate significant increases in the numbers of maritime accidents involving higher transit traffic rates, denser local traffic conditions, a higher percentage of longer ships and/or adverse weather conditions. Akten (Reference Akten2004) investigated the relationships between casualty types, numbers of ships, the localities where most incidents occur and external factors, such as currents and darkness, that contribute to maritime casualties in the Strait. This study revealed the major factors with the aim of suggesting possible solutions. In her doctoral thesis, Ece (Reference Ece2006) studied the geographical, meteorological, hydrological, oceanographic, economical, and strategic characteristics of the Istanbul Strait. She also investigated the shipping traffic, maritime casualties and circumstances of innocent passage based on current safety precautions. In addition, she generated a casualty chart for the Istanbul Strait by using the statistical analysis method. In the conclusion, two different results are revealed: Firstly, the relationship between the number of maritime casualties and the passage of ships without a pilot, and secondly, the influence of meteorological factors on ship accidents such as current, wind, fog, and the tonnage of ships in the Istanbul Strait. Kum et al. (Reference Kum, Fuchi and Furusho2006) investigated the risk profile of maritime accidents in the Istanbul Strait and then developed a methodology to minimize human error. He exposed the potential threats and defined the risk profile based on the geographical and physical specifications of the Istanbul Strait. Ozbas et al. (Reference Ozbas, Or, Uluscu and Altiok2009) developed and tested a hybrid/mathematical simulation model to analyse transit maritime traffic in the Istanbul Strait. They concluded that to maintain the current scheduling procedure, it would beneficial to enforce pilotage and allow more night passages when there was less local traffic, and thus lower chances of dangerous interactions.
In decision science, several expert choice and decision-making methods are presented. The fuzzy analytic hierarchy process (FAHP) method is widely used and its superiority noted by various empirical works (Bulut et al., Reference Bulut, Duru, Keçeci and Yoshida2012; Cheng, Reference Cheng1997, among others). The classical AHP method is frequently used in decision-making due to its superiority in structured decision-making and subjective analysis. The fuzzy extension of the AHP method specifically allows for modelling of uncertainties during the decision making process. Rather than a 9-0-1/9 scale, fuzzy AHP simplifies the task and response style by a number of linguistic selections for rating pair-wise comparisons.
The FAHP method is also applied to conduct risk and perception assessment in different fields. For instance, Dikmen et al. (Reference Dikmen, Birgonul and Han2007) proposed a methodology for the risk rating of an international construction project by utilizing fuzzy risk rating. Nieto-Morote and Ruz-Vila (Reference Nieto-Morote and Ruz-Vila2011) proposed a new methodology for construction project risk analyses to simplify and prioritize risk properly by using fuzzy set theory. Wang et al. (Reference Wang, Chan, Yee and Diaz-Rainey2012) proposed a model for structured analysis of the aggregative risk of implementing various green initiatives in the fashion industry supply chain. However, the FAHP method still has weaknesses due to the classification of expertise and reliability of surveys. Bulut et al. (Reference Bulut, Duru, Keçeci and Yoshida2012) dealt with these problems and suggested Generic Fuzzy AHP (GF-AHP), which proposed an expert prioritization module in addition to the consistency control. In the present research, the GF-AHP method is selected for expert consultation. Criteria were defined using a pre-survey from existing literature and then the interviewed stakeholders were required to compare them to determine priorities.
Although there are numerous studies on risk perception, only a limited number focus on a comparison between risk perception and statistical data. For instance, Hayawaka et al. (Reference Hayakawa, Fischbeck and Fischhoff2000) investigated risk perception in terms of traffic safety and statistical data between the USA and Japan, which clarified traffic risk and cross-national differences in risk perception. Lund and Rundmo (Reference Lund and Rundmo2009) examined cultural differences in risk perception and attitudes towards traffic safety and risk taking behaviour in the Norwegian and the Ghanaian public. Their results indicated potential for improvement of safety attitude and risk behaviour. Powell (Reference Powell2007) focused on incident prevention strategies. He concluded that ignoring risk perception might result in the development of inappropriate approaches to the management of risk.
To our knowledge, our study is novel on two fronts: it is the first study using GF-AHP to determine maritime risk perception, and it is the first maritime study comparing risk perception to statistical data.
3. DETERMINATION OF GF-AHP CRITERIA
To pair-wise analyse and explore the hazardous areas in the Istanbul Strait using the GF-AHP method, five criteria were determined using literature review and expert consultation. In this study, the Istanbul Strait from the southern entrance at Moda Burnu to the northern entrance at Fil Burnu is considered. Active navigation in the Strait takes place in the given zone; therefore, during determination of criteria, the anchorage areas in the Istanbul Strait are not considered. The Strait is divided into three areas, determined by environmental and traffic characteristics, local accident statistics, literature survey and expert consultation (see Figure 1).
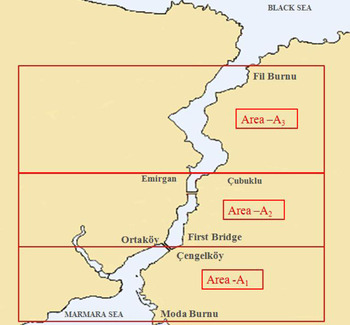
Figure 1. Three areas of the Istanbul Strait.
Area A1: The first area is the southern entrance of the Istanbul Strait from Moda Burnu to the First Intercontinental Bridge “Çengelköy-Ortaköy Line (A1)”. The biggest challenge in this area is local maritime traffic, which crosses the Strait. More than 2,100 scheduled and unscheduled crossings take place per day in the southern entrance of the Istanbul Strait, where local traffic mostly affects navigation safety (Aydogdu et al., Reference Aydogdu, Yurtoren, Kum, Park and Park2012).
Area A2: The second area is between the Çengelköy-Ortaköy Line and the Çubuklu-Emirgan line (A2), which is the narrowest part of the Strait. In this area few critical course alterations take place and strong surface current affects safe navigation (Akten, Reference Akten2003).
Area A3: The area between the Çubuklu-Emirgan Line and the Fil Burnu Line (A3) where sharpest course altering turns (up to 80 degrees) should be made is defined as the third area (Kum, Reference Kum2008).
In the Yurtoren (Reference Yurtoren2004) simulator study, A1 was determined as the most difficult area to operate a ship due to congested local traffic. A1 was also determined as the most dangerous area according to accident statistics of the Strait in by Kum et al. (Reference Kum, Fuchi and Furusho2006, Reference Kum2008).
Current (CR): Three different types of currents may occur simultaneously in the Strait. Current was found to be a dominant factor causing maritime casualties by Akten (Reference Akten2004), and is thus used as one of the five criteria.
Shape of the Istanbul Strait (SI): The shape of the Strait, including sharp turns and a narrow waterway, create a challenge to navigation and significantly affect safe navigation in the Strait (Akten, Reference Akten2003) and is thus another important criteria used to determine hazards in the area.
Volume of local traffic (VT): In several studies, dense maritime traffic was indicated as one of the main reasons for navigational difficulty in the Strait (Aydogdu et al., Reference Aydogdu, Yurtoren, Kum, Park and Park2012; Kum, Reference Kum2008; Birpınar, Reference Birpınar, Talu and Gonencgil2009; Yurtoren, Reference Yurtoren2004; Akten, Reference Akten2003). Approximately 150 transit passages (south-north bound) take place in the Strait and 2,100 crossing (east-west bound) in the southern entrance take place daily, and impose significant risk on navigators (Aydogdu et al., Reference Aydogdu, Yurtoren, Kum, Park and Park2012).
Size of Ship (SS): Vessel size has a significant impact on safe navigation in the Strait due to the sharp turns and narrow waterways (Aydogdu et al., Reference Aydogdu, Yurtoren, Kum, Park and Park2010; Yurtoren, Reference Yurtoren2004). There is a limitation based on length of vessel such as escorted passage, day and night passage or one-way traffic in the Maritime Traffic Regulations for the Turkish Straits Region, (IMO, 1994).
Pilot Existence (PE): Last but not least, the importance of pilot assistance is emphasized in the existing literature (Birpinar, Reference Birpınar, Talu and Gonencgil2009; Ozgecan et al., Reference Ozgecan, Uluscu, Ozbas, Altıok and Or2009; Akten, Reference Akten2004; Akten, Reference Akten2003). Akten (Reference Akten2003) listed the non-carriage of a pilot among the major factors contributing to maritime casualties in the Strait.
Accordingly, the criteria taken into account in this study were current (CR), shape of the Istanbul Strait (SI), volume of local vessel traffic (VT), size of ship (SS), and pilot existence (PE) (Table 1). Wind has limited effect on navigation in the Istanbul Strait due to the obstruction of high hills and buildings in accordance with results of consulting experts' opinions and is not considered as one of the criteria in the study.

Figure 2. The structure of FAHP for the selection of manning strategy.
Table 1. Criteria for the selection of hazardous areas in the Istanbul Strait.
4. METHODOLOGY
In this study, we extend the generic fuzzy analytic hierarchy process (GF-AHP) developed by Bulut et al. (Reference Bulut, Duru, Keçeci and Yoshida2012) by considering not only the duration of professional career, but also the knowledge of practitioners for the calculation of weights in each decision maker's matrix. The reason behind the selection of GF-AHP is two-fold. Firstly, GF-AHP is capable of handling both measurable and subjective data such as responses given for perception of risk. Secondly, it overcomes the drawbacks of uncontrolled reliability (survey validity debate) and unrated expertise (expert validity debate). Under these circumstances, GF-AHP is found suitable for the intended problem. In what follows, we first provide an overview of fuzzy sets and fuzzy AHP. We then describe the GF-AHP in detail.
4.1. Fuzzy sets and triangular fuzzy numbers (TFNs)
Fuzzy set theory was first developed (Zadeh, Reference Zadeh1965) to overcome uncertain problems. A triangular fuzzy number is mostly used for fuzzy modelling and its definition is as follows;
Definition 1: Let X be universe of discourse, à is a fuzzy subset of X such that for all x∈X. μ à (x) ∈ [0,1] is called the membership function of fuzzy set à and it grades of membership of x in Ã.
Definition 2: A fuzzy number à is a convex and normalized fuzzy set of X ⊆ℝ.
Definition 3: A triangular fuzzy number is defined by its basic particulars which is
 $$\mu _{\tilde A} (x) = \left\{ {\matrix{ {0,} & {x \lt l,} \cr {(x - l)/(m - l),} & {l \leqslant x \lt m,} \cr {1,} & {x = m,} \cr {(u - x)/(u - m),} & {m \lt x \leqslant u,} \cr {0,} & {u \lt x.} \cr}} \right.$$
where l and u correspond to the lower and upper bounds of the fuzzy number Ã, respectively, and m is the midpoint. The triangular fuzzy number is indicated as Ã=(l,m,u). Arithmetic operations between fuzzy numbers or a fuzzy number and crisp number are defined by standard fuzzy arithmetic operations (Zadeh, Reference Zadeh1965). Consider two TFNs à 1= (l 1,m1,u1) and à 2= (l 2,m2,u2). Their operational law is as follows (Kaufmann and Gupta, Reference Kaufmann and Gupta1991):
Fuzzy number addition ⊕:
 $$\tilde A_1 \oplus \tilde A_2 = (l_1, m_1, u_1 ) \oplus (l_2, m_2, u_2 ){\rm} = {\rm} (l_1 + l_2, {\rm} m_1 + m_2, u_1 + u_2 )$$
Fuzzy number subtraction ⊖:
 $$\tilde A_1 \ominus \tilde A_2 = (l_1, m_1, u_1 ) \ominus (l_2, m_2, u_2 ){\rm} = {\rm} (l_1 - {\rm} u_2, {\rm} m_1 - m_2, {\rm} u_1 - {\rm} l_2 )$$
Fuzzy number multiplication ⊗:
 $$\eqalign{\tilde A_1 \otimes \tilde A_2 =\ &(l_1, m_1, u_1 ) \otimes (l_2, m_2, u_2 ){\rm} = {\rm} (l_1 \times l_2, {\rm} m_1 \times m_2, {\rm} u_1 \times u_2 )\cr & \hskip-3{\rm\ for\ the\ } l_i \gt 0,{\rm} m_{\rm i} \gt 0,{\rm} u_{\rm i} \gt 0{\rm} $$
Fuzzy number division ⊘:
 $$\eqalign{\tilde A_1 {\rm \oslash} \tilde A_2 =\ &(l_1, m_1, u_1 ) \oslash (l_2, m_2, u_2 ){\rm} = {\rm} (l_1 /{\rm u}_{\rm 2}, {\rm} m_1 /m_2, {\rm} u_1 /l_2 )\cr &\hskip-3{\rm\ for\ the\ } l_i \gt 0,{\rm} m_{\rm i} \gt 0,{\rm} u_{\rm i} \gt 0$$
4.2. Fuzzy AHP
After fuzzy set theory was introduced, it was used in such areas as forecasting in economic modelling and in decision-making tools. The Analytic Hierarchy Process (AHP) (Saaty, Reference Saaty1977) is one of the most widely used methods for decision making problems, applying a pair-wise comparison matrix. Studies have criticised the AHP method because it could not very well reflect decision makers' judgment (Buckley, Reference Buckley1985; Van Laarhoven and Pedrycz, Reference Van Laarhoven and Pedrycz1983).
Van Laarhoven & Pedrycz (Reference Van Laarhoven and Pedrycz1983), proposed triangular fuzzy numbers to extend the AHP method to the fuzzy-AHP (FAHP) in order to overcome the deficiencies of the fuzziness in decision making. Many studies proposed new approaches to improve FAHP methods by using different algorithms (Bulut et al., Reference Bulut, Duru, Keçeci and Yoshida2012; Gumus, Reference Gumus2009; Dağdeviren and Yüksel, Reference Dağdeviren and Yüksel2008; Mikhailov, Reference Mikhailov2003; Saaty, Reference Saaty2000; Chang, Reference Chang1996; Crawford and Williams, Reference Crawford and Williams1985). In this paper, the extent synthesis method of Chang (Reference Chang1996) is used as the base method and the proposed design is developed by supporting consistency controls and expert prioritization. The Chang (Reference Chang1996) approach is introduced as follows:
Let X={x 1, x 2,…, x n} be an object set and U= {u 1, u 2,…, u m} be a goal set. According to the method of extent analysis, each goal is performed under each object. Therefore, m extent analysis values for each object can be obtained, with the following signs:
 $$M_{g_i} ^1,M _{g_i} ^2,..., M_{g_i} ^m, \quad i = {\rm 1},{\rm 2},...,{\rm} n,$$
where all the M gj (j=1,2,…,m) are TFNs.
The steps of Chang's extent analysis can be given as follows:
Step 1: The value of fuzzy synthetic extent with respect to the ith object is defined as
 $$S_i \sum\limits_{\,j = 1}^m {M_{g_i} ^j} \otimes \left[ {\sum\limits_{i = 1}^n {\sum\limits_{\,j = 1}^m {M_{g_i} ^j}}} \right]^{ - 1} $$
 To obtain $\sum\limits_{\,j = 1}^m {M_{g_i} ^j} $, the fuzzy addition operation of m extent analysis values for a particular matrix is performed such as:
 $$\sum\limits_{\,j = 1}^m {M_{g_i} ^j} = \left( {\sum\limits_{\,j = 1}^m {l_j, \sum\limits_{\,j = 1}^m {m_j,} \sum\limits_{\,j = 1}^m {u_j}}} \right)$$
And to obtain $\left[ {\sum\limits_{i = 1}^n {\sum\limits_{\,j = 1}^m {M_{g_i} ^j}}} \right]^{ - 1} $, the fuzzy addition operation of
  $M_{g_i} ^j $(j=1, 2,…, m) values is performed such as:
 $$\sum\limits_{i = 1}^n {\sum\limits_{\,j = 1}^m {M_{g_i} ^j}} = \left( {\sum\limits_{\,j = 1}^m {l_j,} \sum\limits_{\,j = 1}^m {m_j}, \sum\limits_{\,j = 1}^m {u_j}} \right)$$
and then the inverse of the vector in Equation (5) is computed, such as:
 $$\left[ {\sum\limits_{i = 1}^n {\sum\limits_{\,j = 1}^m {M_{g_i} ^j}}} \right]^{ - 1} = \left( {\displaystyle{1 \over {\sum\limits_{i = 1}^n {u_i}}}, \displaystyle{1 \over {\sum\limits_{i = 1}^n {m_i}}}, \displaystyle{1 \over {\sum\limits_{i = 1}^n {l_i}}}} \right).$$
Step 2: The degree of possibility of M 2= (l 2, m2, u2) ⩾ M 1=(l 1, m1, u1) is defined as
 $$V(M_2 \geqslant M_1 ) = \mathop {\sup} \limits_{y \geqslant x} \left\lfloor {\min (\mu _{M_1} (x),\mu _{M_2} (y))} \right\rfloor $$
and can be expressed as follows:
 $$\eqalign{& V{\rm} (M_2 \geqslant {\rm} M_1 ){\rm} = hgt{\rm} (M_1 \cap {\rm} M_2 ) \cr & = \mu _{M_2} (d) = \left\{ {\matrix{ {1,} & {if} & {m_2 \geqslant m_1,} \cr {0,} & {if} & {l_1 \geqslant u_2,} \cr {\displaystyle{{l_1 - u_2} \over {(m_2 - u_2 ) - (m_1 - l_1 )}},} & {} & {otherwise.} \cr}} \right.} $$
Figure 3 illustrates Equation 8, where d is the ordinate of the highest intersection point D between  $\mu _{M_1} $ and
  $\mu _{M_2} $. To compare M 1 and M 2, we need both the values of V (M 1⩾M 2) and V (M 2⩾ M 1).
Figure 3. The intersection between M 1 and M 2.
Step 3: The degree possibility for a convex fuzzy number to be greater than k convex fuzzy M i (i=1,2,…,k) numbers can be defined by:
 $$\hskip-12\eqalign{V{\rm} (M \geqslant M_{1}, {\rm} M_2, \ldots, {\rm} M_k ){\rm} = & V{\rm} [(M{\rm} \geqslant {\rm} M_1 )\,and\,{\rm} (M \geqslant M_2 ){\rm}\,and\,{\rm}... {\rm} \,and\,{\rm} (M{\rm} \geqslant {\rm} M_k )] \cr = & {\rm min} V{\rm} (M \geqslant {\rm} M_i ),{\rm i} = {\rm 1},{\rm 2},{\rm 3},...,{\rm k}.} $$
Assume that d′(A i) = min V(S i⩾ S k) for k=1,2,…,n; k ≠i. Then the weight vector is given by
 $$W' = {\rm (}d'(A_1 {\rm )},{\rm} d'(A_2 ),...,d'(A_n ))^{\rm T} $$
Where A i (i=1, 2,…, n) are n elements.
Step 4: Via normalization, the normalized weight vectors are
 $$W = {\rm} (d(A_1 ),{\rm} d(A_2 ),...,d(A_n ))^{\rm T} $$
where W is a non-fuzzy number.
Table 2 presents the ranking scale for the fuzzy linguistic comparison terms and Figure 4 displays their fuzzy numbers.
Figure 4. Fuzzy number of linguistic variable set.
Table 2. Membership function of linguistic scale.
4.3. The Proposed Generic Fuzzy Analytic Hierarchy Process Model
Chang's approach to the FAHP method ignores both the weight and consistency control of decision matrices. Also, Chang did not define how to aggregate each individual decision matrix in his proposed method. In the literature, two different methods are used to aggregate the individual matrix of decision makers for the AHP method: individual judgment (AIJ) and the aggregation of individual priorities (AIP) (Forman and Peniwati, Reference Forman and Peniwati1998). Since Ramanathan and Ganesh (Reference Ramanathan and Ganesh1994) stated AIJ violates the Pareto principal of social choice theory, Bulut et al. (Reference Bulut, Duru, Keçeci and Yoshida2012) extended the AIP algorithm for FAHP use.
Bulut et al. (Reference Bulut, Duru, Keçeci and Yoshida2012) proposed the generic fuzzy analytic hierarchy process (GF-AHP) as the choice for the shipping asset variety problem. In this study, the duration of professional career on the ship for each decision maker is considered as the weight vector of decision makers and its computation is as follows:
Let A=(a ij)n×n, where a ij>0 and a ij×a ji=1, be a judgment matrix. The prioritization method refers to the process of deriving a priority vector of criteria w = (w 1, w2,…, wn)T, where w i⩾0 and  $\sum\nolimits_{i = 1}^n {w_i} = 1$, from the judgment matrix A.
Let D = {d 1, d2,…, dm}be the set of decision makers, and λ = {λ 1, λ2,…, λm} be the weight vector of decision makers, where λ t>0, t = 1,2,…,m, and  $\sum\nolimits_{k = 1}^m {\lambda _t} = 1$.
Let E= {e 1, e2,…, em} be the set of the duration in professional career for each decision makers and the algorithm of λ t for each decision maker is calculated by
 $$k_t = \displaystyle{1 \over {CCI_t }}$$
where k t represents knowledge of decision maker and CCI t is the centric consistency index and its calculation is defined in next section.
 $$\lambda _k = \displaystyle{{e_k} \over {\sum\nolimits_{k = 1}^m {e_k}}} $$
 Let A(t) =  $(a_{ij}^{(t)} )_{n \times n} $ be the judgment matrix provided by the decision maker d t.
w i(t) is the priority vector of criteria for each decision maker calculated by
 $$w_i^{(t)} = \displaystyle{{\left( {\prod _{\,j = 1}^n a_{ij}} \right)^{1/n}} \over {\sum\nolimits_{i = 1}^n {\left( {\prod _{\,j = 1}^n a_{ij}} \right)^{1/n}}}} $$
The aggregation of individual priorities is defined by
 $$w_i^{(w)} = \displaystyle{{\prod _{t = 1}^m (w_t^{(t)} )^{\lambda _t}} \over {\sum\nolimits_{i = 1}^n {\prod _{t = 1}^m (w_i^{(t)} )^{\lambda _t}}}} $$
where w i(w) is the aggregated weight vector. Chang's approach to the FAHP method is applied after calculation of the aggregation matrix for each decision maker.
4.3.1. Consistency control
In the existing literature, many studies applied the FAHP method without considering consistency control. However, Saaty (Reference Saaty1977) proposed the consistency ratio (CR) to compute robustness of the decision matrix and acceptance of this is based on its consistency ratio (CR). In this paper, the following algorithm, called the centric consistency index (CCI) (Duru, Bulut, and Yoshida, Reference Duru, Bulut and Yoshida2012), which is a fuzzy extended version of the geometric consistency index (GCI) (Aguarón & Moreno-Jiménez, Reference Aguarón and Moreno-Jiménez2003; Crawford & Williams, Reference Crawford and Williams1985) is used to compute the consistency of each pair-wise matrix.
 $$\eqalign{CCI(A) = &\displaystyle{2 \over {(n - 1)(n - 2)}}\sum\limits_{i \lt j} {\Big({\rm log}} \left(\displaystyle{{a_{Lij} + a_{Mij} + a_{Uij}} \over 3}\right) - {\rm log}\left(\displaystyle{{w_{Li} + w_{Mi} + w_{Ui}} \over 3}\right) \cr & + {\rm log}\left(\displaystyle{{w_{Lj} + w_{Mj} + w_{Uj}} \over 3}\right)\Big)^2} $$
When CCI(A)=0, we consider A fully consistent. Aguarón et al. (Reference Aguarón and Moreno-Jiménez2003) also provide the thresholds  $(\overline {GCI} )$ as
  $(\overline {GCI} )$=0·31 for n=3;
  $(\overline {GCI} )$=0·35 for n=4 and
  $(\overline {GCI} )$=0·37 for n>4. When CCI (A) <
 $(\overline {GCI} )$, it is considered that the matrix A is sufficiently consistent. Since the CCI is a fuzzy extended version of GCI, thresholds remain identical.
5. EMPIRICAL STUDY AND RESULTS
We now use the GF-AHP methodology described in the previous section to assess risk perception of stakeholders in the Istanbul Strait. For this purpose, we used the five different criteria discussed in Section 3 and we conducted face-to-face interviews with a total of 37 stakeholders, including seven ship captains, 15 maritime pilots, and 15 VTS operators. All of these individuals had extensive experience in the Strait.
In the first step, the individual fuzzy judgment matrix is generated as shown in Table 3. The questionnaire method is applied to compute the mean aggregated weight and CCI is found less than the threshold of 0·37 (critical value) meaning all pair-wise matrices are consistent.
Table 3. The individual fuzzy judgment matrix for criteria.
Table 4 shows the results of the individual fuzzy priority vectors and aggregated weight vector. The aggregated weight of each criterion is calculated by considering λ t. After the calculation of the aggregated fuzzy judgment matrix with consideration of the weight of decision makers, the aggregated weight of each criterion reveals that the CR (current) is the most important influence (0·37) for a maritime accident in the Istanbul Strait. The other criteria with their weights are found to be the vessel traffic (0·29), shape of the Istanbul Strait (0·17), pilot existence (0·12), and the ship size (0·06), respectively (Table 5).
Table 4. The individual fuzzy priority vector of decision-makers and aggregated weight vector for criteria.
Table 5. The aggregated fuzzy judgment matrix for criteria.
In the second step, the aggregated fuzzy judgment matrix for the three different areas is calculated for each criteria (Table 6) and is based on the individual fuzzy judgment matrix of decision makers. The mean aggregated weight of area A2 is found mostly superior to other regions except the VT criteria. In addition, the final assessment for assignment of hazardous regions on the Istanbul Strait by using GF-AHP method indicates the area of A2 is the most critical part of Istanbul Strait (Table 7).
Table 6. The aggregated fuzzy judgment matrix for three different hazardous regions.
Table 7. Final assessment for assignment of hazardous region in the Istanbul Strait.
Next, we performed a statistical analysis of maritime accidents such as collision, grounding, fire, human error, or sinking for each region (Figure 5). As can be seen in Figure 5, the highest number of the accidents in the Istanbul Strait took place in area A1 which is primarily due to significant local maritime traffic in that region. The total amount of maritime accidents for the area A1 is computed as 109, and A2 and A3 are found to be 87 and 36, respectively. The collisions, engine-propeller failure, contact, and grounding among others (except human error) caused the most number of accidents, respectively.
Figure 5. Statistical results of the different maritime accidents 2000–2011 in the Istanbul Strait.
The highest numbers of accidents occurred in area A1 with 109 accidents whereas risk perception of A1 is the lowest at a CCI score of 0·26. On the other hand, in area A2, which is perceived to be the most hazardous at a CCI score of 0·46, has experienced a total of 87 accidents. Similarly, the A3 Area has a CCI score higher than A1 at 0·32, yet it has experienced the fewest number of accidents.
6. CONCLUSION
The purpose of this research was to investigate whether risk perception of experienced stakeholders (transit ship captains, maritime pilots, and VTS operators) is consistent with statistical accident data in the Istanbul Strait. To this end, we first divided the Straight into three separate areas, and then applied a generic fuzzy analytical hierarchy process (GF-AHP) method to gain insight into stakeholders’ perception of risk in each one of these areas. We also conducted a basic statistical analysis of maritime accidents for each area. The five risk criteria in our GF-AHP method are sea current (CR), shape of the Istanbul Strait (SI), volume of the local vessel traffic (VT), size of ship (SS), and pilot existence (PE) in accordance with similar previous studies and expert consultation. The influence of these criteria per each area is calculated via a GF-AHP method. Our results indicate that Area A2 is perceived as the most hazardous area on the Strait, followed by Area A3 and then A1. However, statistical maritime accident data tell a different story. Specifically, the highest numbers of accidents occur in Area A1, which is followed by Area A2, and then A3. It appears that stakeholders seem to give ship handling difficulty the highest weight in their risk perception when compared with challenges related to local maritime traffic. In particular, the narrowest part of the Strait is A2 and most critical course alterations take place in this area. In addition, A3 is the area where the sharpest turns take place. Statistical data, on the other hand, indicate that maritime accidents occur most frequently in Area A1 with heavy local traffic where ship handling is relatively straightforward.
This discrepancy can perhaps be explained as follows: in accordance with COLREG Rule 10 and Maritime Traffic Regulations for the Turkish Straits adopted by the IMO (1994), local maritime traffic (which primarily flows in the East-West direction in Area A1) is required to give way to transit traffic (flowing in the North-South direction). Transit ship captains, maritime pilots, and VTS operators are all well aware of this regulation and therefore they do not perceive Area A1 as risky as the other two areas from their own perspectives.
Currently, a government-operated VTS Centre oversees transit traffic in the Straight. This centre assists in providing a safe voyage for transit traffic. However, for the time being, there are no regulatory agencies in charge of the safe operation of local maritime traffic. Lack of such an agency implies that responsibility for safe local traffic largely lies in the hands of individual ferry and boat captains. To make the situation worse, there is a significant asymmetry in the nature of risk in accidents involving local boats and ferries. These vessels transport hundreds of thousands of passengers between the European and Asian sides of the Straight on a daily basis and a serious local traffic accident can be devastating.
Our primary conclusion in this study is that there seems to be a significant room for enhancement of maritime safety by aligning risk perception with statistical information in the Istanbul Straight. In particular, in order to mitigate maritime accidents, Area A1 risk awareness needs to be promoted among stakeholders as well as regulatory government agencies. Regarding the latter, we believe that there is an urgent need for a central authority to provide oversight and impose regulations for safety of local maritime traffic in the Istanbul Straight.


