Introduction
About 95% of animal cell energy is supplied by mitochondria via oxidative phosphorylation (OXPHOS). During OXPHOS, ATP synthase is involved in generating energy to synthesize ATP (Dowling et al., Reference Dowling, Friberg and Lindell2008). Because of thermoregulation, mitochondria are particularly important for organisms living in cold climates (Brand, Reference Brand2000; Ruiz-Pesini et al., Reference Ruiz-Pesini, Mishmar, Brandon, Procaccio and Wallace2004). A previous comparative genomic analysis of the complete mitochondrial genomes of 401 teleosts has shown that the evolution of mitochondrial-encoded protein genes including the ATP6 (ATP synthase Fo subunit 6) gene are influenced by thermal adaptation, and tropical or subtropical fish species have significantly greater dN/dS (Non-synonymous substitution rate/Synonymous substitution rate) than the temperate species (P = 0.007; P = 0.062, paired sample t-test) (Sun et al., Reference Sun, Shen, Irwin and Zhang2011). In addition to teleosts, a growing number of studies indicate that natural selection acts on mitochondrial genes in mammals (Mishmar et al., Reference Mishmar, Ruiz-Pesini, Golik, Macaulay, Clark, Hosseini, Brandon, Easley, Chen, Brown, Sukernik, Olckers and Wallace2003; Xu et al., Reference Xu, Luosang, Hua, He, Ciren, Wang, Tong, Liang, Wang and Zheng2007; da Fonseca et al., Reference da Fonseca, Johnson, O'Brien, Ramos and Antunes2008) and birds (Shen et al., Reference Shen, Shi, Sun and Zhang2009).
Considering the heterogeneity of the marine environment, sea temperature might be an important variable across a wide latitudinal distribution of marine organisms (Gleason & Burton, Reference Gleason and Burton2016). As a result, different water temperatures may generate natural selection in mitochondrial coding genes among different geographic populations. However, there are few studies to evaluate the evolution of mitochondrial coding genes at population level (Xu et al., Reference Xu, Sun, Song, Gao, Han and Shui2017).
The Japanese sand lance, Ammodytes personatus Girard, is widely distributed along both sides of the coast around Japan and throughout the Yellow Sea. This species mostly feeds on plankton, such as copepods and Coscinodiscus (Lin, Reference Lin1994). Ammodytes personatus is a cold-water species and is sensitive to differences in water temperature. When the water temperature increases to 17–20°C during the summer in southern and central Japan, this species performs aestivation (Tomiyama & Yanagibashi, Reference Tomiyama and Yanagibashi2004), which enables A. personatus to live at its southern ‘environmental edge’ (Neill & Miller, Reference Neill and Miller1994). However, no aestivation is observed in Cape Soya (Hamada, Reference Hamada1985), where the annual temperature of the sea surface is not more than 14.26°C (data from NOAA, http://www.nodc.noaa.gov).
The populations of A. personatus in the coastal waters of Japan are influenced by three ocean currents: the Kuroshio Current and Oyashio Current in the Pacific Ocean, and Tsushima Current in the Sea of Japan (Figure 1). The warm Kuroshio Current and the cold Oyashio Current meet each other off the east coast of the Japanese islands, and make a large difference to the surface temperatures of the sea (mean annual temperatures ranging from 14°C to 20°C) (data from NOAA, http://www.nodc.noaa.gov). The Tsushima Current, a branch of the warm Kuroshio Current, moves from south to north through the Sea of Japan. A previous study revealed two distinct lineages in this species, based on the mtDNA control region (Han et al., Reference Han, Yanagimoto, Zhang and Gao2012). The distribution of the two mtDNA lineages showed a strong correlation with sea temperature. However, because of a non-coding feature for the control region of mtDNA, no robust evidence supported local adaptation within this species.

Fig. 1. Sampling localities and schematic map of currents for this study. The data of annual surface sea temperature is available on the NOAA (http://www.nodc.noaa.gov), which is the average sea temperature from sea surface to the depth of 15 metres for each sampling site during 2005–2015. (1) Yellow Sea Warm Current, (2) China Coastal Current, (3) West Korea Coastal Current.
The Japanese sand lance, A. personatus, provides a well-suited case for studying mtDNA evolution in the coastal waters of Japan, because it is sensitive to water temperature and the obvious gradients of sea surface temperature among the different ocean systems surrounding the Japanese islands. In the present study, we focused on the mitochondrial ATP6 gene of A. personatus from eight sea temperature populations to reveal the population structure and genetic connectivity among these regions. We also conducted codon-based analyses to investigate which form of natural selection had acted on the mitochondrial ATP6 gene.
Materials and methods
Sampling and DNA extraction
A total of 174 individuals were collected between 2005 and 2015 from the eight sampling sites in the coastal waters of Japan (Fukuoka, Seto Naikai, Aichi Prefecture, Sendai Bay, Aomori Prefecture and Cape Soya) and the Yellow Sea (Dalian and Qingdao). In addition, samples from the Yellow Sea were collected through a scientific survey in coastal waters by trawl net, and the samples in Japan were collected from local fishing boats. Details of this sampling information are given in Table 1 and Figure 1. Muscle samples were preserved in 95% ethanol before DNA extraction. Genomic DNA was extracted from muscle tissue by proteinase K digestion, followed by a standard phenol-chloroform method (Sambrook et al., Reference Sambrook, Fritsch and Maniatis1982).
Table 1. Sampling data of A. personatus including sample abbreviation (ID), sample size and collection data

Haplotype (h) and nucleotide (π) diversity indices for the ATP synthase Fo subunit 6 (ATP6) region are also given (mean ± SD).
Note: A represents lineage A; B represents lineage B.
The complete sequence of the mitochondrial ATP6 gene (644 bp) was amplified using the primers ATP6F (5′-GCAACAACCTGAAACTGAC-3′) and ATP6R (5′-AGGCTTAAAAGAAGAACAA-3′). These two primers were designed in the present study based on the mitochondrial genome sequence of A. personatus (GenBank accession number: NC_021374). The polymerase chain reaction (PCR) was performed in a thermal cycler under the following conditions: initial denaturation was for 4 min at 94°C, followed by 40 cycles of 45 s at 94°C for denaturation, 45 s at 50°C for annealing, 45 s at 72°C for extension and a final extension at 72°C for 10 min. The PCR product was separated on a 1.5% agarose gel. Then clear PCR products were purified with the Gel Extraction Mini Kit (Watson BioTechnologies Inc., Shanghai) and finally both strands were sequenced. ATP6 gene sequences were deposited in the GenBank database under accession numbers MK452906–MK453044.
Genetic diversity and population structure
Sequences were edited and aligned using DNASTAR software (DNASTAR, Inc., Madison, USA). Molecular diversity indices, such as the number of haplotypes and polymorphic sites, were obtained using the program ARLEQUIN (Ver.3.5) (Excoffier & Lischer, Reference Excoffier and Lischer2010). The Tamura and Nei model (Tamura & Nei, Reference Tamura and Nei1993) was found to be the best model by MEGA 6.0 (Tamura et al., Reference Tamura, Stecher, Peterson, Filipski and Kumar2013). Haplotype diversity (h), nucleotide diversity (π) and their corresponding variances were calculated in ARLEQUIN based on the Tamura and Nei model.
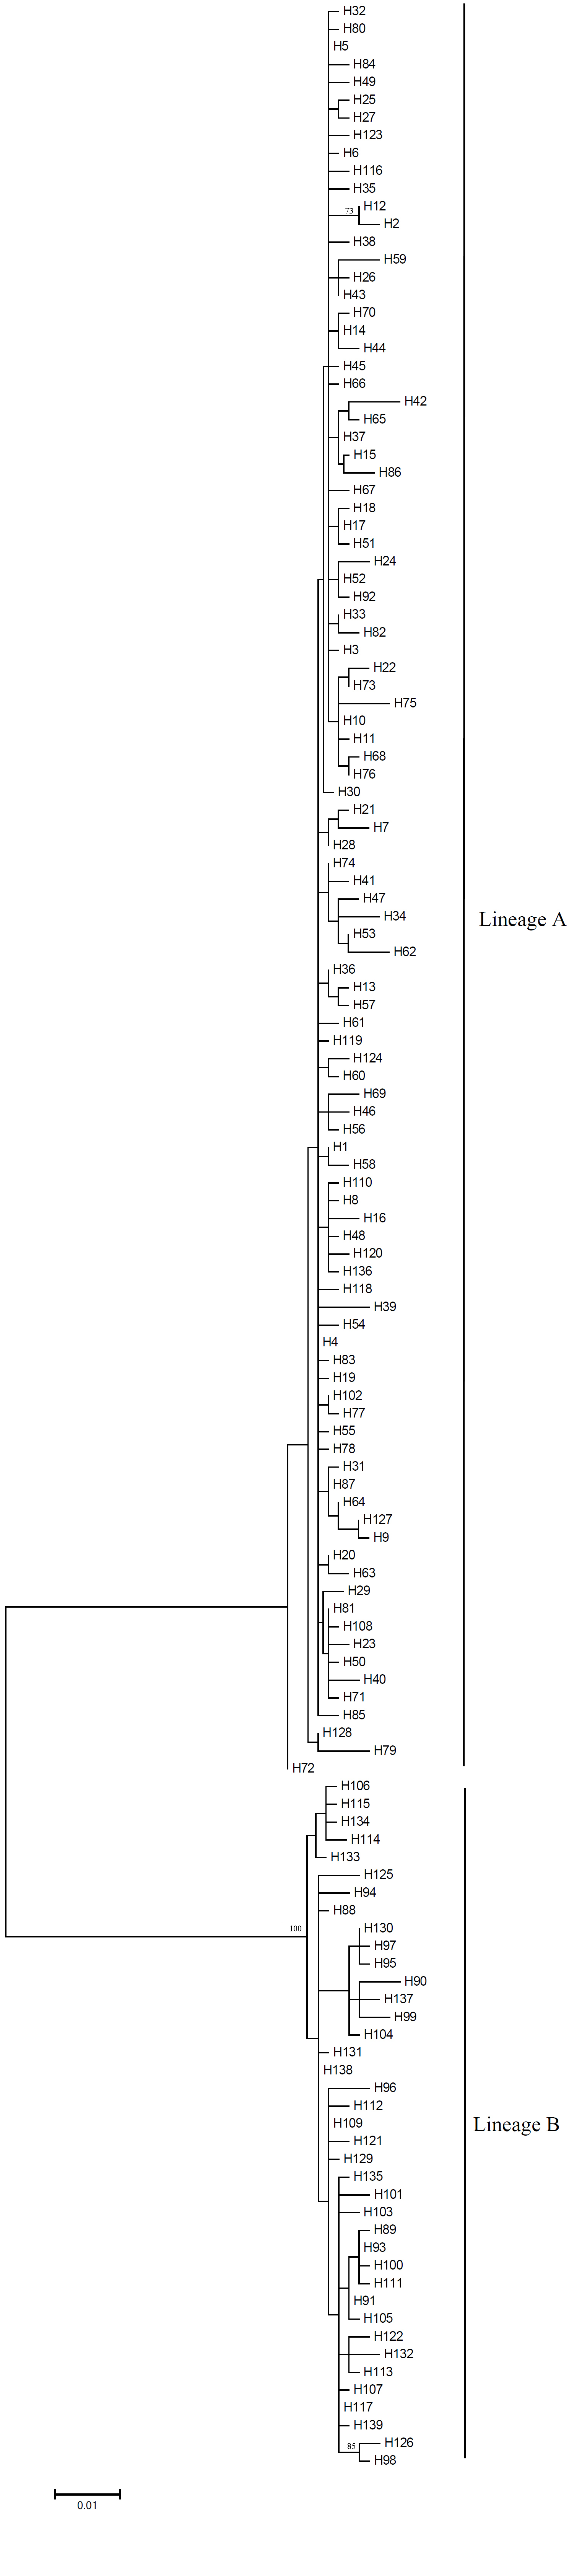
Genetic relationships among haplotypes were reconstructed using the Maximum likelihood method (ML) (Tamura et al., Reference Tamura, Peterson, Peterson, Stecher, Nei and Kumar2011) implemented in MEGA. Genetic distances were generated for phylogenetic reconstruction using the Tamura and Nei model. Bootstrap analysis with 1000 replicates was used to evaluate support for the phylogenetic tree. Since the full tree occupied a great length, a simplified version is shown in Figure 2, and the full tree in supplementary material (Fig. S1).
Genetic differentiation among sample sites was tested by the fixation index, F ST, which was performed in ARLEQUIN. The significance of the F ST was tested by 1000 permutations. The significance of pairwise F ST values was corrected by the false discovery rate method (Benjamini & Hochberg, Reference Benjamini and Hochberg1995). In addition, analysis of molecular variation (AMOVA), performed in ARLEQUIN, was used to examine the population's genetic structure. We conducted the AMOVA analysis with two groups (the southern and northern groups) based on haplotype frequencies (Table 1). The significance of the covariance components associated with the different possible levels of genetic structure was tested using 1000 permutations.

Fig. 2. A simplified version of maximum likelihood tree constructed using Tamura and Nei model for ATP6 haplotypes of A. personatus. Triangles represent the collapsed nodes of the ML-tree.
Historical demographics and neutrality tests
The historical demographic pattern of A. personatus was investigated by neutrality tests (Tajima, Reference Tajima1989; Fu, Reference Fu1997) and mismatch distribution analysis. The D test of Tajima and Fs test of Fu were used to test for neutrality. Significant negative D and F S values could be interpreted as signatures of population expansion or a deviation from neutrality. Historic demographic expansions were investigated by examining the frequency distributions of pairwise differences between sequences (mismatch distribution). The distribution is usually multimodal if population equilibrium is maintained, but it is usually unimodal in populations following a recent demographic expansion and range expansion (Rogers & Harpending, Reference Rogers and Harpending1992). The two neutrality tests and mismatch distribution were applied in ARLEQUIN.
Analyses of natural selection
First, we ensured that every protein coding sequence of ATP6 could accurately be translated into amino acids, and then we compared the amino acids using the MUSCLE algorithm (Edgar, Reference Edgar2004) in MEGA and rendered the matched amino acid sequence back to the nucleotide sequence, which was our desired data. The mitochondrial recombinants were tested using Genetic Algorithms for Recombination Detection (GARD) analysis (Kosakovsky Pond et al., Reference Kosakovsky Pond, Posada, Gravenor, Woelk and Frost2006) implemented in the online server http://www.datamonkey.org (Delport et al., Reference Delport, Poon, Frost and Kosakovsky Pond2010). The CODEML algorithm (Yang, Reference Yang2007) for selection inference was applied to our data to calculate the non-synonymous/synonymous substitution rate ratio (ω = dN/dS), which was analysed with the PAML package. A synonymous substitution means that nucleotide mutations do not generate amino acid changes, while non-synonymous substitutions are nucleotide mutations that cause amino acid changes. The ω value could be used to distinguish among neutral evolution (ω = 1), purifying selection (ω < 1) and positive selection (ω > 1). Model 1 was conducted between the lineages in the present study, which allowed the overall substitution rate and the ratio of dN/dS changes to have branch-specific values.
Results
Genetic diversity and population structure
From the 185 individuals analysed for the ATP6 gene, there were 149 polymorphic sites with 137 transitions, 31 transversions and 0 indels, yielding 139 haplotypes (Table 1), 15 amino acid variable sites and 14 amino acid type sequences (Table 2). The mean pairwise difference of amino acids was 1.7798 ± 0.4334 (data not shown). Obviously, the haplotype diversity (from 0.9701 to 0.9952) was high for all populations, while the nucleotide diversity for lineage B was higher than that of lineage A (Table 1).
Table 2. Amino acid substitutions in the mitochondrial fragment of ATP6 gene of A. personatus

NA, NB and NT represent the number of lineage A, lineage B and total individuals, respectively. Shading shows differences between amino acid positions.
The ML tree revealed two distinct haplotype lineages in this species based on the mitochondrial ATP6 gene (Figure 2). The net divergence between two lineages was 0.095. Clear geographic differences in the haplotype frequencies were revealed (Figure 3; Table 1). Lineage A appeared in all populations, but it was the unique type in FU, SN, AI, QD and DL populations. Although Lineage B was not found in the southern sea area, it dominated the three northern populations, SB, AO and CS. The distribution of the two mtDNA lineages varied with the changes of annual sea temperature and exhibited a genetic cline toward the north of Japan (Figures 1 and 3). Besides, it should be noted that lineage B did not appear in the Yellow Sea populations QD and DL, which had similar annual sea temperatures to the northern populations. Finally, based on the geographic differences in the haplotype frequencies and the sea temperature, populations of FU, SN, AI, QD and DL were classified into the southern group, and the others were put into the northern group.

Fig. 3. Haplotype frequencies for populations of A. personatus based on mitochondrial ATP6. Black circle represents lineage A and white one represents the lineage B.
A significant genetic structure with 75.60% of genetic variation between groups (P = 0.016) was revealed by the AMOVA (Table 3). A small (0.51%) and not significant (P = 0.150) genetic variation was found among the sampling sites within groups. In order to reveal the genetic differentiation among sampling sites, we considered their pairwise F ST. The result showed that the pairwise F ST values between sample sites ranged from −0.026 to 0.815, and all of the values were high and significant between the southern and northern groups (P < 0.01) (Table 4). None of the pairwise F ST values between sampling sites within groups were significant.
Table 3. Results of the AMOVA of the south group and north group of A. personatus

Table 4. Pairwise F ST (below diagonal line) and P (above diagonal line) values among sampling sites of A. personatus

*Represent significant values corrected by false discovery rate.
Historical demographics
A plot of the mismatch distribution that included all individuals resulted in a bimodal curve, which could be accounted for by the structuring of the different groups of haplotypes (Figure 4A). When only lineage A or lineage B samples were included, the curve was unimodal (Figure 4B, C), which supported a model of sudden expansion. All of the results did not deviate significantly from the demographic expansion model (P > 0.05), which indicated they could be used to analyse historical demographics. The results of neutrality tests for lineage A were negative and significant (Tajima's D = −2.51, P < 0.01; Fu's Fs = −25.57, P < 0.01), and the results for lineage B were also negative and significant (Tajima's D = −1.95, P < 0.01; Fu's Fs = −25.37, P < 0.01) (Table 5). Both of the mismatch distribution and neutrality tests showed that the two lineages had experienced demographic expansions.

Fig. 4. Mismatch distribution of all populations (A), lineage A (B) and lineage B (C). The observed pairwise difference (bars), and the expected mismatch distributions under the sudden expansion model (solid line) of ATP6 haplotypes in A. personatus.
Table 5. Tajima's D and Fu's Fs, and their corresponding P-value

Recombination and selection
No evidence for recombination was found with GARD. The dN/dS values of lineage A and lineage B were 0.0384 and 0.0167, respectively. Both lineages’ values were less than one, showing that the ATP6 gene was under strong purifying selection. The dN/dS value of lineage A was much larger than that of lineage B, indicating that individuals in lineage A were under relaxed purifying selection.
Discussion
Several previous studies have investigated the population structure of A. personatus through different molecular markers (Kim et al., Reference Kim, Park and Kim2006; Ren et al., Reference Ren, Hu, Bao, Jiang and Gao2009; Han et al., Reference Han, Yanagimoto, Zhang and Gao2012). Two distinct lineages were found in A. personatus, and their frequency exhibited a genetic cline with the sea temperature around Japan, consistent with the previous study (Han et al., Reference Han, Yanagimoto, Zhang and Gao2012). The two mtDNA lineages did not represent two new species. A previous study had performed morphological analysis of northern individuals, which contained two lineages, and showed high similarity between them (Ji et al., Reference Ji, Gao, Chen and Yanagimoto2006), indicating the absence of new species. Generally speaking, the genetic diversity of the ancestral population was higher than the derived one (Savolainen et al., Reference Savolainen, Zhang, Luo, Lundeberg and Leitner2002). The nucleotide diversity of lineage B was much higher than that of lineage A, supporting the idea that the ancestral type of this species inhabited northern waters (Hashimoto, Reference Hashimoto1991). This distribution pattern of two lineages might be related to the consequence of secondary contact (Han et al., Reference Han, Yanagimoto, Zhang and Gao2012) and then maintained by the selective pressure of sea temperature, as has been shown in Atlantic herring (Teacher et al., Reference Teacher, André, Merilä and Wheat2012).
In terms of geographic distribution, lineage A became the unique one in the southern group, supporting its origin from the southern coastal of Japan. Since lineage B adapted to lower sea temperatures, it was more competitive in colder regions and dominated the northern group. However, it was absent in the Sendai Bay populations, even though the sea temperatures of QD and DL were suitable for its maintenance. Considering the long pelagic larval stage of A. personatus, this clear demarcation for lineage B indicated that it could not span the high sea temperature zone to reach Yellow Sea areas. The AMOVA and pairwise F ST values showed significant genetic structures between the groups, but non-significant within groups (P = 0.15). The results of the mismatch distribution and neutrality tests indicated that the two lineages had experienced demographic expansions, which correspond to the result based on the mitochondrial control region (Han et al., Reference Han, Yanagimoto, Zhang and Gao2012).
Small pelagic fishes are ectothermic and their metabolic rates vary with change of water temperature (Elliott, Reference Elliott1976). As mentioned above, ~95% of cell energy is supplied by mitochondria via OXPHOS; the process of using a generated energy gradient to synthesize ATP is closely related to ATP synthase (Dowling et al., Reference Dowling, Friberg and Lindell2008). Individuals who live in colder zones need greater heat production to maintain or elevate their body temperatures (Benzinger et al., Reference Benzinger, Pratt and Kitzinger1961; Dickson & Graham, Reference Dickson and Graham2004). It was reasonable to assume that the mitochondrial coding genes of fish living in colder zones had undergone stronger selective constraints to eliminate deleterious mutations in order to maintain their normal functions. This expectation was confirmed by the study of Sun et al. (Reference Sun, Shen, Irwin and Zhang2011), in which dN/dS values of fishes living in a cold environment were smaller than those of tropical fishes. Another study on Sebastiscus marmoratus Cuvier also supported this deduction (Xu et al., Reference Xu, Sun, Song, Gao, Han and Shui2017). The mean dN/dS value of ATP6 and Cytb genes in the South China Sea population of S. marmoratus was larger than that of other populations in the Yellow Sea and East China Sea.
In addition to the energy requirement generating possible natural selection in mtDNA coding genes, body fitness might also influence the selection of mtDNA coding genes. The fitness of fish individuals decreased when they lived on the edge of their physiological capacity (Johnson & Kelsch, Reference Johnson and Kelsch1998). Therefore, relaxed selection might occur and drive the evolution of mitochondrial genes by affecting DNA regions under relaxed functional constraints (Jacobsen et al., Reference Jacobsen, da Fonseca, Bernatchez and Hansen2016). Considering the preferred temperature of the cold-water species A. personatus, individuals inhabiting colder zones might maintain a higher fitness than those in temperate zones. Based on the living fitness interpretation, the dN/dS values for lineage B individuals under relaxed selection ought to be larger than those of individuals under strict selection. Two opposite, but reasonable, expectations were raised for this species. The present results supported the first expectation, and rejected the second. The dN/dS value of lineage A was much larger than that of lineage B based on mitochondrial ATP6 sequences, indicating that the A. personatus living in colder zones experienced stronger selective pressure. Our study provides robust evidence for natural selection of the mtDNA coding genes and shows that temperature is a major selective force acting on the mitogenome of fish species, including cold water species.
Past population genetics and phylogeography studies in marine fish usually ignored the potential for climate selection in the mtDNA. The cases of deviation of neutrality revealed in the demographic analysis by Tajima's D and Fu's tests were mainly interpreted as population expansions. In marine fish, several studies account for the non-neutrality of mtDNA to explain the genetic patterns detected (Silva et al., Reference Silva, Lima, Martel and Castilho2014; Xu et al., Reference Xu, Sun, Song, Gao, Han and Shui2017). Many more instances of selection may be hidden in the demographic analysis and remain unreported. Neutrality assumptions may have compromised the studies' interpretations and biased their conclusions. It is necessary that future studies focusing on the mtDNA coding gene properly evaluate the putative role of selection during data analysis.
Supplementary material
The supplementary material for this article can be found at https://doi.org/10.1017/S0025315419000225.
Acknowledgements
We sincerely thank the reviewer for the constructive criticisms and valuable comments.
Financial support
The research was funded by the National Natural Science Foundation of China (31472281).