


NOMENCLATURE
- a
speed of sound
- C f
skin friction coefficient
- D
measuring plane width
- h
ramped-vane height
- H
incompressible shape factor
- K
time- and spanwise-averaged turbulent kinetic energy
- L
measuring plane height
- M
Mach number
- P
time- and spanwise-averaged static pressure
- Re
Reynolds number
- u
instantaneous streamwise velocity
- U τ
frictional velocity
- U
time- and spanwise-averaged streamwise velocity
- x
streamwise coordinate
- y
transverse coordinate
- z
spanwise coordinate
- Δx
streamwise length of computational cell
- Δy
transverse length of computational cell
- Δz
spanwise length of computational cell
- δ
=boundary layer thickness at x=0
- δ*
=displacement thickness
- µw
molecular viscosity at wall
- ρ
fluid density
- τ
time interval for averaging
- τw
wall shear stress
- θ
momentum thickness
Superscripts
- +
dimension in wall units
- ¯
time-averaged quantity
- ‘
fluctuation component
Subscripts
- avg
time-average
- max
maximum
- min
minimum
- RMS
root mean square
- sep
area of flow separation
- VD
Van Driest transformation
- w
wall
- ∞
freestream
1.0 INTRODUCTION
Shock boundary layer interactions (SBLI) are prevalent phenomena in wall-bounded turbulent flows in the supersonic regime and are of particular concern for super/hypersonic inlets. The adverse pressure gradient and the impinging shock interacting with the turbulent boundary layer may lead to a flow separation bubble, which can reduce the effective cross-sectional area and cause inlet choking. One of the adverse features from the shock-boundary layer interaction is that it can produce a low-frequency motion of the shock surface( Reference Smits and Dussauge 1 ). A number of experimental studies have proposed that the passage of upstream-elongated structures in the boundary layer that have an appearance of unwound coils are the primary cause of the large-scale instability as these structures perturb the shock surface and promote shock unsteadiness and flow separation( Reference Ganapathisubramani, Clemens and Dolling 2 – Reference Clemens and Narayanaswamy 4 ). Similarly, correlations between the upstream structures and the low-frequency unsteadiness of the shock position have been observed in numerical investigations by Wu and Martin( Reference Wu and Martin 5 ) using Direct Numerical Simulation (DNS) and Rizzetta et al.( Reference Rizzetta, Visbal and Gaitonde 6 ) and Edwards et al.( Reference Edwards, Choi and Boles 7 ) using and Large Eddy Simulation (LES). A study by Pirozzoli and Grasso( Reference Pirozzoli, Bernardini and Grasso 8 ) reported that the cause of the low-frequency shock unsteadiness is due to a resonance mechanism in which the incoming structures in the upstream boundary layer interacts with the incident shock tip.
In order to mitigate the adverse effects of flow separation and shock unsteadiness, several flow control methods have been demonstrated to yield significant improvements. The standard flow control method employed in the aerospace industry for SBLI is to bleed the flow at the shock interaction region. The bleeding method reduces the flow separation region and increases the flow uniformity downstream of the interaction zone. However, a sizable amount of incoming flow mass has to be removed, which results in an increased inlet size leading to an overall drag increase( Reference Loth 9 ). Recent efforts to create a “bleed-less” inlet have considered plasma actuation flow control using direct-current- and dielectric-barrier- discharge and magnetically driven surface discharge( Reference Kalra, Shneider and Miles 10 – Reference Webb, Clifford and Samimy 12 ). Up to 75% reduction in the shock-induced separation length was found in a recent study( Reference Bisek, Rizzetta and Poggie 13 ) and a further reduction in the low-frequency content of the turbulent kinetic energy spectra was observed. However, such systems may introduce additional complexities due to the electronic actuation system.
A promising technique to control the SBLIs without bleed or electronic actuation is to use vortex generators (VG) which introduce streamwise vorticity that has been shown to reduce the flow separation for both subsonic and supersonic flows. Compared with the bleed approach and the plasma actuation, the VGs have the obvious advantages in that neither flow mass removal nor actuation energy is required. The VG streamwise vortices effectively entrain the high-momentum flow from the upper portion of the boundary layer to the near wall region which promotes the mixing of higher momentum fluid that can reduce flow separation caused by the adverse pressure gradient. However, the VGs for a supersonic flow must be designed carefully to avoid the wave drag while retaining the mechanical robustness. An experimental study by Blinde et al.( Reference Blinde, Humble, van Oudheusden and Scarano 14 ) found that a set of low profile vortex generators in the form of a triangular ramp can reduce the flow separation length and the shock motion by 20%. Another experimental study by Verma et al.( Reference Verma, Manisankar and Raju 15 ) found that the triangular ramps significantly reduced the peak pressure value at the separation zone up to 50%. However, a number of studies by Babinsky et al.( Reference Babinsky, Li and Pitt-Ford 16 ) and Ghosh et al.( Reference Gosh, Choi and Edwards 17 ) have achieved negligible improvements using the ramp type device. While these devices were able to deform the separation region, reducing the separation area was not effective. The three-dimensionality of the separation zone amplified by the vortex generators was also confirmed by Bruce et al.( Reference Bruce, Burton, Titchener and Babinsky 18 , Reference Bruce, Burton, Titchener and Babinsky 19 ), Titchener and Babinsky( Reference Titchener and Babinsky 20 ), and Titchner and Babinsky( Reference Titchener and Babinsky 21 ) with no significant improvement in reducing the shock induced flow separation.
On the other hand, a different type of VG reported by Barter and Dolling( Reference Barter and Dolling 22 ) found that the Wheeler doublet vortex generators, a relatively thin vane-like device, effectively reduced the flow separation and decreased the wall pressure fluctuations. In particular, when using the vane type VG, surface-flow visualizations by Holden and Babinsky( Reference Holden and Babinsky 23 ) exhibited a full removal of shock-induced separation. In general, the efficacy of these VGs is better in the transonic regime compared with the higher Mach number flows. The most successful results were obtained with the vane type and a further review on VGs can be found in the work of Titchener and Babinsky( Reference Titchener and Babinsky 24 ). While many vortex generator designs are possible, a device that combines both the merits from the vane type and the structural integrity recently proposed by Lee and Loth( Reference Lee and Loth 25 ) is the ramped-vane (RV). Subsequent experiments have shown that such a device generates stronger streamwise vortices when compared other VGs( Reference Rybalko, Babinsky and Loth 26 ). For example, the present RV is similar to the delta wing device of Godard and Stanislas( Reference Godard and Stanislas 27 ), but incorporates a wide leading edge equal to the device height to increase the structural robustness. However, a key issue to employing the device in a practical inlet setting is to understand the impact of device size with respect to the boundary layer, as the size is generally the most important controlling parameter of VG efficacy( Reference Ashill, Fulker and Hackett 28 ).
As such, the present study aims to investigate the impact of the RV size on the changes in the turbulent structures within the boundary layer, the mitigation of the pressure unsteadiness, and the uniformity of the boundary layer using the Implicit Large-Eddy Simulation (ILES)( Reference Boris 29 ) approach. It should be noted that Rybalko et al.( Reference Rybalko, Babinsky and Loth 26 ) experimentally investigated the RV size effect with similar dimensions as studied in this paper, but the results were highly influenced by the strong side-wall interactions as shown in Fig. 1. The present study is the first numerical investigation of the impact of device size for the ramped-vanes (the geometry which showed the most success of all VGs previously studied( Reference Lee, Loth and Babinsky 30 )) on reducing shock-induced flow separation and the associated shock unsteadiness without a side-wall effect. In addition, the beneficial changes in the incompressible shape factor and the displacement thickness with the respective increment of the RV size were investigated. These attributes that enhance the uniformity of the flow can improve the performance of a supersonic inlet. The reduction in the turbulent kinetic energy distribution was discussed, as well. The flowfield employed to investigate such effects is a normal shock boundary layer interaction followed by a subsequent subsonic diffuser, which is a flow that has been shown to have the critical features associated with supersonic inlets( Reference Loth, Titchener, Babinsky and Povinelli 31 ).
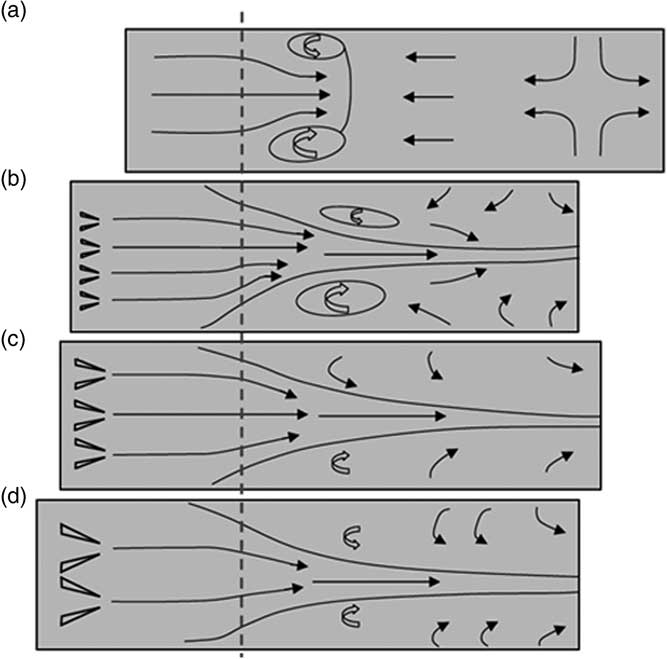
Figure 1. Schematics of primary flow features: (a) no flow control device and RVs with a height of (b) 0.38δ, (c) 0.57δ and (d) 0.75δ.
2.0 COMPUTATIONAL METHODOLOGY
2.1 Numerical scheme
The present study employed the WIND computational code, which was developed at the U.S. Air Force’s Arnold Engineering Development Center and the NASA Glenn Research Center as a finite-volume solver for compressible flows( Reference Bush, Power and Towne 32 ). For the current simulations, the code was enhanced to allow a turbulent inflow boundary based on the rescale-recycle method( Reference Urbin and Knight 33 , Reference Lund, Wu and Squires 34 ) and the ILES approach( Reference Boris 29 ). The ILES approach eliminates the inclusion of the sub-grid stress (SGS) model, which was found to be reasonable for compressible flows( Reference Kawai, Shankar and Lele 35 , Reference Visbal and Rizzetta 36 ), whereby the SGS model provided an unnecessary additional numerical dissipation in the resolved turbulence( Reference Li and Wang 37 ). A fifth-order upwind-biased scheme( Reference Courant, Isaacson and Rees 38 ) was used and the WIND code was further modified to include the Superbee limiter( Reference Roe and Pike 39 , Reference Laney 40 ) which is more transparent compared with other limiters and the upwind-biased scheme was sufficient to suppress numerical oscillations caused by shock waves. This combination (rescale-recycle with ILES and Superbee limiting) has been shown to yield strong agreements with the direct numerical simulations and the experimental results for the supersonic boundary layers interacting with the normal and oblique shock waves as demonstrated by Urbin and Knight( Reference Urbin and Knight 33 ). These previous simulations, as well as the present simulations, also used the second order approximate factorization scheme for the time integration( Reference Beam and Warming 41 ) with three steps of sub-iterations (Newton–Raphson iteration) to minimize errors due to the linearization in the implicit scheme. The time step for the current simulation was based on the Courant number (CFL), defined as Δt(a ∞+U ∞)/Δx, of 0.4, where Δt is the time-step, Δx is the smallest streamwise cell length, while a ∞ and U ∞ are the speed of sound and streamwise velocity at freestream conditions, respectively.
2.2 Computational domain, boundary conditions and grid resolution
The dimensions of the computational domain are shown in Fig. 2 in terms of the boundary layer thickness (δ), defined as that measured at x=0 for the baseline solid-wall case (no VGs). The location (x=0) was also used as the location of the VG trailing edge when the flow control devices were investigated. The total computational domain had a length of 106.1δ, a height of 34.5δ and a width of the domain (D) was 5.2δ. The incoming flow Mach number was 1.3 with a Reynolds number of 2400 based on the momentum thickness at the exit of the recycling zone. The length of the upstream recycling zone was 16.8δ (4020 wall units based on the frictional velocity at the recycling plane at x=–5.3δ) to ensure a full development of the turbulent eddies. These streamwise and the spanwise lengths were substantially longer than the recommended lengths reported by Lund et al.( Reference Lund, Wu and Squires 34 ) to help minimize any potential memory issues associated with the streamwise periodicity in the flow( Reference Parmies, Weiss, Garnier, Deck and Sagaut 42 ).
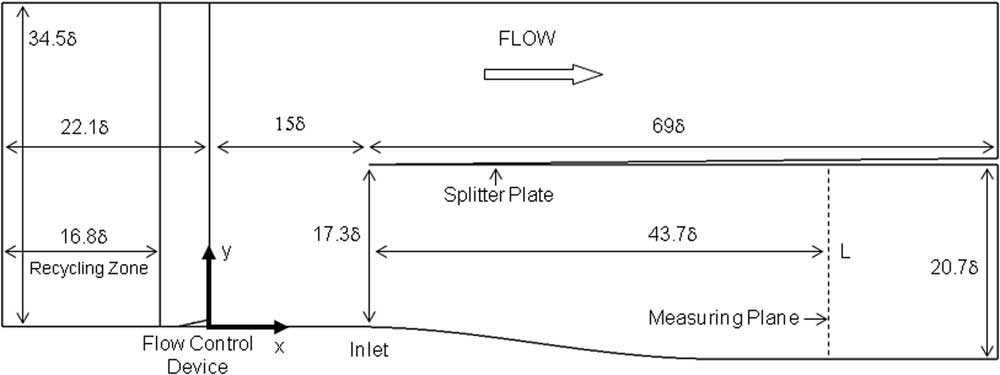
Figure 2. Spanwise cut of computational domain with key dimensions in terms of incoming boundary layer thickness.
The trailing edge of the VG device (x=0) was placed at 5.3δ downstream of the exit of the recycling zone, and was 15δ upstream of the tip of the splitter plate, which also served as the start of the subsonic diffuser inlet. The dimensions of the flow control device are shown in Fig. 3(a) and the three different RV heights (h=0.34δ, 0.52δ and 0.75δ) are shown in Fig. 3(b). The spacing between the adjacent RVs is illustrated in Fig. 4 which was approximately three times the RV width at the leading edge. The device was similar to the subsonic vanes that have a pair of thin plates but the leading edges of the vanes were wide for structural durability. The internal angle of 16° (Fig. 3(b)) was selected based on the optimal performance for subsonic applications reported by Pearcey( Reference Pearcey 43 ), although the flow at higher speeds can marginally change the optimal internal angle. The separation distance between the two wings of the device was determined by several trials of LES simulation( Reference Lee, Loth and Babinsky 30 ) that maximised the reduction of the shock induced flow separation. The smaller device height compared with the boundary layer was to significantly reduce the wave drag. However, studies by Holmes et al.( Reference Holmes, Hickey, Murphy and Hilton 44 ) and McCormick( Reference McCormick 45 ) reported that these sub-boundary layer devices can offer similar benefits to those of traditional VGs. The diffuser inlet height was 17.3δ which expanded to 20.7δ at the data extraction plane, denoted as the “Measuring Plane” (MP) and this was located 43.7δ downstream of the inlet (x=58.7δ). The basis of the diffuser design was performed in a previous study( Reference Loth, Titchener, Babinsky and Povinelli 31 ).
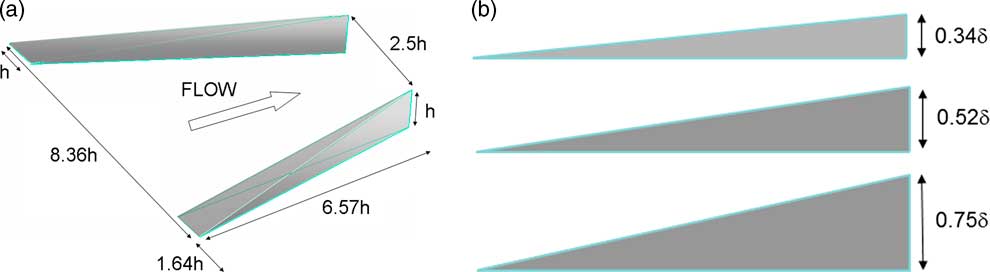
Figure 3. Schematic of the ramped vane: (a) key dimensions in terms of δ and (b) height of the three ramped vanes.
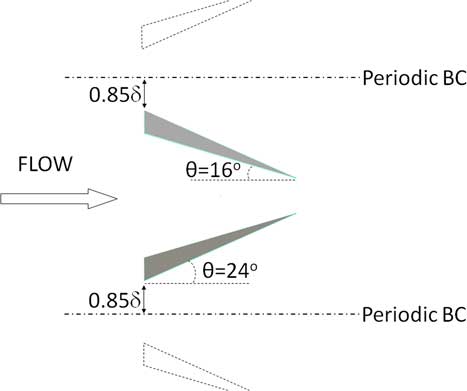
Figure 4. Schematic of the ramped vane interior and exterior angles.
No-slip and adiabatic wall conditions were imposed on the bottom wall and the vortex generator surface while the splitter plate was set with the adiabatic slip-wall condition. The far-field boundary was specified with the zeroth-order extrapolated flow variables. A constant pressure outflow boundary condition was imposed at the exit of the diffuser to ensure a subsonic flow condition, by causing a normal shock to be located just upstream of the splitter plate. The span-wise coordinate z was 0 at the centre-line and a periodic boundary condition was imposed along the sidewalls, i.e. at z=±2.6δ. The periodicity emulates an infinite spanwise array of flow control devices and planar diffuser and thus eliminated the complexity associated with the side-wall effects( Reference Burton and Babinsky 46 ).
The computational grid for the present study was based on a previous oblique SBLI study( Reference Lee, Goettke, Loth, Tinapple and Benek 47 ) on a coarser grid with the similar flow conditions, which reproduced the experimental results such as the mean velocity and the stagnation pressure profiles as shown in Fig. 5. In the present study, the grid was further refined with the availability of the computational resource without diminishing the physics. The initial wall normal resolution was specified as Δy min +=0.9, while the streamwise and spanwise grid cell lengths were specified as Δx +=28 and Δz +=6.5 (these wall units were based on the frictional velocity and the wall kinematic viscosity at the end of the recycling zone). The grid points were distributed in the wall-normal direction according to a hyperbolic tangent mapping, which yielded approximately 30 grid points within the boundary layer. As addressed by Adams( Reference Adams 48 ), the coarsening mesh in the wall normal direction allowed the numerical diffusion to filter the spurious reflections from the upper boundary, which effectively avoided the feedback of pressure disturbances. It should be noted that the above resolution was applied to all zones except for the ones containing the device, where the cell sizes were reduced further to conform to the device geometry. The total number of grid points was approximately 11 million. The numerical approach used in the present study successfully reproduced the experimental result in similar previous studies( Reference Lee, Goettke, Loth, Tinapple and Benek 47 , Reference Lee and Loth 49 ).
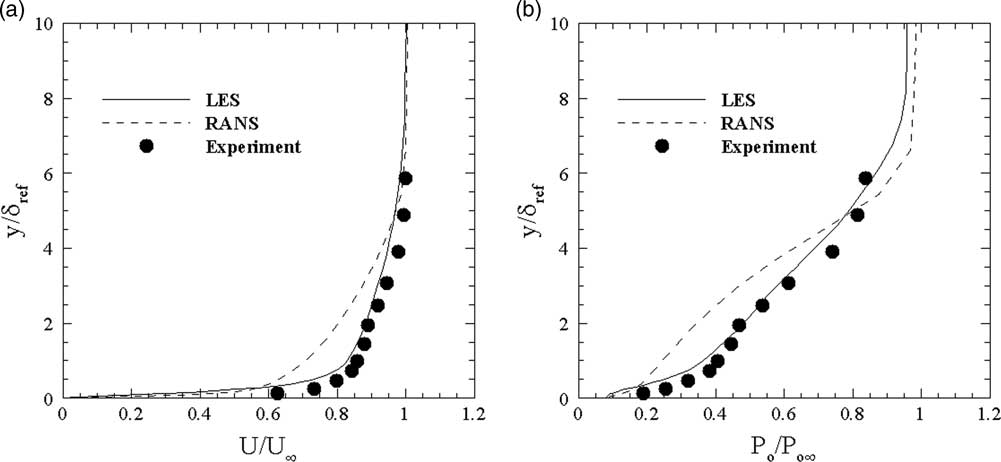
Figure 5. Time-averaged profiles of (a) streamwise velocity and (b) total pressure which are compared with RANS result and experiment( Reference Wu and Martin 5 ).
3.0 RESULTS
3.1 Shock interaction with turbulent boundary layer
The vortices generated by the flow devices were studied to better understand their impact on the structures of the turbulent eddies and the shock-induced flow separation. In addition, the boundary layer in the diffuser was characterized by examining the skin friction, the pressure, the incompressible displacement thickness and the incompressible shape factor to evaluate the beneficial aspects of the flow control device. The instantaneous iso-surfaces of the λ2 vortex parameter( Reference Jeong and Hussain 50 ) are shown in Fig. 6 for (a) no-device (ND), (b) small ramped vane (RV34 with 0.34δ), (c) medium ramped vane (RV52 with 0.52δ) and (d) large ramped vane (RV75 with 0.75δ). It can be seen that the turbulent structures were substantially morphed by the presence of the shock and by the flow control device. With respect to the shock interaction, Fig. 6(a) shows that the elongated vortical structures were dominant in the upstream region, which is typical for a zero-pressure gradient turbulent boundary layer flow( Reference Ganapathisubramani, Clemens and Dolling 3 ) but were shortened and disrupted after they were impacted by the shock( Reference Wu and Martin 51 ). This was due to the flow reversal at the shock impingement, and it can be seen that these structures recover and reappear further downstream.
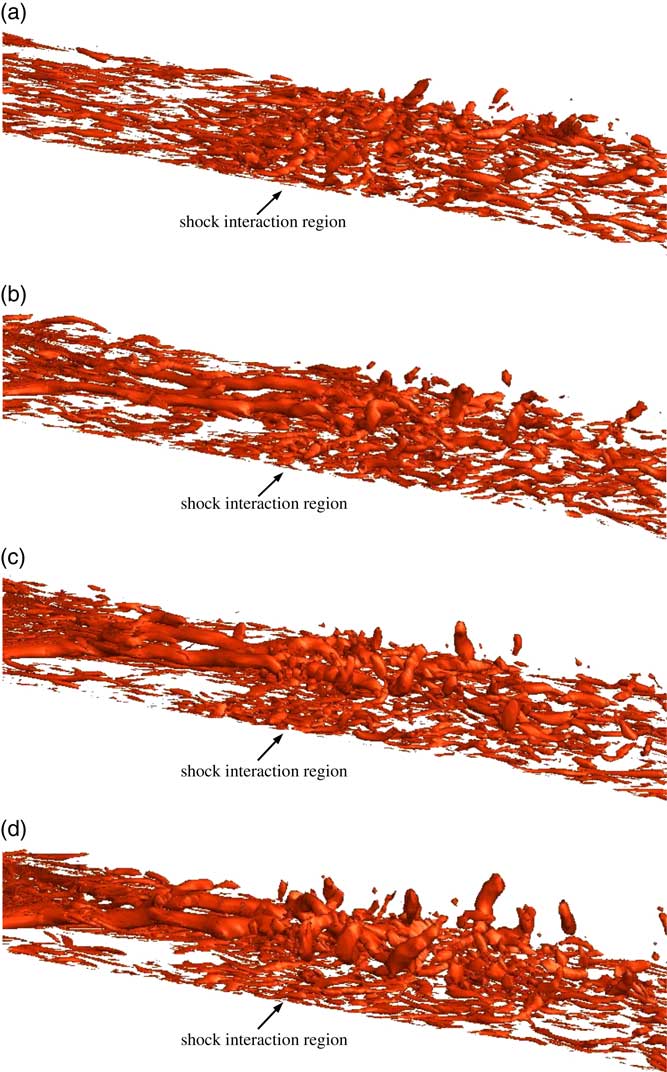
Figure 6. Iso-surface of instantaneous vortical structures is shown for (a) ND, (b) RV34, (c) RV52 and (d) RV75.
The addition of the ramped vanes (Figs. 6(b–d)) can be seen to lead to a pair of counter-rotating streamwise vortices whose diameter and coherency increased as the device size increased. The vortices tended to reduce the amount of naturally occurring streamwise structures closer to the wall, indicating that the VGs were dominating the flow entrainment in the SBLI region. In addition, it can be seen that the larger devices produced the counter-rotating vortices that were increased in size and raised from the wall in the separated flow region (middle of these images). This was attributed to the larger device impacting the fluid at higher speeds and higher wall-normal locations.
3.2 Near wall features
The impact of the flow control device on the near-wall flow by the entrainment mechanism and the flow separation can be better seen in the velocity contours at y +~0.9 in Fig. 7. For the instantaneous contours of the No Device case (Fig. 7 – ND row), moderately high- and low-speed streaks are seen before the shock interaction, followed by a significantly lower speed fluid (in blue) during and downstream of the shock region. In contrast, the cases with the upstream ramped vanes indicate strong low-speed streaks between the ramps (especially as the device size increases) combined with high-speed streaks behind the devices, and then followed by a reduction in the low-speed streaks in the region downstream of the shock (especially as the device size increases). In the second column in Fig. 7, where the mean flow reversal regions are shown in dark streaks, are consistent with the increase in flow separation upstream between the ramped vanes as well as the reduction in flow separation downstream of the shock interaction. In particular, the influx of high momentum flow near the wall caused by the streamwise vortices for RV75 substantially reduced the flow reversal patches over the entire span of the domain, as only a small amount of flow separation was noted close to the ramp trailing edges for RV75. However, the entrainment actions incurred by the primary vortices for RV34 and RV52 had insufficient strength to remove the flow reversal regions away from the centreline.
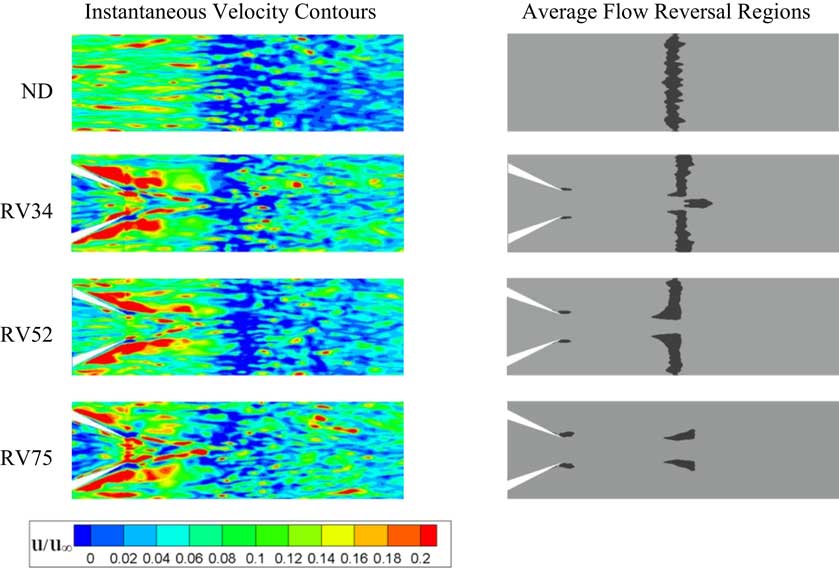
Figure 7. Velocity contours at y +~0.9 over a streamwise distance of x=-18.4δ to 2.1δ for ND, RV34, RV52 and RV75.
The high-momentum flow entrainment that reduced the shock-induced separation can have further benefits in the diffuser section by allowing a higher skin friction within the boundary layer. This is quantified with the skin friction coefficient denoted as C f, which is defined in the following equation.
 $$C_{f} {\equals}{{\tau _{w} } \over {{1 \over 2}\rho _{\infty} U_{\infty}^{2} }}$$
The wall shear stress, τw, is defined by µw(∂U/∂y)w, where µ w is the molecular viscosity at the wall and (∂U/∂y)w is the velocity gradient component normal to the wall. Both the wall shear stress and the velocity gradient are time- and spatially averaged quantities. The shear stress is normalized by ½ ρ∞U∞ 2, where U ∞ is the freestream velocity and ρ ∞ is the density at freestream to create the non-dimensional value of Equation (1). As shown in Fig. 8, the skin friction upstream of the shock interaction and even inside the shock interaction was not significantly affected by the devices. However, the skin friction recovered more quickly to positive values for the ramped vane cases, especially for the larger device. These benefits continued for at least 50 boundary layer thicknesses downstream of the shock interaction region.
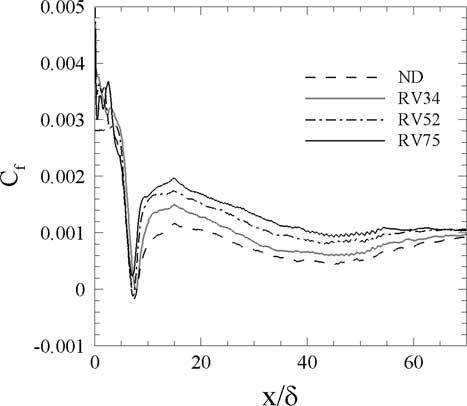
Figure 8. Spanwise-averaged distributions of skin friction coefficient
3.3 Ramped vane flow entrainment
To better understand the connection between the streamwise flow and the vortices, the companion contour maps of the relative streamwise velocities were examined and are shown in Fig. 9. The relative velocity is obtained by subtracting the time-average streamwise velocity field of the RV cases from that of the ND case, where the regions with velocity deficit and higher velocity are shown in blue and red, respectively. As can be seen at x=2.6δ and 5.2δ, the primary vortices generally supplied higher speed fluid close to the wall and created a low-speed upwash in the centre regions away from the wall. As shown at x=7.8δ, the size and the strength of the deficit in the relative velocity were dependent on the device size (greater regions of blue). Further downstream, the high-speed regions near the wall correlated with the size of the device as larger vortices with increased strength were initially formed at the VGs. These large vortices dissipated less quickly in the flow field. The result suggests that larger vortex sizes were needed to ensure that high-speed entrainment persist close to the wall, which was demonstrated by RV75 being able to produce a significant increase in the near-wall streamwise velocity across the entire span by x=26δ. The above results showed that the primary vortices drove the high-speed fluid close to the wall creating a favourable velocity distribution that sustained further downstream than the vortices that lost their coherency and were no longer supplying the new high-speed fluid.
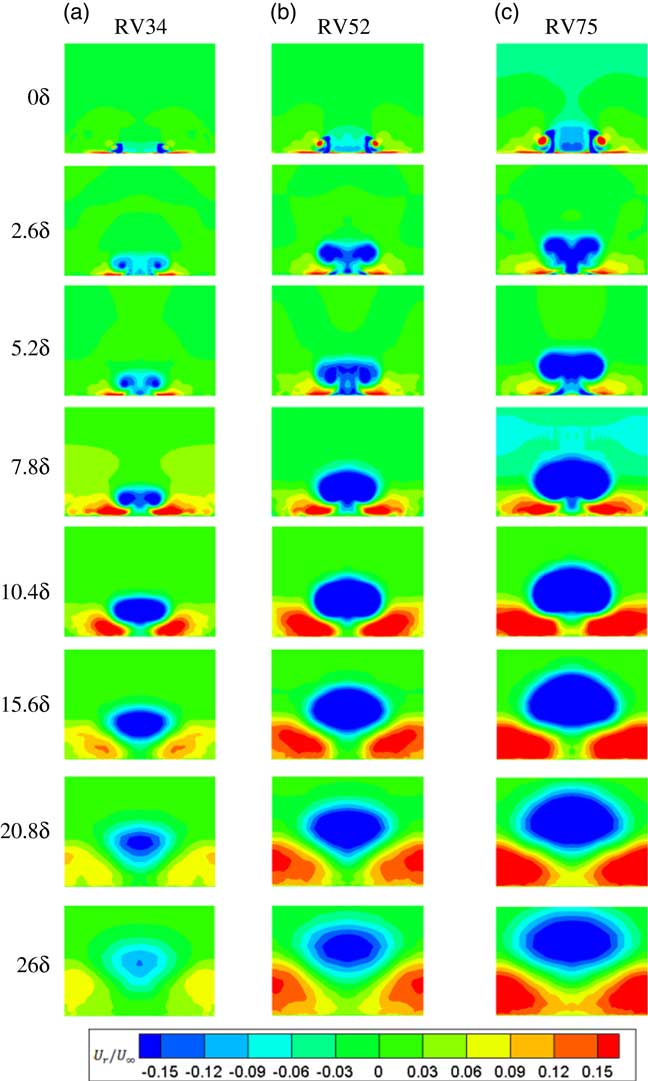
Figure 9. Time-averaged streamwise velocity, U r, relative to the baseline ND flow at various downstream locations.
3.4 Flow characteristics at the measuring plane
To assess the performance of the flow control device inside the diffuser, the time- and spanwise-averaged TKE profiles along the vertical direction at the measuring plane (x=58.7δ) were obtained and are shown in Fig 10(a). The No-Device case resulted in turbulence levels that peaked at approximately y/L<0.15 (y= 0.4δ). The result was consistent with Garnier et al.( Reference Garnier, Sagaut and Deville 52 ) and indicated that the boundary layer still had not recovered to a fully-developed turbulent boundary layer, for which the peak turbulence tended to be located at a height of 0.1δ or less. The inclusion of the ramped vane substantially reduced the peak unsteadiness as the device size increased. The improved steadiness was attributed to a reduction in the flow separation length, since the shear layer associated with a separation bubble tended to dominate the unsteadiness in the reattaching boundary layer( Reference Pirozzoli, Bernardini and Grasso 8 ). The root-mean squared pressure profiles along the vertical direction that were spanwise-averaged at the measuring plane are shown in Fig. 10(b), and it can be seen that the no device and the small device cases are quite similar. However, the medium and large ramped vanes reduced the pressure fluctuations within the boundary layer region (y/L<0.4), which was consistent with the reduced TKE levels. The pressure fluctuations were also reduced above the boundary layer because of the decreased unsteadiness of the normal shock for RV52 and RV75. The reduction of the shock dynamics can be related to the reduction of flow separation area caused by the VG high-speed entrainment and the streamwise persistence of high-speed fluid near the wall (shown in Fig. 9(b) and (c)).
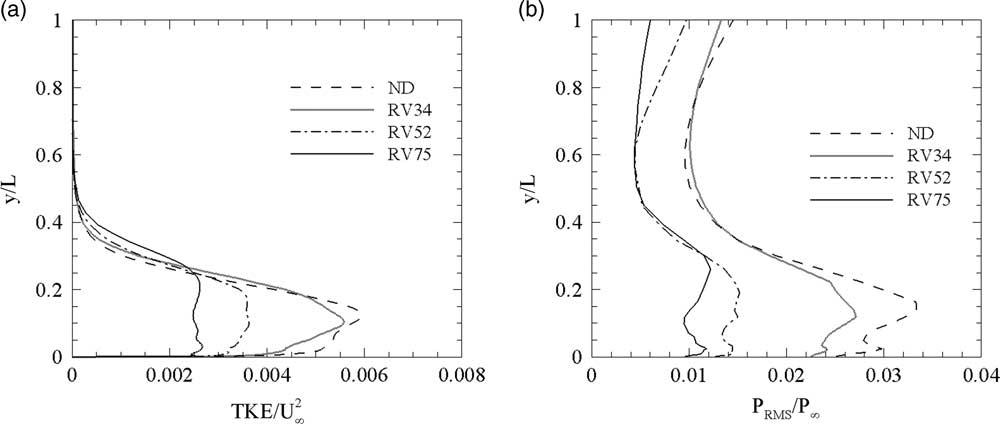
Figure 10. Spanwise-averaged vertical profiles of (a) turbulent kinetic energy and (b) pressure fluctuation at the measuring plane.
To further quantify the impact of the vortex generators on the boundary layer, the spanwise distributions of the displacement thickness, δ*, the momentum thickness, θ, and the shape factor, H, were obtained using the following incompressible definitions:
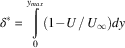 $$\delta ^{{\rm {\asterisk}}} {\equals}\mathop \int \limits_0^{y_{{max}} } (1{\minus}U\,/\,U_{\infty} )dy$$
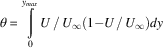 $$\theta {\equals}\mathop \int \limits_0^{y_{{max}} } U\,/\,U_{\infty} (1{\minus}U\,/\,U_{\infty} )dy$$
 $$H{\equals}\delta ^{{\rm {\asterisk}}} \,/\,\theta $$
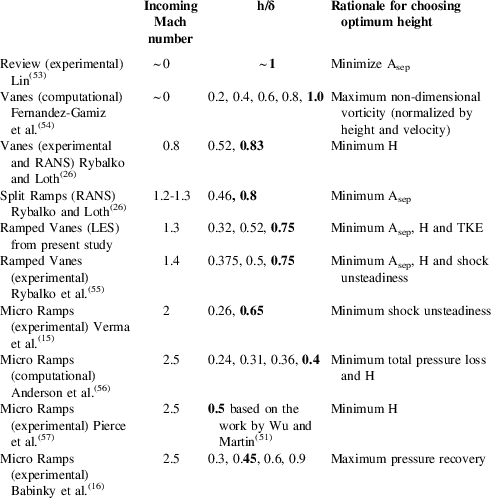
In these equations, U is the time-averaged streamwise velocity and y max is the maximum height of the measuring plane (y/L=1.0). These quantities were spanwise-averaged and are summarized in Table 1 with values all normalized by that of the No Device case. This includes the spanwise-averaging of separated flow area (based on Fig. 7), as well as the vertically averaged (across the diffuser height from y/L=0 to y/L=1) for the TKE and the pressure fluctuations based on Fig. 10. The medium and larger devices resulted in a net reduction in flow separation, which is consistent with their ability to reduce the flow separation downstream of the VG centreline (Fig. 6(c) and (d)). In general, the displacement thickness yielded a 1–2% reduction for RV34 and RV52 cases but a 6% increase for RV75 compared with the ND case. In terms of the shape factor, substantial reductions were obtained for all the ramped vanes compared with the No Device case, with improvement increasing with the device size (19% reduction for RV75). Consistent trend in the reduction of shape factor was observed in the previous experimental study( Reference Rybalko, Babinsky and Loth 26 ). The turbulent kinetic energy also showed substantial reductions, particular for the medium and large ramped vanes, which is consistent with the reduced flow separation areas and the accompanying reduction in the associated shear layer strength. Finally, significant reductions in the pressure RMS were observed in the diffuser with the increasing device size, which confirms the strong correlation between the TKE and the pressure fluctuations. Among the three devices, RV75 yielded the most benefit in reducing the incompressible shape factor, the separation area, the turbulent kinetic energy and the pressure fluctuation. While it is possible that larger devices compared with RV75 can yield better results, it was found that the height of RV75 was consistent with the most effectively performing vortex generator height (normalized with the boundary layer thickness) based on the experimental and numerical studies that ranged from subsonic to supersonic flow regime as shown in Table 2. In these past studies, the objective function for the effective height selection varied from minimizing the flow separation area, the incompressible shape factor, the shock unsteadiness and the turbulent kinetic energy which all relate to the common goal of minimizing the adverse effects caused by the shock interacting with the turbulent boundary layer. As the size of the device becomes larger, drag induced by the presence of these devices increases in parallel. However, drag was not considered in the present investigation. Table 2 and Fig. 11 show a strong correlation between the decreasing normalized device height and the increasing Mach number. This trend is approximated with a dashed line, which indicates that the effective height for incompressible flows (M<0.5) approximately equal to the boundary layer thickness for many flow control applications. At the higher Mach number range, the primary vortices from the smaller VGs can persist longer( Reference Lee and Loth 49 ). As a result, smaller VGs can be deployed to achieve the similar effect of high mixing in the boundary layer. The trends in Fig. 11 are perhaps the first quantitative correlation of the effective VG height with Mach number, but should be considered only as an approximate result since different flow fields, VG geometries and Reynolds numbers are likely to significantly influence the desired VG height. As such, further research in this area is recommended.
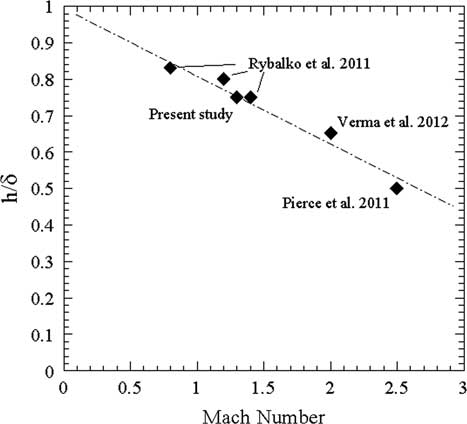
Figure 11. Ideal vortex generator device height normalized by δ as a function of incoming boundary layer Mach number.
Table 1 Spanwise-averaged boundary layer properties with optimum in bold
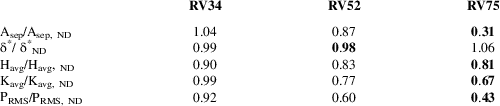
Table 2 Vortex generator device studies with various devices heights for various Mach conditions with optimum heights in bold
4.0 CONCLUSIONS
A “ramped-vane” configuration was numerically studied using Implicit Large Eddy simulation to investigate the impact of device size on the boundary layer downstream of the shock interaction and a subsonic diffuser. The flow control device placed upstream of the shock generated a pair of strong streamwise vortices, which drove the high-momentum flow from above the boundary layer to the low-momentum region near the wall. The result mitigated the adverse effects of the shock interaction on the boundary layer characteristics by substantially reducing the occurrence of shock-induced flow separation via the high-momentum flow entrainment. In addition, the entrained high-speed flow continued to benefit the boundary layer further downstream in the diffuser whose impact scaled with the device size. The largest device (h=0.75δ) generated vortices with the highest strength compared to the smaller device and removed 69% of the flow separation area with respect to the ND case. The impact of increasing the device size was clearly visible in the relative streamwise velocity contours. In general, favourable entrainment of high-speed fluid close to the wall continued far downstream (e.g. x>50δ), despite the fact that the primary vortices had lost most of their coherency far upstream (approx. x=26δ). The high-speed flow close to the wall, once driven there by the vortices, could be temporarily sustained in this location after the vortices have dissipated.
Further benefits were also observed with respect to the integrated quantities. Similar to the previous experimental study, it was found that the larger RVs consistently yielded improved incompressible shape factor. The largest ramped vane (h=0.75δ) achieved a 19% reduction in the incompressible shape factor, a 33% reduction in the turbulent kinetic energy and a 57% decrease in the pressure fluctuations at the measuring plane. However, the largest device caused a 6% increase in the displacement thickness, whereas the medium-scale ramped vane (h=0.52δ) was able to achieve a slight decrease in the displacement thickness while also leading to a reduction in the flow separation area, the shape factor and the pressure fluctuations throughout the subsonic diffuser. The smallest device (0.34δ) had a weak impact on the flow in the diffuser, though a 10% reduction in the shape factor was achieved. Based on these detailed metrics, the largest device studied herein (h/δ=0.75) yielded superior result in deterring the adverse effects caused by the shock-boundary layer interaction. A new review herein of the normalized device height from several other studies revealed a strong correlation of the effective device height with Mach number, consistent with the present results.
ACKNOWLEDGEMENTS
This work was partially supported by the NASA Fundamental Aeronautics Program and the computational resources were provided by the National Center for Supercomputing Applications at the University of Illinois.


