Introduction
Radiotherapy is a primary treatment modality for nasopharyngeal carcinoma (NPC), a worldwide type of malignancy that shows a high curability rate. The local control of the disease is directly related to the radiation dose delivered to the target volume.Reference Kutcher, Fuks and Brenner 1 , Reference LoSasso, Chui, Kutcher, Leibel, Fuks and Ling 2
The International Agency for Research on Cancer predicted that cancer incidence would increase from 1·0 to 1·5 new cases per 1,000 people in low- and middle-income countries as life expectancies increase.Reference Curado, Edwards and Shin 3 Assessment of the status of radiotherapy services in Africa indicated that interventions should be planned to improve the situation and minimise the effect of scarce cancer resources on the population.Reference Abdel-Wahab, Bourque and Pynda 4
One of the relatively available, easy to deliver, low-cost and time-saving techniques in low-income countries is three-dimensional conformal radiotherapy (3D-CRT). Using this technique, dose escalation may be hindered by the tolerance of critical normal tissues in close proximity to the target volume (particularly in parotid gland and brain stem).Reference Kutcher, Fuks and Brenner 1 , Reference Xia, Fu, Wong, Akazawa and Verhey 5 3D-CRT uses computed tomography (CT) planning to generate 3D volumes of a patients’ anatomy, where multiple-shaped beams may be designed to deliver the dose to a selected target while sparing critical organs at risk (OARs). 3D-CRT often produces unacceptable plans for concave or irregular targets that are close to critical structures.Reference Goyal, Cohler, Camporeale, Narra and Yue 6
Intensity-modulated radiotherapy (IMRT) represents an advanced form of high-precision conformal technique that uses nonuniform radiation beam intensities via computer-based optimisation to accomplish an optimal dose distribution.Reference Tejpal, JaiPrakash, Susovan, Ghosh-Laskar, Murthy and Budrukkar 7 It uses either dynamic or static multileaf collimators (MLCs) for the delivery of a highly conformal dose while sparing the surrounding normal structures.Reference Bhatnagar, Brandner and Sonnik 8 – Reference Heron, Gerszten and Selvaraj 10 IMRT is expected to improve the therapeutic index by reducing acute and late morbidity of treatment and improving target volume coverage.Reference Lin, Kim, Terrell, Dawson, Ship and Eisbruch 11 , Reference Scott-Brown, Miah, Harrington and Nutting 12 It shows significant improvements in a number of main quality-of-life domains.Reference Tribius and Bergelt 13
Dose–volume histogram (DVH) parameters are important tools to describe doses delivered to targets and OARs and provide a means for consistent comparison between the dose delivered in 3D-CRT and IMRT.Reference Guckenberger, Pohl, Baier, Meyer, Vordermark and Flentje 14 , Reference van Elmpt, Nijsten, Mijnheer, Dekker and Lambin 15
In this work, the performance of 3D-CRT in the treatment of NPC (as a treatment planning technique that may be available in low-income countries) is compared with IMRT technique (a relatively advanced but considerably expensive technique that may not be available in many low-income countries). The study focusses on evaluating the possibility of using 3D-CRT instead of IMRT in NPC cases. This is carried out through precise measurement and comparison of DVH parameters.
Materials and Methods
Planning systems and radiotherapy machine
This study used XiO three-dimensional treatment planning system (TPS) of Computerized Medical Systems, Inc. (St Louis, MO, USA) (software release 4·64). It incorporates anisotropic analytical algorithm and dose calculation algorithm. The linear accelerator used is Primus K (Siemens, Munich, Bayern, Germany) operating at 6 and 15 MV.
Patient and staging evaluation
This was a retrospective study (at Ayadi El-Mostabal Hospital, Alexandria, Egypt), where 40 NPC patients’ computed tomography (CT) scans were imported to the TPS. New treatment plans were then performed for each patient’s CT images, using 3D-CRT and IMRT techniques and exported to a phantom to measure the dose distribution. The CT images of the patients were divided into two groups according to their diagnosis. Group I consisted of 20 patients with cancer of tumour sizes 1 and 2 (T1,2), negative lymph nodes (N0) and no metastasis (M0), that is T1,2N0M0 stages. Group II consisted of 20 patients with cancer of T3,4N0,1,2,3M0,1 stages.
CT and target volumes
All patients were immobilised in the supine position with head and neck thermoplastic mask. CT was performed with slice spacing of 1·25 mm for all patients of interest. Scan limits were taken through the region from the vertex to 5 cm inferior to the clavicular heads. CT images were transferred electronically to TPS.
The clinical target volume (CTV) was defined as the gross target volume (GTV) with a margin of 5 mm in all directions.Reference Sultanem, Shu and Xia 16 The GTV, CTV and OARs were delineated on a series of treatment planning CT images. The planning target volume (PTV) was defined as the CTV with a margin of 5 mm in all directions. PTV was divided into two parts: primary tumour only (PTV1) and adjacent high-risk structures and bilateral retropharynx (PTV2). RTOG protocol 0615 was adopted as the main guideline for all volume definitions and planning evaluation.Reference Lee, Zhang and Pfister 17 , Reference Lee 18
Dose prescription
For all treatment planning techniques, the dose prescriptions were 70 and 66 Gy in 35 fractions, to PTV1 and PTV2, respectively. The treatment was delivered once daily, 5 fractions per week, over 7 weeks. All targets (PTV1 and PTV2) were treated at the same time using half-beam block technique where the centre of treatment was placed in-between PTV1 and PTV2 to avoid dose overlapping (hot spots) or under-dose area (cold spots).Reference Lee, Zhang and Pfister 17 – Reference Hunt, Jackson, Narayana and Lee 19
3D-CRT planning
Treatment plans were created using 6 MV photons. Six fields were shaped at the beam’s eye view to encompass the PTV shape using MLC at gantry angles of 0°, 45°, 90°, 180°, 270° and 315°. The treatment target volume included PTV1, PTV2 and an additional 0·7 cm margin for beam penumbra in all directions. Physical and virtual wedges were used to modify the dose in the treatment plan and to perform dose homogeneity in PTVs. Two anterior–posterior conformal fields were added conforming the beam’s eye view to neck nodes, in order to adjust the dose homogeneity.
Inverse-planned IMRT
IMRT plan was performed using 6 MV photons with 7–9 equally spaced coplanar beams using commercial inverse planning software. In order to avoid opposing fields, odd numbers were used for the treatment fields.
For inverse-planned 7F-IMRT, seven fields were shaped at the beam’s eye view to encompass the shape of PTVs using MLCs at gantry angles of 30°, 80°, 130°, 180°, 230°, 280° and 320°. For inverse-planned 9F-IMRT, the gantry angles were 20°, 60°, 100°, 140°, 180°, 220°, 260°, 300° and 340°.
Treatment planning evaluation tools
DVHs of all PTVs and OARs were used for plan evaluations and comparisons. All plans were normalised based on the DVHs to ensure that 95% of PTVs receives 100% of prescribed dose. The dose inhomogeneity (DI) in PTVs was defined as (D 5% − D 95%) / D mean,Reference Mock, Georg, Bogner, Auberger and Pötter 20 where D 5% and D 95% were the doses at 5% and 95% of PTVs, respectively, while D mean was the value of mean dose. For OARs, the mean and maximum doses for brain stem, optic nerve and lenses were used for treatment plan evaluation.
Treatment plans were considered acceptable if they satisfy the dose guidelines recommended by the RTOG protocol 0615 for NPC patients.Reference Lee, Zhang and Pfister 17 , Reference Lee 18
Plan verification
Because verification of dose distributions within a real patient was not possible, the phantom substitution method was often used.Reference Wagner, Christiansen, Wolff and Vorwerk 21 Quality assurance of calculated IMRT treatment plans was performed by transferring the plans to the phantom. A selected point dose and the dose distribution in phantom was measured and compared with the corresponding treatment planning calculations.
Water equivalent phantom (model MP3, PTW, Freiburg, Germany), acrylic RW3 slab phantoms (PTW, Freiburg, Germany) and 0·6 cm3 Farmer-type ionisation chamber (PTW, Freiburg, Germany) were used to measure dose distribution.Reference Xing, Curran and Hill 22 Point dose and dose distribution measurements were performed at the machine isocentre, at a depth of 15 cm and patients’ plans were exported to the CT images of the 2D array in order to verify the doses calculated by the TPS for 3D-CRT and IMRT plans.
Patients’ plans were also exported to CT images of an Alderson Rando anthropomorphic phantom (PTW, Freiburg, Germany) and another set of plans were compared with film measurements in the Alderson phantom. Extended dose range (EDR2, Gammex rmi, Middleton, WI, USA) film was inserted axially into the Alderson phantom at the region of primary tumour for 2D dose measurements. Measured and calculated dose planes were imported and compared using Varisoft software (version 3·1, PTW, Freiburg, Germany). The criterion used to evaluate the accuracy of TPS calculations was the gamma index with individual acceptance criteria of 3% dose difference and 3 mm distance to agreement.Reference Low, Harms, Mutic and Purdy 23
Film calibration was performed with the help of five kodak EDR2 films and 30×30×30 cm3 solid water phantom (PTW-29672, Freiburg, Germany).Reference Metwaly, Awaad, El-Sayed and Sallam 24 , Reference Metwaly, Awaad, El-Sayed and Sallam 25
All plan verification methods ensured that for all three techniques (3D-CRT, 7F-IMRT and 9F-IMRT) measured and calculated dose planes were compatible and respect the gamma index criteria.
Results
Dose analysis of PTVs for stage I group
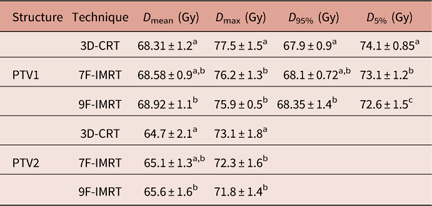
In terms of dose coverage to PTV1 and PTV2, all techniques achieved the constraint that 95% of the volume is covered by more than 95% of the prescribed dose.
Table 1 shows that for PTV1, 3D-CRT shows statistically similar values of D mean and D 95% compared with 7F-IMRT. For PTV2, 3D-CRT shows statistically similar D mean value compared with 7F-IMRT. Despite respecting the RTOG constrains, all investigated 3D-CRT dosimetric parameters are significantly (p<0·05) inferior compared with 9F-IMRT. The differences in the values of dosimetric parameters between 7F-IMRT and 9F-IMRT are statistically insignificant (p<0·05) (Table 1).
Table 1 Dose statistics extracted from the DVHs of PTV for 3D-CRT and IMRT techniques for stage I group
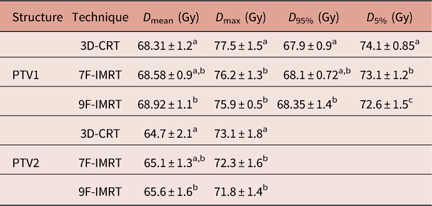
Notes: Statistically significant (p<0·05) differences in means between the three techniques are given different superscript symbols (a, b and c).
Abbreviations: DVH, Dose–volume histogram; PTV, planning target volume; 3D-CRT, three-dimensional conformal radiotherapy; IMRT, intensity-modulated radiotherapy.
The DI in PTV1 for 3D-CRT, 7F-IMRT and 9F-IMRT are 0·09±0·006, 0·07±0·004 and 0·06±0·007, respectively. These values all indicate a satisfactory degree of similarity between the doses that covers 95% and 5% of the volume and respect the RTOG constrains as well.
Dose analysis of OARs for stage I group
Brain stem and spinal cord
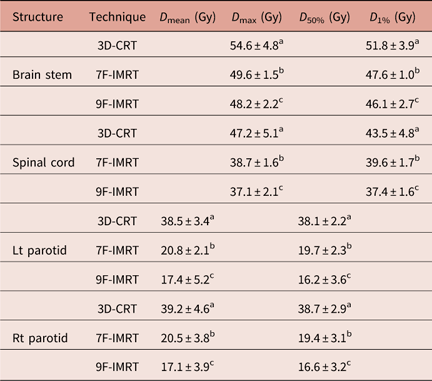
Table 2 lists D max and D 1% values for brain stem and spinal cord. Despite all results agree with the constrains of RTOG 0615 protocol, the brain stem and spinal cord show statistically significant (p<0·05) sparing in case of 7F-IMRT and 9F-IMRT compared with 3D-CRT. Moreover, 9F-IMRT provides better sparing than 7F-IMRT.
Table 2 Dose statistics extracted from the DVHs of OARs for 3D-CRT and IMRT techniques for stage I group
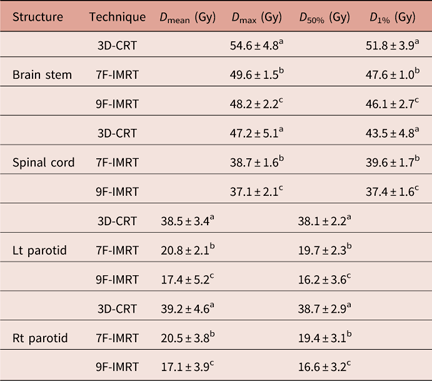
Notes: Statistically significant (p<0·05) differences in means between the three techniques are given different superscript symbols (a, b and c).
Abbreviations: DVH, Dose–volume histogram; OAR, organs at risk; 3D-CRT, three-dimensional conformal radiotherapy; IMRT, intensity-modulated radiotherapy.
3D-CRT dose data of brain stem for T1N0M0 cases only show better D max and D 1% doses (52·2±1·9 and 49·9±2·1 Gy, respectively) compared with the whole stage I group (containing T1N0M0+T2N0M0 cases). In addition, for spinal cord, T1N0M0 cases only report more favourable D max and D 1% doses (44·3±1·8 and 39·4±2·7 Gy, respectively).
Left and Right (Lt & Rt) parotids
The D mean and D 50% values for Lt & Rt parotids are given in Table 2. One can notice that for Lt & Rt parotids, there are statistically significant (p<0·05) differences between 3D-CRT, 7F-IMRT and 9F-IMRT for D mean and D 50%. 9F-IMRT provides the best sparing. Unfortunately, the 3D-CRT values are slightly higher than the RTOG 0615 constrains. Even if one considers T1N0M0 cases only, D mean (36·7±1·6 and 37·1±1·8 Gy for Lt & RT parotids, respectively) and D 50% (37·1±1·3 Gy and 37·1±1·5 Gy for Lt & RT parotids, respectively) values become closer to, yet still higher than, the RTOG protocol 0615 constrains.
The D max values for optical chiasm, Lt & Rt optical nerve, Lt & Rt eye and Lt & Rt lenses are all evaluated for stage I (values are not shown). Dose data for these OARs all respect the RTOG 0615 protocol. The 7F-IMRT shows the best sparing for optical chiasm and Lt & Rt optical nerve. On the other hand, surprisingly, 3D-CRT offers best sparing for Lt & Rt eye and Lt & Rt lenses.
Dose analysis of PTVs for stage II group
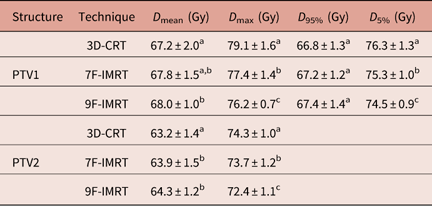
In terms of dose coverage to PTV1 and PTV2, all techniques achieved the constraint that 95% of the volume is covered by more than 95% of the prescribed dose. Table 3 shows that for PTV1, 3D-CRT shows statistically similar D mean values to 7F-IMRT. For D 95%, 3D-CRT shows statistically similar values to 7F-IMRT and 9F-IMRT. For D max of PTV2, 3D-CRT, 7F-IMRT and 9F-IMRT are significantly (p<0·05) different. The differences in the values of dosimetric parameters between 7F-IMRT and 9F-IMRT are insignificant (p<0·05) (Table 3).
Table 3 Dose statistics extracted from the DVHs of PTV for 3D-CRT and IMRT techniques for stage II group
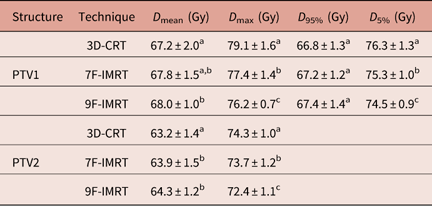
Notes: Statistically significant (p<0·05) differences in means between the three techniques are given different superscript symbols (a, b and c).
Abbreviations: DVH, Dose–volume histogram; PTV, planning target volume; 3D-CRT, three-dimensional conformal radiotherapy; IMRT, intensity-modulated radiotherapy.
For PTV1, 9F-IMRT has significantly (p<0·05) better dose coverage (D mean) over 3D-CRT and 7F-IMRT (Table 3). The latter two show statistically similar dose coverage.
9F-IMRT also shows significantly better D max value compared with 3D-CRT and 7F-IMRT, where 7F-IMRT is significantly better than 3D-CRT (which is considerably high, 113%) (Table 3).
The DI in PTV1 for 3D-CRT, 7F-IMRT and 9F-IMRT are 0·14±0·04, 0·11±0·07 and 0·10±0·05, respectively. These values indicate that 3D-CRT dose homogeneity is comparable with the other two techniques, where all techniques satisfy the RTOG 0615.
Dose analysis of OARs for stage II group
Brain stem and spinal cord
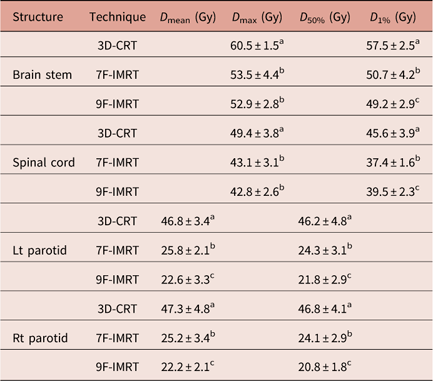
The D max and D 1% values for brain stem and spinal cord are shown in Table 4. One can notice that there are significant (p<0·05) difference between 3D-CRT and IMRT. IMRT (particularly 9F-IMRT) provides good sparing of brain stem and spinal cord over 3D-CRT. The latter does not satisfy the RTOG 0615 constraint. For D max values of brain stem and spinal cord, 7F-IMRT and 9F-IMRT show statistically similar values.
Table 4 Dose statistics extracted from the DVHs of OARs for 3D-CRT and IMRT techniques for stage II group
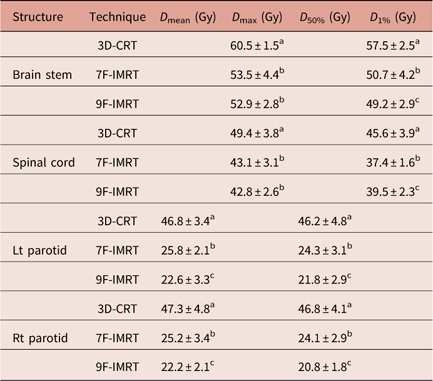
Notes: Statistically significant (p<0·05) differences in means between the three techniques are given different superscript symbols (a, b and c).
Abbreviations: DVH, Dose–volume histogram; OAR, organs at risk; 3D-CRT, three-dimensional conformal radiotherapy; IMRT, intensity-modulated radiotherapy.
Left and Right (Lt & Rt) parotids
The D mean and D 50% values for Lt & Rt parotids are demonstrated in Table 4. 3D-CRT is significantly (p<0·05) inferior to 7F-IMRT and 9F-IMRT, to the extent that 3D-CRT does not satisfy the RTOG 0615. Meanwhile, 9F-IMRT provides significantly (p<0·05) better sparing compared with 7F-IMRT.
The D max values for optical chiasm, Lt & Rt optical nerve, Lt & Rt eye and Lt & Rt lenses are all evaluated for stage I (values are not shown). Dose data for all these OARs respect the RTOG 0615 protocol. The 7F-IMRT shows the best sparing for optical chiasm and Lt & Rt optical nerve. On the other hand, surprisingly, 3D-CRT offers best sparing for Lt & Rt eye and Lt & Rt lenses.
Similar to stage I group, the D max values (not shown) for optical chiasm, Lt & Rt optical nerve, Lt & Rt eye and Lt & Rt lenses in stage II group, all respect the RTOG 0615 protocol. Also, the 7F-IMRT shows the best sparing for optical chiasm and Lt & Rt optical nerve and 3D-CRT provides best sparing for Lt & Rt eye and Lt & Rt lenses.
Delivery time and number of monitor units (MUs) per fraction
Table 5 shows the delivery time and the number of MUs per fraction for different techniques. One can notice that 3D-CRT has the advantage of having the shortest delivery time (219±12 s) among all techniques. This is also reflected in having the lowest number of MUs.
Table 5 The delivery time and the number of MUs per fraction for different techniques

Abbreviations: 3D-CRT, three-dimensional conformal radiotherapy; IMRT, intensity-modulated radiotherapy; MU, monitor unit.
Discussion
Stage I group
There are slight differences in dose to PTVs between 3D-CRT, 7F-IMRT and 9F-IMRT for D mean and D max, probably because the tumour size is small and do not extend to nearby organs or bony structures. Therefore, one may recommend applying 3D-CRT for stage I group of patients as it is easier to deliver, lower in cost and less time-consuming compared with IMRT; in addition, there is a lower probability of errors.Reference Cheung 26 , Reference Yong, McGowan and Redmond-Misner 27 Moreover, for developing countries suffering from the lack of advanced radiotherapy treatment techniques, it can be considered as a reliable and cheap alternative treatment technique.
The average dose data for brain stem, spinal cord and parotids are slightly higher for 3D-CRT technique compared with IMRT techniques. This is because stage I group contains both T1N0M0 and T2N0M0 cases, where T2N0M0 cases (characterised by increased tumour size) are responsible for these slightly high doses.Reference De Bunt, Der Heide, Ketelaars, de Kort and Jürgenliemk-Schulz 28 , Reference Xu, Li, Li and Jia 29 For brain stem, these doses are still within the limits of the RTOG 0615 protocol, probably due to the use of lateral conformal fields covering PTV1 at collimator angle of 0°. In this case, the direction of the MLCs enables good shielding of brain stem. Similarly, the dose to spinal cord obeys the RTOG 0615 protocol due to the use of anterior–posterior conformal fields covering the neck nodes at a collimator angle of 90°, where the direction of MLCs enables proper shielding of spinal cord.Reference Metwaly, Awaad, El-Sayed and Sallam 24 , Reference Metwaly, Awaad, El-Sayed and Sallam 25 However, the relatively high doses to parotids (slightly exceeding that recommended by RTOG 0615 protocol) are probably due to the use of lateral fields in 3D-CRT.Reference Braam, Terhaard, Roesink and Raaijmakers 30 , Reference Herrassi, Bentayeb and Malisan 31
For optical chiasm and optical nerves, one main reason that the 7F-IMRT shows better results over 9F-IMRT is that it uses a lower number of radiation fields. In 3D-CRT, doses to optical chiasm and optical nerves are higher than the IMRT techniques, probably due to the lateral and anterior fields involved in 3D-CRT, but still in acceptable tolerance.
In 3D-CRT, better D max values are reported for eyes and lenses, probably due to their good shielding by means of the MLCs used in treatment fields. In contrast, in IMRT techniques, large numbers of treatment fields are used resulting in higher D max values. For these reasons 3D-CRT provides better sparing of eyes and lenses over IMRT. All dose data of the three techniques respect RTOG 0615 and are in acceptable tolerance.
Stage II group
Tumours in the stage II group are characterised by having a concave shape and an increase in size (tumour is extended to nearby organs and/or bony structures). This is why 3D-CRT shows hotspots (high D max values for PTVs) in order to be able to achieve the required coverage constraint.Reference Kam, Chau, Suen, Chio and Teo 32 The performance of 9F-IMRT is, generally, more satisfactory. This can be attributed to the greater number of fields.Reference Stieler, Wolff, Schmid, Welzel, Wenz and Lohr 33
In the stage II group for 3D-CRT, the D max values of brain stem and spinal cord exceed the limits of the RTOG 0615 protocol. This is probably due to the difficulties that arise in delivering 3D-CRT when dealing with large and extended tumors.
The dose to parotids is considerably higher than that delivered to parotids in the stage I group. The dose to the parotids is also higher in the stage II group, in the IMRT techniques. This can be attributed to the use of lateral fields in 3D-CRT and the tumour being too close to parotids, due to the increase in its volume.Reference De Bunt, Der Heide, Ketelaars, de Kort and Jürgenliemk-Schulz 28 , Reference Braam, Terhaard, Roesink and Raaijmakers 30
Despite delivery of higher D max to optical chiasm, optical nerves, eyes and lenses by the three techniques (3D-CRT, 7F-IMRT and 9F-IMRT) in the stage II group, yet the comparative behaviour of the three techniques remains the same. The 7F-IMRT offers the best sparing of optical chiasm and optical nerves, whereas 3D-CRT provides the best sparing of eyes and lenses. This can be attributed to these OARs being located relatively far from the PTVs.
Conclusion
For stage I group patients (particularly T1N0M0 stage), 3D-CRT can be reliably applied in the treatment of NPC, as it is easy to deliver, low in cost and time-saving compared to IMRT. It provides homogenous doses to the primary target and good sparing of OARs except for parotid glands, which receive a relatively higher mean dose. Nevertheless, it may still be implemented, with some attention, as the dose to parotids is close to the RTOG 0615 constraint.
3D-CRT can be considered as alternative treatment technique for the stage I group (particularly T1N0M0 stage) in developing countries which are suffering from the lack of advanced radiotherapy treatment techniques.
Whenever possible and in comparison with the other investigated techniques, 9F-IMRT would be the technique of choice for the treatment of stage I and II NPC patient groups. It should be noted that the present results are only valid for NPC patients.
Acknowledgements
None.
Financial Support
None.
Conflict of Interest
None.
Ethical Standards
This is a retrospective study where anonymous patient records and data were retrieved from the radiotreatment registry of the hospital.


