


INTRODUCTION
The arid mid-latitude belt, spanning the Sahara, Arabia, and the Thar Desert, represented one of the greatest potential obstacles for the geographic expansion of modern humans from Africa. Heightened aridity rendered these desert landscapes inhospitable to human occupation, effectively preventing human occupations and dispersals. Yet, during the late Pleistocene, repeated pulses of enhanced humidity have been recorded, opening up arid areas to human colonisation (e.g., Breeze et al., Reference Breeze, Groucutt, Drake, White, Jennings and Petraglia2016). Between 120 and 90 ka, human expansion from Africa is evident in the Levant, with the appearance of Homo sapiens at the sites of Es-Skhul and Qafzeh (Schwarcz et al., Reference Schwarcz, Grün, Vandermeersch, Bar-Yosef, Valladas and Tchernov1988; Valladas et al., Reference Valladas, Reyss, Joron, Valladas, Bar-Yosef and Vandermeersch1988; Mercier et al., Reference Mercier, Valladas, Bar-Yosef, Vandermeersch, Stringer and Joron1993; Grun et al., Reference Grun, Stringer, Mcdermott, Nathan, Porat, Robertson, Taylor, Mortimer, Eggins and Mcculloch2005; Millard, Reference Millard2008; Grove et al. Reference Grove, Lamb, Roberts, Davies, Marshall, Bates and Huws2015). Recent evidence, identifying the presence of modern human fossils in East Asia at least 80 ka BP, suggests that these early expansions may have successfully crossed the mid-latitude desert belt (Liu et al., Reference Liu, Martinon-Torres, Cai, Xing, Tong, Pei and Sier2015). In order to examine when and how modern humans were first able to expand across these arid landscapes, the sparse skeletal record must be integrated with evidence for environmental and behavioural change through time.
The Thar Desert, located at the easternmost extent of the midlatitude desert belt, is a critical region for investigating modern human expansions. Firstly, human occupation of the desert belt was contingent on availability of potable water sources, but repeated phases of extreme aridity throughout the late Pleistocene presented a clear threat of population extinction. This threat of extinction from aridity was significantly reduced to the east of the Thar Desert as the influence of the Indian summer monsoon (ISM) rapidly becomes the dominant climatic feature, dramatically increasing the availability of water resources. Indeed, the waxing and waning intensity of the ISM ensures the Thar Desert margin has experienced considerable climatic dynamism during the late Pleistocene (Caley et al., 2011, Reference Caley, Zaragosi, Bourget, Martinez, Malaizé, Eynaud, Rossignol, Garlan and Ellouz-Zimmermann2013; Zhisheng et al., Reference Zhisheng, Clemens, Shen, Qiang, Jin, Sun and Prell2011; Cai et al., Reference Cai, Fung, Edwards, An, Cheng, Lee and Tan2015). Secondly, the transition from the midlatitude desert belt to the monsoonal Indian subcontinent correlates with a major biogeographic boundary, between the Saharo-Arabian and Oriental zones (Holt et al., Reference Holt, Lessard, Borregaard, Fritz, Araújo, Dimitrov and Fabre2013). Within this context, human populations would be required to engage with starkly different climates, patterns of seasonality, and ecological settings. As a result, the Thar Desert represents the easternmost region in which material culture may reflect adaptations to similar environments to those both within Africa and southwest Asia, before full engagement with the mosaic ecologies of the Oriental zone. Finally, although though the Thar Desert lacks a Pleistocene fossil record of modern humans, the region includes the first excavated and dated late Pleistocene archaeological assemblages east of the Zagros Range in Iran.
In this article, we document the palaeoenvironmental context of the Late Pleistocene site of Katoati, in the Thar Desert (Fig. 1), and discuss its implications for human dispersal. Katoati is located in the Nagaur District, Rajasthan, within the vicinity of the Jayal gravel ridge. Following earlier studies (Misra and Rajaguru, Reference Misra and Rajaguru1989; Misra, Reference Misra1995), recent test trenching at this site identified four Palaeolithic assemblages dating between 96 and 60 ka BP (Blinkhorn et al., Reference Blinkhorn, Achyuthan, Petraglia and Ditchfield2013), which directly overlap the time frame of human expansions set out by the earliest evidence of Homo sapiens in west and East Asia. Illuminating the palaeoenvironmental context of these occupations enables us to better examine how Middle Palaeolithic populations adapted to late Pleistocene environmental changes and the role of the Thar Desert in human expansions.

Figure 1 (colour online) Topographic map of the Thar Desert illustrating the location of Katoati with respect to key fluvial features in the region, including the Luni, Sabarmati, and Mahi Rivers.
BACKGROUND
The present extent of the Thar Desert is approximately 300,000 km2, occurring predominately in the Indian states of Rajasthan and Gujarat, and the Pakistani states of Upper and Lower Sindh. Substantial Quaternary sedimentation has preserved evidence of palaeoenvironmental conditions in the Thar Desert (see Kar, Reference Kar2014). These same sedimentary sequences also contain a rich and diverse record of the production of lithic artefacts by Palaeolithic hominin populations, with an archaeological research history stretching back to the 19th century (Allchin et al., Reference Allchin, Goudie and Hegde1978). Palaeoenvironmental records from the region are some of the best reported across the Indian subcontinent, particularly in the last 15 yr with the regular application of luminescence dating techniques, providing an absolute chronology for addressing environmental change (Chawla et al., Reference Chawla, Dhir and Singhvi1992; Andrews et al., Reference Andrews, Singhvi, Kailath, Kuhn, Dennis, Tandon and Dhir1998; Jain and Tandon, Reference Jain and Tandon2003; Dhir et al., 2004, Reference Dhir, Singhvi, Andrews, Kar, Sareen, Tandon, Kailath and Thomas2010; Jain et al., Reference Jain, Tandon, Singhvi, Mishra and Bhatt2005; Juyal et al., Reference Juyal, Chamyal, Bhandari, Bhushan and Singhvi2006; Achyuthan et al., Reference Achyuthan, Quade, Roe and Placzek2007; Singhvi et al., Reference Singhvi, Williams, Rajaguru, Misra, Chawla, Stokes, Chauhan, Francis, Ganjoo and Humphreys2010; Saini and Mujtaba, Reference Saini and Mujtaba2012). However, archaeological evidence has been poorly integrated into the recent dated environmental framework (see Blinkhorn, 2013, Reference Blinkhorn2014), thereby providing only a limited understanding about the role of the Thar Desert in shaping human occupation history.
An interdisciplinary archaeological study of the region surrounding Didwana (Nagaur District, Rajasthan, India) provides the only example of an integrated approach to investigating the hominin occupation of the Thar Desert, combining archaeological excavation with palaeoenvironmental studies and chronometric dating (Agrawal et al., Reference Agrawal, Datta, Hussain, Krishnamurthy, Misra, Rajagure and Thomas1977; Misra and Rajaguru, 1986, Reference Misra and Rajaguru1989; Raghavan et al., Reference Raghavan, Rajaguru and Misra1989; Misra, Reference Misra1995). A model of Quaternary sediment deposition was presented as a tripartite scheme in which the undated Jayal Formation formed the oldest unit, followed by the middle and upper Pleistocene formations of Amarpura and Didwana (Misra, Reference Misra1995). Excavation of Diwana Formation deposits at the site of 16R Dune have offered a critical benchmark for behavioural evolution across South Asia, given the occurrence of stratified archaeological assemblages in a 20 m aeolian section (Raghavan et al., Reference Raghavan, Rajaguru and Misra1989; Achyuthan et al., Reference Achyuthan, Quade, Roe and Placzek2007; Singhvi et al., Reference Singhvi, Williams, Rajaguru, Misra, Chawla, Stokes, Chauhan, Francis, Ganjoo and Humphreys2010). Recent reassessment of the revised chronometric ages and the lithic assemblages indicate a Middle Palaeolithic occupation of the 16R Dune between 80 and 40 ka BP (Blinkhorn, Reference Blinkhorn2013). Acheulean occupations associated with lacustrine Amarpura Formation deposits are best known from Singi Talav, although the dating of these deposits remains controversial (Chauhan, Reference Chauhan2010; Gaillard et al., 2010a, Reference Gaillard, Mishra, Singh, Deo and Abbas2010b).
The Jayal Formation was investigated in the late 1970s and early 1980s and provided information on the oldest sedimentary deposits in the Thar (Agrawal et al., 1980; Misra et al., 1980). It consists of an extensive and prominent ridge, approximately 20 m higher than the surrounding plains (Fig. 2), and is formed of rounded boulders, cobbles, and gravels, including orthoquartzites, quartzitic sandstone, quartz, gneiss, and sandstone, lying unconformably on Neogene deposits (Agrawal et al., 1980; Misra, Reference Misra1995). This ridge is a topographically inverted ancient riverbed indicative of high-energy fluvial activity in the region, which has undergone further fluvial and aeolian modification that have resulted in the inverse stratigraphy of the area (i.e., the oldest deposits appear most topographically exposed). Beyond the prominent ridge formed by the Jayal Formation, cobbles and gravels have been transported and cemented within a massive, crystalline, groundwater calcrete, promoted by the local availability of carbonate from pre-Cambrian limestones in the area (Agrawal et al., 1980). This calcrete formation is resistant to erosion and occurs at a raised level in comparison with the present fluvio-aeolian plain. The youngest suite of sediments surrounding the Jayal ridge, in the lowermost topographic position, comprise weakly calcretised gravels, low-energy fluvial sediments, and aeolian dune deposits. The presence of further palaeosol carbonates throughout indicates a continued moisture-deficient environment (Agrawal et al., 1980).

Figure 2 (colour online) Shuttle Radar Topography Mission (SRTM) Digital Elevation Map (DEM) of the Katoati area illustrating raised topography of the Jayal gravel ridge and the location of key sites mentioned in the text: Katoati (see Fig. 3) (1); Ambali village (2); Barnel (3); Jayal excavations (4); Chhajoli (5); and Jayal Town (6).
Acheulean, Middle Palaeolithic, and Late Palaeolithic artefacts have been reported from surface surveys indicating repeated occupation of the area (Fig. 2; Agrawal et al., 1980; Misra et al., 1980). Four 1×1 m trenches were excavated on the Jayal Formation ridge. The first (Jayal I) was excavated on top of the gravel ridge, whereas the other three trenches were excavated at the base (Jayal II), crest (Jayal III), and midslope (Jayal IV) of the gravel ridge (Misra et al., 1980). A composite stratigraphy indicated Acheulean tools occurred to a depth of 0.40 m, although the excavations continued to 1 m depth, illustrating that archaeological finds were restricted to the upper loam (0–0.2 m) and the uppermost layer of a boulder gravel (0.2–1 m). The assemblages from these excavations were reported as a single assemblage comprising 456 artefacts attributed to the Acheulean (Misra et al., 1980). Besides undifferentiated flakes (58%) and cores (24%), small retouched tools comprised scrapers (n=44), knives (n=8), denticulates (n=6), and notches (n=4), whereas smaller numbers of large tools, including 11 hand axes, 3 chopping tools, and 2 cleavers, were reported. A small collection of 41 retouched tools was reported from excavations at Chhajoli, which were identified as similar to those recovered from Jayal (i.e., Acheulean), with Middle Palaeolithic collections made at Barnel. These investigations indicated that the uppermost boulder horizons of the Jayal Formation were exploited by hominins, though there was no basis to suggest an occupation contemporary with the deposition of the boulder horizons of the original fluvial system (Misra et al., 1980).
KATOATI STUDY SITE
A 4.48 m step trench (KAT1) within a suite of fluvio-aeolian deposits cut by recent stream incision exposed the sediment sequence at Katoati (Fig. 3) (Blinkhorn et al., Reference Blinkhorn, Achyuthan, Petraglia and Ditchfield2013). Katoati occupies a low point in the immediate landscape, with reworked and heavily calcretised gravel and boulder deposits shaping the local topography. The Jayal ridge, comprising exposures of ferricretised sandstones and cobbles, is the topographic high point within this landscape. The exposed sediment sequence is composed of eight lithostratigraphic units (S1–S8), yielding stratified archaeological deposits. Luminescence age estimates and accelerator mass spectrometry (AMS) radiocarbon dates from KAT1 have been previously published (Blinkhorn et al., Reference Blinkhorn, Achyuthan, Petraglia and Ditchfield2013) and are used subsequently to aid interpretation of the stratigraphic and palaeoenvironmental data (see also Table 1). Rare ceramic finds were found within the top 0.38 m (S1), indicating the relatively recent age (i.e., Holocene) of the uppermost deposits. The next unit, S2, extended to a depth of 1.3 m and was dated to 12±4 ka (LD-1087), though this horizon was archaeologically sterile. A thin pebble line, laterally extensive across the landscape, was observed in the top of S3, interpreted to represent a short-term episode of sheet wash. A heavily sorted artefact assemblage was recovered from the pebble deposit, though the lithic assemblage lacked typologically diagnostic artefacts. A limited collection of artefacts was found at the base of lithounit (S3), dating to 61±9 ka (LD-1089) at a depth of ~3 m. Optically stimulated luminescence (OSL) dating of the underlying unit, S4, returned an age of 48±11 ka (LD-1088), while two fragments of ostrich eggshell (Struthio camellus) from S4 are dated to >57.9 14C ka BP (OxA-25897) and >62 14C ka BP (OxA-25898) by AMS radiocarbon dating. Although the OSL ages from S3 and S4 are inverted, their error ranges overlap, and they are consistent with the AMS dates, indicating that the transition between S3 and S4 occurred at ca. 60 ka BP. This transition appears to mark a change in the depositional regime from predominately aeolian (S1–S3) to predominately fluvial (S4–S8). All of these lower four horizons (S4, S5, S6, and S8) yielded Palaeolithic artefact assemblages, associated with OSL dates of 77±7 ka (LD-1090) from S5 and 95.6±11 ka (LD-1149) from S8. Additional luminescence age estimates and AMS radiocarbon dates from KAT 2 and JFL2 that are used to assist interpretation of depositional history of the Katoati landscape in the “Discussion” have also been previously published (Blinkhorn et al., Reference Blinkhorn, Achyuthan and Petraglia2015; see Table 1).

Figure 3 (colour online) (a) Satellite image of Katoati illustrating the location of studied sections within a stream cutting (image: © 2016 Google, © 2016 CNES/Astrium). (b) Photo of KAT1 section.
Table 1 Previously published dates, with stratigraphic data, lab codes, method, and reference used in the text to provide chronological framework for interpreting environmental variability at Katoati and integrating it into wider studies across the Thar Desert. AMS, accelerator mass spectrometry; IRSL, infrared-stimulated luminescence; OSL, optically stimulated luminescence; OES, ostrich egg shell; TL, thermoluminescence.

METHODS
The 3-m-wide step trench at KAT1 was excavated using a single context recording system, splitting each context into arbitrary spits to increase sampling resolution. All sediments were sieved through 5 mm mesh for artefact recovery. A sampling column was established on the left side of the cutting, from which sediment samples for analyses were taken at 10 cm intervals. Micromorphological samples were collected in metal boxes from the upper part of the sequence, but because of sediment composition and concretion, it was not possible to recover tin boxes from the lower deposits. Additional carbonate nodules were collected directly from the section for micromorphological analyses. Exploration across the landscape led to the identification and recording of one further site in the immediate vicinity (KAT2) and three profiles (JFL1, JFL2, and JFL3) exposed by stream cuts.
Fine sediments (<2 mm) from the exposed section were subject to sieve analysis using a mechanical shaker with 9 sieves (1000, 710, 500, 355, 250, 180, 125, 90, and 63 µm), with summary statistics and descriptions produced using GRADISTAT v. 4 (Blott and Pye, Reference Blott and Pye2001). For loss-on-ignition (LOI) studies, sediment samples (~10 g) were weighed and heated in a muffle furnace to 105°C, 400°C, 480°C, and 950°C (allowing the sediments to cool to 105°C for weighing between steps) to calculate the proportions of water, carbohydrate, total organic matter, carbonates, and mineral residue. Magnetic susceptibility was measured in the laboratory using a Bartlington MS3 magnetic susceptibility meter coupled with the MS3B sensor to analyse ~12 g samples, weighed on precision scales to enable calculation of mass specific values presented as Χmass (m3/kg).
To support the results of these analyses, X-ray fluorescence (XRF) analysis was conducted. Sediment samples (~10 g) were homogenised in an agate pestle and mortar to <230 µm and placed in plastic sample bags, to ensure the requisite stability of the device during analysis. Analysis was undertaken using a Thermo Scientific Niton XL2 X-Ray Fluorescence Analyzer and recorded using Niton Data Transfer v. 7.1 software complying with the device’s standard operating procedure. Each sample was subject to 90 s analysis using the “Main Range” filter following calibration to onboard standards and downloaded directly into the Niton Data Transfer program, with results reported in raw percent values per element.
Stable isotope analysis was conducted on pedogenic carbonates. The rhizomorphs and nodules selected were analogous to both those observed in deflated contexts overlying the Jayal gravel ridge and within the streambed in the immediate vicinity of KAT1 and stand in stark contrast to the massive hardpan calcretes observed in the older fluvial sequences in the vicinity. Where possible, two carbonate specimens were analysed, although in four cases scarcity of suitable samples limited analysis to a single nodule.
Each pedogenic carbonate sample was rinsed in ethanol to remove any adhering sediments prior to crushing in an agate pestle and mortar. The samples were dried at 40°C before placing each sample in a test tube. Oxygen and carbon stable isotopic results were obtained using a VG Isogas Prism II mass spectrometer with an online VG Isocarb common acid bath preparation system. Each sample was reacted with purified phosphoric acid (H3PO4) at 90°C with the liberated carbon dioxide cryogenically distilled prior to admission to the mass spectrometer. Both oxygen and carbon isotope ratios are reported relative to the Vienna Pee Dee Belemnite (VPDB) international standard. Calibration was against the in-house NOCZ Carrara Marble standard with a reproducibility of better than 0.2%. Stable isotope ratios are expressed using the standard delta per mille (‰) notation.
Micromorphological studies were carried out by preparing thin sections (3×2 cm) of soil samples and CaCO3 nodules covering the entire lithosection. A total of 30 thin sections were prepared (9 soil, 9 soil with calcitic nodules, and 12 thin sections of calcrete nodules) on the basis of the methods described by Guilloré (Reference Guilloré1980) and described following Bullock et al. (Reference Bullock, Fedoroff, Jongerius, Stoops and Tursina1985). The calcic nodules associated with palaeosols/soil sediments were impregnated using crystic resin, allowed to harden, and then thin sectioned. Alizarin Red S was used as a stain to distinguish low magnesium calcite. These thin sections were studied using a petrological polarised microscope attached to a camera for photomicrography.
RESULTS
Descriptions of sediment sequences studied at and around Katoati are presented in Supplementary Tables 1–4 and illustrated in Figure 4. The results of particle-size, LOI, XRF, stable isotope, and magnetic susceptibility analyses are synthesised in Figure 5, supported by data presented in Supplementary Table 5.

Figure 4 (colour online) Sections exposed at KAT1, KAT2, JFL1, JFL2, and JFL3. The major change in depositional regime, from fluvial to aeolian, is marked on the KAT1 sections, and the sheet wash horizon is highlighted within black boxes on each profile. The studied profile at JFL2 exhibits basement geology at the base of the profile, whereas the base of the observable deposits at all other sections remained within the fluvial horizons. Gravel horizons are illustrated in the KAT1 and KAT2 sections, whereas bedding structures and calcretes are also illustrated from JFL1–3.

Figure 5 (colour online) Composite figure of KAT1 stratigraphy with results of particle-size, loss-on-ignition (LOI), X-ray fluorescence (XRF), stable isotope, and magnetic susceptibility analyses.
Sedimentology and stratigraphy
Five sections within the recent fluvio-aeolian deposits have been recorded at and around Katoati, including the excavated section at KAT1, which reveal a similar sequence of deposits. Exposed ferricretised sandstone and ferricrete-coated boulders at JFL2 suggest that the suites of fluvial and aeolian deposits lie either directly on the basement or at the margins of the highly calcretised fluvial deposits that underlie the Jayal gravel ridge. At KAT1, JFL1, JFL2, and JFL3, alternating sequences of matrix and clast-supported fluvial deposits are identified preserving well-formed carbonate nodules and calcrete bands (KAT1 units S4–S8). The number (n=3–7), thickness (1–2.5 m), and clast size (small gravel to medium cobbles) in these deposits vary between sites, suggesting lateral variability in deposition that is interpreted as a broad, braided channel system. These fluvial sequences are overlain by a pedogenically altered dune deposit, showing the formation of carbonate nodules and rhizoliths. Laterally extensive scouring of the landscape is evident at the top of these pedogenically stabilised, carbonate-rich dune deposits, with evidence ranging from thin gravel lines at KAT1 and KAT2 to larger (pebble-sized) deposits in JFL1, JFL2, and JFL3. A further dune deposit occurs above the scoured horizon, with much less evidence for pedogenic alteration and weakly formed carbonates. The uppermost dune deposit in the sequence, which included fragments of ceramics, is only present at KAT1.
Fluvial deposition at Katoati is dated between ~60 ka and 95.6 ka at KAT1 (Blinkhorn et al., Reference Blinkhorn, Achyuthan, Petraglia and Ditchfield2013), although as bedrock was not observed in the exposed section, it is plausible the deposits may extend beyond Marine Isotope Stage (MIS) 5 into the late mid-Pleistocene. The onset of aeolian deposition appears to occur at the boundary from MIS 4/3 (at KAT1), with the thick, pedogenically altered dune deposit forming during MIS 3. The upper deposits of this horizon are dated by OSL to 38±6 ka at KAT2 (LD-1100) and through the presence of ostrich eggshells dating between >59.9 and 35.21±0.22 14C ka BP at KAT2 and JFL2 (Blinkhorn et al., Reference Blinkhorn, Achyuthan and Petraglia2015; Table 1). The overlying dune deposits are dated to mid–late MIS 2 at KAT1 (12±4 ka; LD-1087) and KAT2 (21±3 ka; LD-1099). The lateral scouring of the landscape appears constrained between these two horizons, broadly spanning the boundary between MIS 3 and 2.
A number of distinctions between these units can be identified in the sedimentological studies conducted at KAT1. Grain-size data from units S1 and S2 indicate fine to very fine sands with very leptokurtic, symmetrical, bimodal distributions that support their attribution as aeolian deposits with a minor coarser element. LOI results indicate that S1 and S2 exhibit relatively low proportions of CaCO3 (<4%), corroborated by XRF determinations of Ca (<2%), compared with the rest of the sequence, indicative of the more limited time frame for pedogenesis.
Scouring of the landscape at the top of S3 is evident with coarser grain sizes (medium rather than fine sands) and a platykurtic, finely skewed distribution associated with a thin granule line between 1.38 and 1.5 m. Below this disconformity, a sharp increase in the proportion of CaCO3 (>10%) is observed, corroborated by XRF results for Ca (>4%). This horizon is also marked by a notable drop in magnetic susceptibility and potassium values, as well as a more limited decrease in the Fe content. Below this, two distinct grain populations can be identified in S3: a trimodal, mesokurtic, symmetrical to finely skewed fine sand between 1.5 and 2.4 m; and a trimodal, platykurtic, finely skewed medium sand between 2.4 and 3.05 m. Poor sorting and polymodality of these sediments suggest they may have been affected by deflation and pedogenesis and may represent either aeolian or interdunal deposits, with a change in sediment source between the upper and lower portions of S3. The increased proportion of CaCO3 evident in LOI results supports a longer time frame for Aridisol development below 2.4 m depth.
Grain-size data from S4, S5, and S8 all indicate polymodal, poorly sorted, platykurtic deposits with fine positive skewness. These grain-size characteristics suggest the deposits may be composed of sediments from multiple sources that are likely to combine fluvial and reworked aeolian components. These sediments comprise the matrix supporting gravel and cobble horizons, mobilised from the immediate vicinity of the Jayal gravel deposits, and may be interpreted as compound bar formations. The LOI results show high proportions of CaCO3 within these deposits, suggesting that they have been exposed to long-term alternations in subsurface humidity resulting in pedogenesis. A gradual enrichment in CaCO3 (LOI) and Ca (XRF) is observed in S4 and S5 (~18%–25%) with steplike increase observed within S8 deposits (~35%–40%). A change is also observed in magnetic susceptibility between S5 and S8, from 4.12e−7 to 2.67e−7 Χmass.
Limited variability is seen in the proportion of organic matter present identified by LOI data, typically comprising ~1% of the deposits, but dropping below this in the upper levels of S3 and lower deposits of S2. Magnetic susceptibility readings at Katoati are low (8e−7 to 2.67e−7 Χmass) and show a gradual decline with depth through the sequence, with only minor variations from this (as noted previously). A similar trend can be noted in the broadly stable proportions of Fe recorded throughout the sequence.
Stable isotopes
The majority of δ18O results from pedogenic carbonates at KAT1 cluster between −4.5‰ and −6‰, although slightly more enriched results are present beneath 3.4 m in depth. The relatively limited variability in δ18O results suggests that either there has been little difference in meteoric water source over the period of carbonate formation exhibited in the excavated section or the level of evaporitic fractionation of soil water has remained fairly constant. A major departure from this broad trend occurs in samples from 1.5 to 1.7 m in depth, which range from −4.1‰ to −0.98‰.
The δ13C‰ results from pedogenic carbonates at KAT1 display greater variation than the oxygen isotope results, ranging from −3.2‰ to 1.57‰. Based on an analogy with xerophytic plants in eastern Africa, pedogenic carbonates formed at a depth of >0.5 m below the surface in pure C3 habitats are expected to range between −13.4‰ and −8.8‰ (mean=−11.1‰), whereas in pure C4 habitats values between 0.2‰ and 3.8‰ (mean=2‰) are anticipated (Cerling, Reference Cerling1999; Sikes et al., 1999; Cerling et al., Reference Cerling, Levin, Quade, Wynn, Fox, Kingston, Klein and Brown2010), accounting for equilibrium fractionation between CaCO3 and CO2 of 9‰–11‰, kinetic diffusion effects of ~4.4‰, and errors introduced because of possible variation in soil respiration rates and temperature (Breecker et al., 2009).
The estimated proportion of C4 plant coverage at KAT1 typically ranges between 60% and 90%, with a maximum of ~96% occurring at 1.5 m depth, suggesting the dominance of C4 grasses. Some notable variations in the proportion of C4 plant coverage occur through the excavated sequence at KAT1. In the upper levels, where only single results are present, C4 coverage is between 75% and 85%. Results from 1.26 m depth are widely dispersed, suggesting between 62% and 92% C4 plants. A peak in δ13C‰ values occurs at 1.38–1.5 m depth, which rapidly decreases by 1.7–1.8 m, which may indicate either a very strong signal of C4 coverage or that the pedogenic carbonate nodules formed within 50 cm from an ancient land surface and thus incorporated some atmospheric CO2. Between 1.9 and 2.95 m the estimated cover of C4 plants is typically between 60% and 70%, whereas dispersed results occur between 3.05 and 3.25 m, with estimated C4 plant coverage ranging from 60% to 90%. Below this depth, estimated C4 plant coverage is typically between 80% and 90%, although a notable drop in upper and lower estimates occurs at 4.3 m.
Micromorphology
Micromorphological analysis throughout the depth of the KAT1 section revealed variations only in the nature and distribution of the fine sediment fractions and in the development of calcitic features, whereas the mineralogy, particle-size distribution, and sorting of the fractions appear to be homogeneous. Key features of micromorphology are summarised in Supplementary Table 6.
The top 1.38 m of deposits comprise two subpopulations of grain size. A coarse grain-size population, 300 to 500 µm, comprises 10%–15% of the deposits predominantly consisting of rounded quartz, quartzitic grains, and rock fragments commonly characterised by weakly developed corrosion in the form of fissures infilled with iron. Brownish-red iron coatings were also observed (Fig. 6a).

Figure 6 (colour online) Photomicrographs showing the following: (a) Two subpopulations of grain size occur from 0 to 1.38 m. Crossed polarizer image (BXN), ×60 µm. (b) Sand-size calcium carbonate grains occur, and these grains are well rounded on dissolution reprecipitation as micritic grains as coatings around the mineral grains. BXN, ×60 µm. (c) As calcium carbonate increases with depth, the evolution of pellicular grain and intergrain microaggregate microstructures are observed. The porosity reduced consisting of loose packing voids lined by fine micritic calcite or fine clay fillings as passage features. BXN, ×60 µm. (d) Coatings of pale-brown to dark-brown clays that are nonlaminated, dusty, and weakly oriented that adhere along the grain margins. Plane-polarized light (PPL), ×50 µm. (e) Biological activity occurs in the form of channels, and these are identified by their long cylindrical forms with loose infillings or filled with clear calcite. PPL, ×60 µm. (f) Calcitic features are observed in the form of well-rounded calcitic nodules in a fine-grain loosed matrix. (g) Where calcitic features are present, the microstructure is of pellicular or single-grain to intergrain type but appears only as the single grain type in the absence of calcitic features. BXN, ×60 µm. (h) Fe oxide coating forming a halo around the hornblende grain. PPL, ×60 µm. (i) At the depth of 4 to 4.10 m, compound complex calcitic nodules develop by pedogenic and groundwater processes. BXN, ×50 µm.
The fine sand fraction (60–110 µm), comprising 60%–70% of the deposit, with well- to medium-sorted, rounded to subangular grains, is composed of 30%–35% quartz, 10%–15% feldspars (orthoclase, microcline, and plagioclase), 15%–20% quartzitic schists, 10%–12% micaceous schists and mica flakes, 5% hornblende, and 5% other minerals, including zircon, tourmaline, epidote, pyroxene, and opaques. All these grains are fresh to weakly altered. Sand-size calcium carbonate grains occur and were observed to increase downwards to a depth of 1.3 m. They are well rounded with smooth edges, whereas some depict indented edges on dissolution (Fig. 6b). They are pale grey in plain light and micritic or microsparitic in nature. Very fine silt grains of quartz or mica flakes can be observed within the coarse calcic grains, in spite of the high birefringence of calcite that masks the mineral inclusions.
Sediments in S1 and S2 of the excavated sequence (0–1.38 m) reveal a loosely packed, single-grain type of microstructure. As calcium carbonate increases with depth, the evolution of pellicular grain and intergrain microaggregate microstructures are observed. The porosity is high (25%–30%), consisting of loose packing voids (Fig. 6c) and a few channels, sometimes lined by fine micritic calcite or fine clay fillings as passage features. In the upper layers, coatings of pale-brown to dark-brown silty clays which are nonlaminated, dusty, and weakly oriented with a medium birefringence and wavy extinction are observed (Fig. 6d). The clay coatings around the fine silt grains are weakly altered mica flakes and poorly crystallised illite. With depth, the fine fractions are enriched by calcium carbonate particles integrating to pale-brown silty clay coatings and generally becoming concentrated near the calcic grains.
Evidence of biological activity is observed in the form of channels (Fig. 6e). The channels are identified by their long cylindrical voids with loose infillings and collapsing walls. Fine fractions along the walls of the channels are rare. Channels become prominent only in the areas where the proportion of calcium carbonate particles increases and the walls are impregnated by weakly developed micritic hypocoatings. Calcitic nodules with indented edges occur as discrete features at a depth of 1.3 m. The sand grains are cemented by microsparitic calcite. At places, the intergrain voids have clusters of radial crystals. At the depth of 1.10–1.3 m, calcitic features are observed in the form of well-rounded calcitic nodules in a fine-grained loose matrix (Fig. 6f).
The upper 1.3 m of S3 exhibits variations in the particle-size distribution and prolific distribution of calcitic nodules and other calcitic features. The skeletal grains comprise the same two subpopulations as observed in S1 and S2. The general mineralogy and size of the grains is also the same as the overlying deposits, except for the presence of weathered hornblende in the horizons devoid of CaCO3. With increasing depth, the grains are coarser and become orange or pale reddish in colour. Calcic grains are present (5% to 10%) but are practically absent in the lower horizons. Silt-sized grains of quartz, feldspars, and micas are observed, although these minerals are masked by the high birefringence of the calcite particles. Where calcitic features are present, the microstructure (Fig. 6g) is of pellicular or single grain to intergrain type but appears only as the single grain type in the absence of calcitic features. The porosity is moderate, 20% to 25%, and consists of simple packing voids and channels filled with loose infillings. In some of the voids, radial crystals of calcite are observed.
Fine sediments within the fluvial deposits (S4–S8) appear homogenous except for variation in colour and the types of calcitic nodules present, with two subpopulation of grains present. A coarse (300-400 µm) sand fraction comprises 30%–35% of the deposits, is composed of well-rounded quartz and quartzitic grains with inclusions of zircon and muscovite, and is characterised by fissures infilled with iron, matching observations from S1 and S2. The fine sand fraction (80–200 µm) comprises 55% to 60% of the deposits, with poorly to medium-sorted, subrounded to subangular grains composed of 35% to 40% quartz, 10% feldspar, 15% to 20% quartzitic and mica schists, 10% to 15% altered hornblende grains, and 5% to 10% other minerals (such as zircon, tourmaline, garnet, epidote, and zoisite). All these minerals, except for hornblende and plagioclase, are unweathered. Hornblende grains exhibit different degrees of alteration between 1.20 and 4.48 m. On alteration, the iron-rich clay occurs as halos (30–40 µm thick) around the hornblende grains (Fig. 6h). At places, the halos are pale in colour because of the merging of iron oxides into the matrix.
Evidence of biological activity in S4–S8 is observed in the form of channels. The channels are infilled with loose sand grains as compared with the surrounding sediments. The walls of the channels are lined by weak micritic hypocoatings. Biological features in the form of root channels lined by the fine calcitic particles are observed within the nodules. The development of compound nodules cemented by CaCO3 at a depth of 3 to 3.4 m formed calcic bands, exhibiting polycyclic formation. The micronodules are well rounded and are 220 to 300 µm in size. The micronodules are recemented by clear sparites and microsparites (Fig. 6i).
DISCUSSION
Depositional and postdepositional sedimentary environments
The palaeoenvironmental analyses we have conducted in the Katoati landscape provide the most detailed study of the geology and geoarchaeology of a Palaeolithic archaeological site in western India to date. Records of numerous sites across the surrounding Katoati landscape display limited lateral variability and indicate that the exposed section at KAT1 is broadly characteristic of fluvial and aeolian deposits in the area. The results of the analysis of micromorphology throughout the excavated profile at KAT1 indicate that sediments appear to be derived primarily from local sources of alluvium and metamorphic rocks of the Aravalli supergroup, supplemented by longer-distance transport of aeolian dust and calcic grains across the Indus plains. This is complementary to evidence from particle-size analyses indicating the existence of different aeolian and fluvial sediment populations that are likely to have been reworked at a local scale. Major changes in the depositional regime are evidenced by the broad change from fluvial to aeolian deposition at the MIS 4/3 transition and the scouring of the landscape at the MIS 3/2 transition. The lateral distribution of late Pleistocene sedimentation indicates fluvial activity at Katoati occurred at a much smaller scale compared with contemporaneous drainage features farther south in the Thar Desert, as discussed subsequently. Similarly, aeolian deposition is not comparable in scale to the nearby site of 16R Dune. Overall, the sedimentary records from Katoati appear to preserve patterns of localised environmental change during the late Pleistocene, with highly limited sedimentary inputs beyond the immediate landscape.
Postdepositional alteration of the sediment deposits is identifiable in the calcitic features of the excavated profile, which are the result of localised leaching, dissolution, and reprecipitation of calcium carbonate from calcareous components, and reworking of pedogenic carbonate nodules. Calcitic nodules in the upper dune deposits are interpreted to be solely formed by pedogenic processes, whereas in the fluvial deposits these pedogenic processes have been influenced by groundwater cementation. The nodules formed in an arid to semiarid environment under loose topsoil cover, with more enhanced summer monsoonal precipitation inferred from carbonate formation in the fluvial sequences, as indicated by higher proportions of C4 plants (Huang et al., Reference Huang, Street-Perrott, Metcalfe, Brenner, Moreland and Freeman2001). Broadly, the concentration by CaCO3 increases at a steady rate between S3 and S8, with a major peak associated with the scouring event (1.3 m) and at the base of S8 (4.2–4.4 m). The first of these may be explained by the deposition of additional carbonate nodules as a result of the scouring event, by erosion of nearby deposits, suggesting the strong C4 signal observed in the isotope record may reflect a homogenised landscape-scale picture of plant populations. The introduction of carbonate nodules as clasts through fluvial activity may also explain the steplike increase in carbonate material in S8, perhaps as a result of erosion from the more highly cemented mid-Pleistocene deposits nearby.
Further evidence of in situ pedogenesis is apparent in the coatings around sand grains and the reddening of the sand grains. This includes local weathering of Fe-rich amphiboles and feldspar minerals, biological activity creating channel porosity, and the translocation of clayey silt and aeolian dust. These processes are more masked in the lower, fluvial deposits as a result of increased calcification but are widely evident in the upper, dune sequence. Decreasing proportions of K with depth fit well with the pattern of increasingly large proportions of carbonate, suggesting the alteration or weathering of feldspars through time, leading to the formation of calcic nodules with clays. However, only minor weathering of Fe is observed, which, alongside only minor variation in magnetic susceptibility results, suggest a relatively slow rate of pedogenesis. The occurrence of calcium carbonate nodules and unstable minerals such as hornblende, epidote, and zoisite indicate semiarid to arid conditions rather than the humid conditions as postulated by earlier workers (Agrawal et al., Reference Agrawal, Datta, Hussain, Krishnamurthy, Misra, Rajagure and Thomas1977), as within a humid environment these unstable minerals are more likely to be altered to kaolinite.
Katoati palaeoenvironments
Katoati presents a case study of fluvial and aeolian activity on the northeastern edge of the Thar Desert. Although studies of late Pleistocene dunes have been conducted (including at the nearby site of the 16R Dune), the investigations at Katoati extend the range of existing fluvial studies northwards. Following the deposition of the Jayal gravel ridge, two major cycles of sediment deposition can be identified. The first comprises thick (>20 m) stacks of heavily cemented clast-supported gravel and cobble beds that dip gently away from the gravel ridge. The second cycle sits within topographic low points in the cemented landscape and comprises the fluvial and aeolian sediments reported from KAT1, KAT2, JFL1, JFL2, and JFL3. The extent to which this topographic depression was the result of incision into the earlier deposits at the start of the second cycle or a variation in the degree of cementation between active channel and overbank deposits remains uncertain. Regardless, it is clear that the heavily cemented earlier deposits have played a significant role in local topography that influenced the environment for sediment deposition and biotic activity in later periods. Furthermore, the second cycle of sedimentation appears to have occurred under much lower energy levels, lacking the capacity to significantly rework gravel and cobble formations of the previous cycle.
The closest comparison for the sequence of fluvial deposition observed at Katoati comes from the middle Luni Valley, a significantly larger drainage system that has remained the major fluvial feature in the Thar Desert up to the present day. Here, two cycles of fluvial activity are reported (Jain et al., Reference Jain, Tandon, Singhvi, Mishra and Bhatt2005). The Type 1 sequence comprised an extensive suite of vertically stacked, upward-fining cycles deposited by gravelly braided streams that progress to form floodplain facies, dating to >300 ka BP. This may correspond to the first cycle of deposition identified at Katoati in the form of massive, cemented cobble and gravel deposits. A second sequence, Type 2, dates from MIS 5 to 1 and comprises fluvial and aeolian deposits (Table 1). Humid phases are evidenced during MIS 5 by the deposition of braided stream channel deposits during MIS 5, dating to >86 ka and 86.3±28.5 ka (TR117) at Khudala, and both >79 ka – and 79.8±8.7 ka – (158) at Karna, directly matching the timing of fluvial deposition at Katoati. A period of widespread pedogenesis is chronologically constrained to the period ca. 70–30 ka BP in the Luni Valley, broadly corresponding to the onset of aeolian deposition and subsequent pedogenesis at Katoati. Ephemeral stream deposits are recorded in the Luni deposits dating to the MIS 3/2 transition, matching the occurrence of fluvial scouring of the Katoati deposits. The appearance of aeolian deposits at ~26 ka in the Luni Valley indicates significant decline in fluvial activity, with incision ca. 22–14 ka and the deposition of gravel-braided, mixed-load meandering and ephemeral sand-bed channel deposits between ca. 14 and 8 ka indicating a considerable fluvial sediment flux with the transition from MIS 2 to MIS 1. The decline in fluvial activity and appearance of aeolian deposition occurs later in the middle Luni Valley, and changing modes of deposition from late MIS 3 to 1 appear to represent more energetic depositional environments than Katoati. Given that the Luni River persists as the only major fluvial feature in the modern Thar Desert, the difference in scale of fluvial activity and deposition compared with Katoati is understandable, but the two sequences are comparable, suggesting they are responding to similar climatic forcing.
At a greater distance to the south, a number of studies have been conducted on west-/southwest-draining rivers in mainland Gujurat that occur at the extreme margins of the Thar Desert. This region currently experiences subhumid to humid climates, which are in contrast to the semiarid climate at Katoati. The study of the Sabarmati, Mahi, and Orsang Valleys is restricted to the late Pleistocene, in part because of the appearance of transgressive marine deposits presumed to relate to the last interglacial (Juyal et al., Reference Juyal, Chamyal, Bhandari, Bhushan and Singhvi2006), and so earlier cycles of fluvial activity comparable with both Katoati and the Luni are not evident. However, a similar pattern of fluvial response can be observed across the time frame of the second cycle of deposition (i.e., late Pleistocene) both at Katoati and in the Luni Valley. These three rivers appear to have been highly active during MIS 5, evidenced by pedogenetically altered floodplains, low sinuosity channels, and bedded calcrete deposits (Juyal et al., Reference Juyal, Chamyal, Bhandari, Bhushan and Singhvi2006). Evidence of fluvial activity appears to be reduced in MIS 4 and is evident only in the southernmost of the three rivers, the Orsang. Persistent and stable fluvial regimes are apparent in MIS 3, resulting in the formation and extensive pedogenesis of floodplain deposits. Aeolian activity first becomes apparent at the transition from MIS 3 to 2 and occurs interspersed with fluvial activity in the terminal Pleistocene prior to incision of the modern channel.
Elsewhere, a significant body of evidence exists for intermittent aeolian activity during MIS 3, comparable to the onset of dune formation at Katoati (Table 1). Aggradation events date to 55±6 ka (ARD4) and 43±5 ka (ARD3) at Shergarh Tri-Junction (Andrews et al., Reference Andrews, Singhvi, Kailath, Kuhn, Dennis, Tandon and Dhir1998); 58 ka BP (TR10) at Chamu (Dhir et al., Reference Dhir, Singhvi, Andrews, Kar, Sareen, Tandon, Kailath and Thomas2010); and 39.6±3 (TL D-7) to 36.1±4.6 (TL R-8) ka at Awai (Chawla et al., Reference Chawla, Dhir and Singhvi1992). At the nearby site of the 16R Dune, dune deposition bracketed by ages of 80±10 (TL13) and 40±3 (TL11) ka (Singhvi et al., Reference Singhvi, Williams, Rajaguru, Misra, Chawla, Stokes, Chauhan, Francis, Ganjoo and Humphreys2010) corresponds to the onset of aeolian deposition at Katoati. High levels of secondary carbonate precipitation are observed in all of these sites during MIS 3, providing evidence for widespread pedogenesis following episodes of aeolian mobility.
During the late Pleistocene, a north–south gradient in monsoonal intensity can be identified from the regional palaeoenvironmental archives of the Thar Desert. A similar tempo of environmental change can be identified in the fluvial systems of the region, as well as in discrete aeolian archives, but with decreasing fluvial energy evident with increasing latitude. Widespread humidity in the Thar Desert during MIS 5, evident in fluvial activity, was replaced with increasing aridity from MIS 4 to 3 onwards, identified through the decrease or cessation of fluvial activity and onset of aeolian activity. The evidence from Katoati suggests that the northeastern Thar Desert experienced more extreme environmental change as a result of late Pleistocene climate change than regions farther south on the eastern margin of the desert.
Middle Palaeolithic occupation at Katoati
Four Palaeolithic artefact assemblages were recovered from KAT1 (units S4, S5, S6, and S8) (Blinkhorn et al., Reference Blinkhorn, Achyuthan, Petraglia and Ditchfield2013), with the presence of microlithic artefacts identified during sediment sampling at KAT2 (S2) (Blinkhorn et al., Reference Blinkhorn, Achyuthan and Petraglia2015). Evidence suggests the intact nature of artefacts within gravel horizons, although a small number of rolled artefacts may have been introduced through fluvial transport, and low proportions of fine fraction artefacts (<20 mm) indicate winnowing of the lithic assemblages (Blinkhorn, Reference Blinkhorn2012). Reduction sequences in all four artefact assemblages show the prominence of the early stages of flaking activity, selecting and making use of lithic raw materials available from gravels in the immediate site vicinity. Much of the behavioural record at Katoati therefore represents primary exploitation of raw materials from gravels (Fig. 7k–l). Formal aspects of lithic technology are evident by the presence of prepared cores (Fig. 7h–j), including Levallois reduction, and the pointed tool forms manufactured by debitage and façonnage methods (Fig. 7a–g). Within the dune deposits, lithics are rare, with a small horizon of artefacts recovered from the scoured horizon at 1.38 m that shows no diagnostic technological features. It therefore appears that the absence of immediately available clasts for flaking with the onset of dune deposition at KAT1 resulted in a change of locus of activity away from this site. Given the availability of suitable clasts from the earlier cycle of fluvial deposition across the surrounding landscape, it is likely this shift in the location of stone tool production would have been at a scale of tens of metres, rather than kilometres. This may be confirmed by further excavation to sample a diversity of locations across the immediate surroundings of these sites.
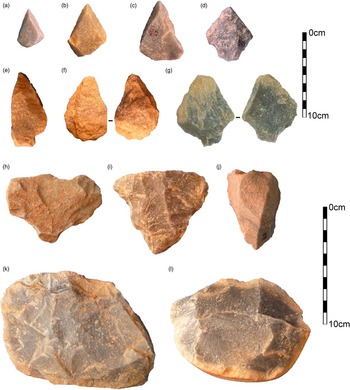
Figure 7 (colour online) Lithic artefacts from Katoati. Top 10 cm scale: Levallois points (a–c); retouched points (d–g). Bottom 10 cm scale: prepared cores (h–j); informal cores (k–l).
Continuity in lithic technology can be observed with the time frame of occupation at Katoati, 95.6 to ~60 ka. Middle Palaeolithic occupations within the Thar Desert extend into MIS 3, including at 16R Dune (Blinkhorn, Reference Blinkhorn2013) and Shergarh Tri-Junction (Blinkhorn, Reference Blinkhorn2014), exhibiting a similar range of technological approaches, but with a notable component of Levallois and non-Levallois blade production in the youngest assemblage (<43 ka) at the latter site. Phases of enhanced humidity in the late Pleistocene clearly offered suitable contexts for hominin habitation at the northeastern margin of the Thar Desert. The absence of dated archaeological assemblages in later MIS 3 and early MIS 2 prevents a thorough assessment of cultural evolution in the region, although the apparent autochthonous development of blade production in Middle Palaeolithic technologies is similar to evidence from south India, where local evolution of Late Palaeolithic technology is apparent (Petraglia et al., Reference Petraglia, Clarkson, Boivin, Haslam, Korisettar, Chaubey and Ditchfield2009; Clarkson et al., Reference Clarkson, Jones and Harris2012). In light of a latitudinal gradient of environmental change evident in the region, we may anticipate hominin occupations of the Thar Desert to have continued into MIS 3 in centre-east and southeast areas as climatic pressure exerted more amplified pressure on the northeast region. The presence of microlithic artefacts dating to 21 ka at KAT2 provides the earliest evidence of Late Palaeolithic occupation in the Thar Desert. Notably, this highlights that the region may have been inhabited during humid intervals of the last glacial maximum, which has typically been assumed to have been too arid to sustain human populations (e.g., Misra, Reference Misra2001).
The Thar Desert shares some common characteristics with the desert landscapes stretching westwards across Arabia to the Atlantic coast of the Sahara. A growing body of evidence now supports repeated hominin occupations during the late Pleistocene, evident in the presence of Middle Palaeolithic assemblages, within the Arabian interior (e.g., Petraglia et al., 2011; Groucutt et al. 2015b, Reference Groucutt, Breeze, Drake, Jennings, Parton, White and Shipton2016; Jennings et al., Reference Jennings, Parton, Clark-Balzan, White, Groucutt, Breeze, Parker, Drake and Petraglia2016). Palaeoenvironmental approaches have illuminated key windows of opportunity for expansions into Arabia in the latter stages of MIS 5 (~85–71 ka) and at the start of MIS 3 (~55 ka) apparent as phases of lacustrine and fluvial activity, and both are associated with hominin occupations (e.g., Breeze et al., Reference Breeze, Groucutt, Drake, White, Jennings and Petraglia2016; Jennings et al., Reference Jennings, Parton, Clark-Balzan, White, Groucutt, Breeze, Parker, Drake and Petraglia2016), offering notable comparisons to Katoati. Significantly, the time frame for expansions of modern humans out of Africa overlaps with these pulses of humidity and hominin occupation evident in both regions (Groucutt et al., Reference Groucutt, Petraglia, Bailey, Scerri, Parton, Clark-Balzan and Jennings2015a). Elements of synchrony between Arabia and the Thar Desert may be anticipated, as environments in both regions respond to mobility of the Intertropical Convergence Zone. Establishing the local impact of global climate variability through examination of terrestrial archives, such as we have undertaken at Katoati, is a critical component to examine human adaptation and expansion through the Saharo-Arabian desert belt. Indeed, the presence of Middle Palaeolithic point production methods at Katoati that are analogous to those seen in North Africa, Arabia, and southern India offer typological support for some behavioural continuity across similar habitats (Blinkhorn et al., Reference Blinkhorn, Achyuthan, Petraglia and Ditchfield2013), but establishing whether this has shared or independent origins is critical (Will et al., Reference Will, Mackay and Phillips2015).
At the eastern margins of the Thar, the threat of population extinction from extreme aridity present throughout the Saharo-Arabian desert belt is relieved by the growing influence of the summer monsoon. Yet, significant variability in climate, seasonality, and ecology occur in the regions beyond, both within the Indian subcontinent and more widely across Asia, placing new demands on the ability of expanding human populations for behavioural adaptation. The diversity of lithic technologies evident across Asia during the late Pleistocene (see Kaifu et al., Reference Kaifu, Izuho, Goebel, Sato and Ono2015) is likely to reflect, in part, the necessity to adapt to such varied environments, making comparisons of hominin behaviour more problematic. Yet biological evidence, such as evidence for interbreeding with Asian Neanderthals ~100 ka BP (Kuhlwilm et al., Reference Kuhlwilm, Gronau, Hubisz, de Filippo, Prado-Martinez, Kircher and Fu2016), and the presence of Homo sapiens fossils in China >80 ka (Liu et al., Reference Liu, Martinon-Torres, Cai, Xing, Tong, Pei and Sier2015) and Laos from 46 to 63 ka (Demeter et al., Reference Demeter, Shackelford, Bacon, Duringer, Westaway, Sayavongkhamdy and Braga2012), clearly indicates the dispersal of modern humans across Asia before the advent of Late Palaeolithic technologies in the Indian subcontinent (Petraglia et al., Reference Petraglia, Korisettar, Boivin, Clarkson, Ditchfield, Jones and Koshy2007). The Middle Palaeolithic occupations at Katoati considerably overlap time frames for modern human dispersals from Africa derived from such Asian evidence, making it plausible that these assemblages were produced by modern human populations beginning to adapt technological behaviour to new environmental settings. By placing evidence of late Pleistocene behaviour within a robust palaeoenvironmental framework at the major boundary between the Saharo-Arabian desert belt and the monsoonal Oriental zone, our research at Katoati marks a key step in examining not only when human expansion across Asia was possible, but also the ecological challenges these populations faced and the adaptive strategies employed to successfully colonise new habitats.
ACKNOWLEDGMENTS
For financial support of this research, JB is grateful to St. Hugh’s College, University of Oxford; the Royal Anthropological Institute; the Fondation Fyssen; and the McDonald Institute for Archaeological Research, University of Cambridge. MP acknowledges funding from the European Research Council (Grant No. 295719). We are grateful to Anna University, Chennai, for logistical support; the Archaeological Survey of India for permitting this research; and the Geography Science Laboratories, University of Cambridge.
SUPPLEMENTARY MATERIAL
To view supplementary material for this article, please visit https://doi.org/0.1017/qua.2017.7


