


1 Introduction
1.1 There is considerable interest in the ability of treatments to extend survival and improve quality of life for those living with cancer. This paper will explore the evidence of survival extension from a range of drugs that have come into use in recent years. In the UK, the National Institute for Health and Care Excellence (NICE) issues guidance on the clinical and cost effectiveness of treatments, which are often new drugs appraised soon after coming to market, or existing drugs with new indications. The evidence base supporting NICE guidance includes empirical evidence from clinical trials as well as longer-term estimates from models extrapolating beyond the clinical trial period to a lifetime horizon. This overview collates results on survival gain by cancer site, for drugs that were recommended as treatment options in England and Wales from 2005 to 2010. The focus will be on lung, colorectal and breast cancers, which collectively account for approximately 40% of all annual cancer deaths in the UK, where 1 in 4 deaths are due to cancer. The treatments considered in this overview are each suitable only for specific subpopulations, in accordance with the marketing authorisationFootnote † and NICE recommendations. The heterogeneity between these subpopulations limits the scope for quantitative synthesis of the survival impact across treatments for the same cancer site. However, the findings of this overview can contribute to an overall picture of the impact of drug treatments on cancer survival.
2 Background
2.2 Relative survival of people with colon and breast cancer has been improving, but there has been no significant change for lung cancer. Improvements have resulted from a combination of factors such as earlier stage at presentation, improvements in integration of multidisciplinary care, lifestyle factors and treatment advances. Some studies have explored the impact on survival of advances in diagnosis and treatment in recent time periods, for example in breast cancer (Woods et al., Reference Woods, Rachet, Cooper and Coleman2007), but the contribution attributable to drug treatment developments remains unclear. Figure 1 shows age-standardised 5-year relative survival rates for lung, colon and breast cancer by period of diagnosis, 1971–2006, England and Wales. These survival data are based on the analysis of cancer incidence and mortality data produced by the Office for National Statistics.

Figure 1 Comparison of lung, colon and breast cancer 5-year standardised survival rate by period of diagnosis, 1971–2006, England and Wales (Source: data collated by Cancer Research UK (2011) derived from data from the Office for National Statistics).
3 The National Institute for Health and Care Excellence (NICE)
3.1 NICE is an independent organization responsible for providing national guidance on promoting good health and preventing and treating ill health. It produces guidance on public health, health technologies (pharmaceuticals, interventional procedures, devices and diagnostics) and clinical practice. NICE was established in 1999 following concerns regarding ‘post-code prescribing’ (NICE, 2012a). Plainly, the NHS, like all health care systems, cannot afford every health care intervention for everyone, and so decisions about allocating health care resources must be made. Guidance, taking into account evidence-based evaluation of the comparative effectiveness of treatments, is developed in order to ensure equal access and high-quality care for everyone regardless of where they live.
3.2 Technology Appraisal Guidance provides recommendations on the use of new and existing medicines and treatments within the National Health Service (NHS). Approximately 40% of the technologies appraised by NICE are indicated for cancer and the majority of these are pharmaceuticals (Trowman et al., Reference Trowman, Chung, Longson, Littlejohns and Clark2011). The evaluation process usually has 2 components; a systematic review of the clinical evidence and an economic evaluation. These components address the following questions:
• How well does the technology work compared with current NHS practice?
• How well does the technology work in relation to how much it costs compared with current NHS practice? Does it represent value for money?
3.3 The resulting guidance may recommend use of the treatment in one or more of several ways: in line with clinical practice, in line with the marketing authorization, optimized use in specific circumstances, use only in the context of research, or not recommended. All recommendations are issued with a date by which they will be considered for review, which is typically three years from the date of publication (NICE, 2012b).
3.4 NICE appraisals and recommendations are quite distinct from marketing authorisation, which is under the remit of the European Medicines Agency (EMA). The EMA is a decentralised body of the European Union. Its main responsibility is the protection and promotion of public and animal health, through the evaluation and supervision of medicines for human and veterinary use, (‘centralised procedure’). Under the centralised procedure, companies submit a single marketing-authorisation application to the Agency. Once granted by the European Commission, a centralised (or ‘Community’) marketing authorisation is valid in all European Union (EU) and EEA-EFTA states (Iceland, Liechtenstein and Norway) (EMA, 2011). Therefore, whilst a pharmaceutical product may have been granted a marketing authorisation, it may not be recommended for use, or have more limited recommendations for use, in England and Wales by NICE.
4 Methods
4.1 NICE Technology Appraisal Guidance documents recommending use of pharmaceutical treatments for lung, colorectal and breast cancer issued between 2005 through to 2010 were collated. The corresponding evidential documents in the public domain were used as a source to obtain estimates of survival gain associated with the new treatments under appraisal compared with alternative comparator treatments. The documents available from each appraisal vary according to the process followed to produce the guidance (NICE, 2012b).
4.2 For appraisals developed using the Single Technology Appraisals Process, the source documents used were the Manufacturer/Sponsor submission, the Evidence Review Group report and the final guidance document. For appraisals developed using the Multiple Technology Appraisal Process, the source documents used were the Executive Summary of manufacturers’ submissions, the Assessment Report and the final guidance document.
4.3 NICE has to make decisions across different technologies and disease areas. It is, therefore, crucial that analyses of clinical and cost effectiveness undertaken to inform the appraisal adopt a consistent approach. To allow this, NICE has defined a ‘reference case’ that specifies the methods considered by the Institute to be the most appropriate for its decisions (NICE, 2008c). Despite this standardised approach, the most plausible estimates for magnitude of effect are often unclear, and subject to opinion and debate. Reasons that may call numerical results into question include those arising from the decision problem (such as whether there is evidence comparing the appraised drug with a suitable comparator); clinical trial design (such as treatment protocols, randomisation, outcome measurement); evaluating multiple clinical trials with varying results; and questions of generalisability to populations broader than those in clinical trials. Results from models extrapolating beyond the trial period include additional sources for uncertainty, such as requiring assumptions about the long-term beneficial and adverse effects of new compared with existing treatments.
4.4 The NICE Guide to the Methods of Technology Appraisals 2008 describes that cost effectiveness results should reflect the present value of the stream of costs and benefits accruing over the time horizon of the analysis, using discounting. It further indicates that for the reference case an annual discount rate of 3.5% should be used for both costs and benefits; based on the recommendations of the UK Treasury (NICE, 2008c). The HM Treasury Green Book (HM Treasury, Reference Treasury2011) states that discounting is a technique used to compare costs and benefits that occur in different time periods, is a separate concept from inflation, and is based on the principle that, generally, people prefer to receive goods and services now rather than later. This is known as ‘time preference’. The mathematical expressions used to calculate discounted present values are set out as follows:
Year 0 is the present. Accordingly, the present value, at the middle of year 0, of a payment of £1 made at the middle of year n is given by:
 $${\rm{Dn}}\: = \:{\rm{1}}\:/\:{\rm{[(1}}\: + \:{\rm{r)^ n]}}$$
where r is the discount rate and Dn is the discount factor.
Where possible, undiscounted figures have been extracted for the purposes of this overview, since our interest here is in estimating life extension, and consideration of the time preference that people may place on that extension is beyond the scope of this work. Occasionally only discounted figures were reported; in these cases this has been detailed in the data extraction tables.
4.5 In this overview, for the purposes of consistency and clarity, the data extracted for overall survival has been taken from pivotal trials (usually those designed for regulatory assessment) and from the base case results of economic models in manufacturer/sponsor submissions. In occasional cases, it is clear from the documentation that alternative data are more suitable for use in this overview, such as when the most relevant comparator in current clinical practice differs from that in the pivotal trial.
5 Findings
5.1 The overall survival results and details of where in the source documents these data have been extracted from are summarized in Tables 1, 2 and 3. The results from clinical trials, presented as hazard ratios for mortality, are illustrated as Forest plots in Figure 2, Figure 4 and Figure 6, and longer-term estimates from economic models are illustrated in the histograms in Figure 3, Figure 5 and Figure 7.
Table 1 Data extraction table from NICE appraisals for lung cancer with positive recommendations, 2005–2010.

*Recommendations as stated in patient version of guidance, ‘Understanding NICE Guidance’
** Size of eligible population sourced from NICE Costing Templates, where available (Costing Templates are not produced for all Technology Appraisals)
*** Where no explanation is given of trial name abbreviations, assume that the abbreviation used has no direct translation
Table 2 Data extraction table from NICE appraisals for colorectal cancer with positive recommendations, 2005-2010

*Recommendations as stated in patient version of guidance, ‘Understanding NICE Guidance’
** Size of eligible population sourced from NICE Costing Templates, where available (Costing Templates are not produced for all Technology Appraisals)
*** Where no explanation is given of trial name abbreviations, assume that the abbreviation used has no direct translation
Table 3 Data extraction table from NICE appraisals for breast cancer with positive recommendations, 2005-2010

*Recommendations as stated in patient version of guidance, ‘Understanding NICE Guidance’
** Size of eligible population sourced from NICE Costing Templates, where available (Costing Templates are not produced for all Technology Appraisals)
*** Where no explanation is given of trial name abbreviations, assume that the abbreviation used has no direct translation

Figure 2 Lung cancer treatments NB: heterogeneous populations.
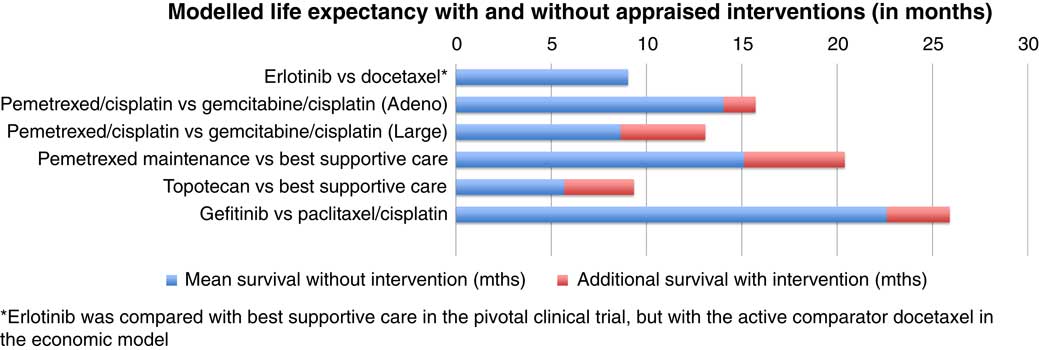
Figure 3 Lung Cancer Treatments – Modelled life expectancy with and without interventions.

Figure 4 Colorectal cancer treatments NB: heterogeneous populations.

Figure 5 Colorectal Cancer Treatments – Modelled Life Expectancy with and without Interventions.

Figure 6 Breast cancer treatments NB: heterogeneous populations.

Figure 7 Breast Cancer Treatments – Modelled life expectancy with and without interventions.
5.2 For lung cancer, there were five appraisals with positive recommendations for 4 drugs between 2005 and 2010. One of the drugs was appraised in two distinct indications (pemetrexed). Four of the appraisals were in non-small-cell lung cancer, and one in small-cell lung cancer. Hazard ratios ranged from 0.61 to 0.91. In four of five cases, the 95% confidence interval did not include one. Estimates from models of overall survival gained ranged from 0 to 5.3 months.
5.3 For colorectal cancer, there were three appraisals with positive recommendations for four drugs between 2005 and 2010. One of the drugs was appraised in two distinct indications (oxaliplatin). Hazard ratios ranged from 0.84 to 0.93. In one of five cases, the 95% confidence interval did not include one. Estimates from models of overall survival gained ranged from 4.3 to 16 months.
5.4 For breast cancer, there were four appraisals with positive recommendations for six drugs between 2005 and 2010. Hazard ratios ranged from 0.66 to 0.97. In two of six cases, the 95% confidence interval did not include one. Estimates from models of overall survival gained ranged from 0.96 months to 57.6 months.
6 Discussion
6.1 In a world where treatments of great promise are often reported in the popular media, the findings here may seem quite modest. However, innovation, much like policy change, tends to happen more often by ‘creeping incrementalism’, rather than ‘step change’. So, whilst the impact of an individual new treatment might look modest, it could be the first step towards much greater change in the future. The journey from new molecular entity through to final marketing authorisation is a considerable one; indeed, the total time to bring a candidate drug from the start of human testing to market is nearly 9 years (Kaitin, Reference Kaitin2010) with many candidate drugs never reaching the final phases of clinical trial. Drug development remains a lengthy, expensive and challenging process for manufacturers.
6.2 When treatments are first developed for human use, the initial indication is often in people with very advanced cancer, where the balance of benefit to risk can be less challenging to assess. With time the same drug may obtain much broader indications at an earlier stage of disease. Another reason why the indications of a cancer drug may broaden with time is biological; the characteristic properties of cancer cells at different sites are often shared so that, a treatment developed in order to target one particular type of cancer may have successful future application in another. Indeed, whilst we have subdivided our findings by cancer site, another interesting approach of interest would be by class of drug.
6.3 Also, and importantly, another reason to expect continued advances in cancer drug development is the impetus for research to continue pushing boundaries that comes from patients, carers, healthcare professionals, researchers, manufacturers, and governments alike.
6.4 The quantitative estimates collated in this overview are subject to uncertainty. Assessing the extent to which new treatments increase survival with cancer based on comparative effectiveness studies has many challenges. These are not limited to the critical appraisal of randomised controlled trials. For example, to assess the difference that an advance makes to the status quo, it is necessary to identify and compare against what current practice is. Clinical trials may not provide this comparison. This may happen due to a change in practice since the design of the trial, or to international variations in clinical practice. Another key challenge includes the long time horizon of the question, and the short time horizon of the empirical evidence, necessitating modelling. Further challenges include the consideration of whether there is stronger evidence in certain subgroups, whether the findings of a trial can be generalized from trial population to general population, handling of treatment crossover and amalgamating more than one trial on the same drug. Whilst these uncertainties should be taken into account when considering our findings, it would seem reasonable to interpret them as providing an evidence-based indication of the magnitude of effect of drug treatments on cancer survival.
7 Conclusion
7.1 The findings collated here show that the impact of drug treatments on the overall survival of people with cancer is highly variable. Point estimate hazard ratios for death (in appraisals with positive recommendations) ranged from 0.61 to 0.97. Of these, the 95% confidence intervals for 7 out of 16 hazard ratios did not include one. The modelled estimates of life extension ranged from 0 months to 57.6 months. Effectiveness of new treatments can be influenced by the underlying pathology of different cancer types, the stage of disease, and on how the drug works.


