INTRODUCTION
Situated between the Lesser Caucasus Mountains to the north and the Araxes River to the south, the modern Republic of Armenia is characterised by steep elevational gradients (ranging from ca. 400 to 4000 meters above sea level [m asl]) and by ecologically diverse micro-habitats (Volodicheva, Reference Volodicheva and Shahgedanova2002). These topographical, ecological, and environmental conditions provide an ideal location for investigating Palaeolithic settlement patterns, resource use, and technological organisation in the context of environmental fluctuations. Our current knowledge of hominin occupation in the Armenian highlands and the Southern Caucasus during the last 250 ka yr contains many temporal and spatial gaps, with only a few sites attributed to the interglacial periods of marine isotope stages (MIS) 7 to 5 (Pinhasi et al., Reference Pinhasi, Gasparian, Wilkinson, Bailey, Bar-Oz, Bruch and Chataigner2008; Mercier et al., Reference Mercier, Valladas, Meignen, Joron and Tushabramishvili2010). The majority of chronometrically dated sites fall between ca. 60 and 30 ka BP, during MIS 4 and 3 (Adler et al., Reference Adler, Bar-Yosef, Belfer-Cohen, Tushabramishvili, Boaretto, Mercier, Valladas and Rink2008, Reference Adler, Yeritsyan, Wilkinson, Pinhasi, Bar-Oz, Nahapetyan and Bailey2012; Gasparyan et al., Reference Gasparyan, Egeland, Adler, Pinhasi, Glauberman, Haydosyan, Gasparyan and Arimura2014; Douka and Higham, Reference Douka and Higham2017; Kandel et al., Reference Kandel, Gasparyan, Allué, Bigga, Bruch, Cullen and Frahm2017; Glauberman et al., Reference Glauberman, Gasparyan, Sherriff, Wilkinson, Li, Knul and Brittingham2020).
Over the last two decades, archaeological research has intensified in the Republic of Armenia, resulting in the discovery and excavation of several Middle Palaeolithic (MP) sites (ca. 300 to ca. 40 ka BP) (Pinhasi et al., Reference Pinhasi, Gasparian, Wilkinson, Bailey, Bar-Oz, Bruch and Chataigner2008; Ghukasyan et al., Reference Ghukasyan, Colonge, Nahapetyan, Ollivier, Gasparyan, Monchot and Chataigner2011; Adler et al., Reference Adler, Yeritsyan, Wilkinson, Pinhasi, Bar-Oz, Nahapetyan and Bailey2012, Reference Adler, Wilkinson, Blockley, Mark, Pinhasi, Schmidt-Magee and Nahapetyan2014; Bar-Oz et al., Reference Bar-Oz, Weissbrod, Gasparian, Nahapetyan, Wilkinson and Pinhasi2012; Gasparyan et. al., Reference Gasparyan, Egeland, Adler, Pinhasi, Glauberman, Haydosyan, Gasparyan and Arimura2014; Glauberman et al., Reference Glauberman, Gasparyan, Wilkinson, Frahm, Raczynski-Henk, Haydosyan, Arakelyan, Karapetyan, Nahapetyan and Adler2016, Reference Glauberman, Gasparyan, Sherriff, Wilkinson, Li, Knul and Brittingham2020). Yet despite this progress, current knowledge of the temporal patterns of MP occupations is discontinuous, and without identifying and excavating additional sites, the links between environmental conditions and hominin adaptations cannot be understood.
Here we report our findings from the MP open-air site of Alapars-1 on the Hrazdan-Kotayk Plateau; the latter is part of the Gegham volcanic massif in central Armenia (Fig. 1). This site was discovered in 2011 during survey activities conducted as part of the Hrazdan Gorge Palaeolithic Project, an Armenian-American expedition. The site is situated on the edge of a felsic lava dome (Karapetian et al., Reference Karapetian, Jrbashian and Mnatsakanian2001; Lebedev et al., Reference Lebedev, Chernyshev and Yakushev2011) and is thought to have formed during the middle and late Pleistocene as part of the volcanic activity associated with the Gutansar volcanic complex (GVC; Arutyunyan et al., Reference Arutyunyan, Lebedev, Chernyshev and Sagatelyan2007). Excavations in 2015–2016 revealed a ca. 6-m-thick sequence of alluvial and aeolian sediments containing three stratified soil complexes dated to MIS 5–3.

Figure 1. (color online) Location maps showing: (A) the topographical position of the Southern Caucasus; (B) the distribution of known Middle Palaeolithic sites in Armenia and Georgia; and (C) the Quaternary geology of the northwest sector of the Gegham volcanic massif and the Hrazdan River Valley (adapted from Karapetian et al., Reference Karapetian, Jrbashian and Mnatsakanian2001 and Sherriff et al., Reference Sherriff, Wilkinson, Adler, Arakelyan, Beverly, Blockley and Gasparyan2019).
Results of geoarchaeological analyses presented in this paper provide chronologically controlled evidence for MP occupation at Alapars-1 during the late middle and late Pleistocene. Three stratified lithic assemblages were recovered, each exhibiting differential artefact densities and techno-typological characteristics that, together with obsidian sourcing, suggest variability in technological organisation, mobility, and land-use behaviours. Alapars-1 offers a diachronic perspective on land-use patterns and MP settlement systems during MIS 5 to 3 in central Armenia in relation to environmental changes.
GEOLOGICAL CONTEXT
Alapars-1 (UTM 38T 472915 m E, 4472694 m N) is situated at 1774 m asl, 1 km north of the village of Fantan and 28 km northeast of Yerevan. The exposed sequence is on the northern flanks of the Fantan (also known as “Fontan”) obsidian-bearing felsic lava dome. It is important to note that the latter is distinct from the Alapars lava dome, which lies 1 km further north (Karapetian et al., Reference Karapetian, Jrbashian and Mnatsakanian2001) (see Fig. 1C).
The Fantan Dome, as expressed on the current ground surface, measures 100 m in diameter and 20 m in height. The dome is part of a series of volcanic features forming the GVC over an area of approximately 70 km2, in the northwest sector of the Gegham volcanic massif (Karapetian et al., Reference Karapetian, Jrbashian and Mnatsakanian2001; Lebedev et al., Reference Lebedev, Chernyshev, Shatagin, Bubnov and Yakushev2013; Frahm et al., Reference Frahm, Feinberg, Schmidt-Magee, Wilkinson, Gasparyan, Yeritsyan, Karapetian, Meliksetian, Muth and Adler2014). The GVC comprises dacitic-rhyolitic and basaltic-andesitic lava flows, obsidian-bearing felsic lava, and pyroclastic deposits and scoria-rich pyroclastic deposits; it extends to the north and west of the Mt. Gutansar stratovolcano, which is located ca. 3 km south of Alapars-1. Both the Fantan and Alapars domes, together with Mt. Gutansar, are thought to lie along a north-south fault that passes through the GVC (Karapetian et al., Reference Karapetian, Jrbashian and Mnatsakanian2001) (see Fig. 1C). To the south of the GVC lies a second stratovolcano, Mt. Hatis, which has associated lava flows and obsidian-bearing felsic deposits that extend principally south of the volcanic cone towards Yerevan (Lebedev et al., Reference Lebedev, Chernyshev, Sagatelyan, Goltsman and Oleinikova2018) (see Fig. 1C).
The timing of volcanic activity in the northwestern sector of the GVC is based principally on K-Ar and fission track (FT) ages of volcanic deposits (see Sherriff et al., Reference Sherriff, Wilkinson, Adler, Arakelyan, Beverly, Blockley and Gasparyan2019 for a full review). These ages indicate that the principal phase of volcanic activity associated with the formation of the GVC was ca. 700-400 ka, with the formation of obsidian at ca. 0.7–0.48 Ma around the flanks of Hatis and ca. 500 ka yr in the GVC (Lebedev et al., Reference Lebedev, Chernyshev, Shatagin, Bubnov and Yakushev2013, Reference Lebedev, Chernyshev, Sagatelyan, Goltsman and Oleinikova2018). It is important to note, however, that ambiguities are associated with the chronological evidence from the volcanic deposits (Mitchell and Westaway, Reference Mitchell and Westaway1999; Sherriff et al., Reference Sherriff, Wilkinson, Adler, Arakelyan, Beverly, Blockley and Gasparyan2019). This is best exemplified by the previously published chronological evidence from the Fantan Dome, with K-Ar dates on extruded obsidian yielding an age of 480 ± 25 ka (Lebedev et al., Reference Lebedev, Chernyshev and Yakushev2011), whereas FT ages from the same obsidian extrusion have yielded ages of 320 ± 20 ka and 300 ± 20 ka (Badalian et al., Reference Badalian, Bigazzi, Cauvin, Chataigner, Jrbashyan, Karapetyan, Oddone and Poidevin2001).
The Alapars-1 archaeological site lies on a plateau formed of intermediate-felsic lava, representing the northern margin of the GVC (Fig. 2). The plateau has been heavily dissected by weathering and erosional processes, with evidence of past fluvial activity indicated by the occurrence of a 1-km-long, S–N-oriented dry valley located 500 m east of the site (see Fig. 2). A second, lower elevation (1610 m asl) lava plateau lies to the north of Alapars-1, forming the southern margin of the present Hrazdan River valley. Here the Hrazdan River runs E–W and has formed a gorge about 100 m deep, with the present-day channel present at an elevation of 1510 m asl. The river has undergone several phases of geomorphological evolution during the Pleistocene as a response to uplift and volcanic activity. However, based on current chronological evidence, the Hrazdan has been flowing in its current position north of Alapars-1 for about 400 ka yr (Sherriff et al., Reference Sherriff, Wilkinson, Adler, Arakelyan, Beverly, Blockley and Gasparyan2019).

Figure 2. (color online) (A) Topographical map of the Alapars-1 locale; (B) South–north elevational cross-section from Mt. Gutansar to the modern Hrazdan valley. Stratigraphical positions of the main volcanic deposits are labelled, following Sherriff et al. ( Reference Sherriff, Wilkinson, Adler, Arakelyan, Beverly, Blockley and Gasparyan2019); (C) photograph of the Fantan Dome and Alapars-1.
Today, the Hrazdan-Kotayk Plateau is characterised by a continental climate regime, with average summer temperatures of 26°C, average winter temperatures of −13°C, and an average annual rainfall of 500 mm (Volodicheva, Reference Volodicheva and Shahgedanova2002). The Pleistocene climatic history of the area is currently poorly understood, with evidence principally based on palaeoecological evidence from Lake Van, Turkey (Litt et al., Reference Litt, Pickarski, Heumann, Stockhecke and Tzedakis2014; Stockhecke et al., Reference Stockhecke, Sturm, Brunner, Schmincke, Sumita, Kipfer, Cukur, Kwiecien and Anselmetti2014; Pickarski et al., Reference Pickarski, Kwiecien, Langgut, Djamali and Litt2015a, Reference Pickarski, Kwiecien, Langgut and Litt2015b; Pickarski and Litt, Reference Pickarski and Litt2017). This record indicates that warm episodes (interglacials and interstadials) were characterised by Mediterranean-type arboreal vegetation, while non-arboreal taxa associated with cooler and drier conditions characterise cooler stages (glacials and stadials). In recent times, the Fantan Dome has been extensively quarried. As a result, the Alapars-1 sequence is exposed on the northern side of the dome, but the quarrying has removed any physical connection between the sediments containing the Palaeolithic artefacts and the dome itself (see Fig. 2).
METHODOLOGY
Field and sedimentological methods
A single trench, located in the eastern wall of the quarry, was excavated at Alapars-1 during 2015–2016 (Fig. 3). A total of 21.2 m3 of sediment was excavated, representing (a) an area of ca. 8 m2 from 0 cm (zero datum, 1774 m asl) to 120 cm below datum (bd), with a total volume of 9.6 m3, and (b) 4 m2 from 120 to 410 cm bd, with a total volume of 11.6 m3. An additional section from 4 m to 6 m bd was cleaned for sedimentological recording. The sediment was excavated in contiguous 10-cm levels and dry-screened through a 5-mm mesh.

Figure 3. (color online) (A) Section drawing of the upper strata (Units 1–6) of the Alapars-1 sequence. Photographs of the section are shown in b–e, where (B) shows Units 3–1, (C) shows Units 9–4, (D) is a detailed image of Unit 3, and (E) shows Units 12–11.
Contiguous samples of 5-cm thickness were taken for bulk sedimentological analyses (magnetic susceptibility [χ], percent calcium carbonate, percent total organic carbon [TOC], particle size analysis) through the north profile of Alapars-1 between 50 and 600 cm bd. Samples were oven dried at 40°C, gently disaggregated, and sieved at 2 mm. All analyses were undertaken on the <2-mm size fraction. Mass-specific magnetic susceptibility was measured at low frequency (0.46 kHz, χlf) and high frequency (4.6 kHz, χhf) using a Bartington MS2 meter with dual-frequency sensor, following the protocol of Dearing (Reference Dearing1999). Values were mass- and volume-normalised and are expressed as 10−8 m3 kg−1. Percentage frequency-dependent magnetic susceptibility (χfd%) was calculated as: χfd(%) = 100 × [(χlf − χhf) / χlf]. Calcium carbonate content was measured using a Bascomb calcimeter following the method described by Gale and Hoare (Reference Gale and Hoare1991), and TOC was measured using the Walkley-Black (Reference Walkley and Black1934) titration method. Grain-size analysis was conducted on sand and finer particles by the laser diffraction method using a Malvern Mastersizer 2000 and a Hydro UM accessory. Prior to measurement, calcium carbonate and organic matter were removed through reaction with 10% hydrochloric acid and 10% hydrogen peroxide respectively, and samples were subsequently immersed in 0.5% sodium hexametaphosphate for 24 hours to avoid coagulation. Samples were subjected to ultrasonic cleaning for 20 minutes prior to measurement, and each sample was measured four times using the Mie optical model in 116 channels ranging from 0.004 to 2000 μm. Values presented in Figure 4 represent calculated averages of these individual measurements.

Figure 4. Summary stratigraphical profile of Alapars-1. Shown are the infrared stimulated luminescence age determinations, Unit designations, results of bulk sedimentological analyses (calcium carbonate content, organic content, magnetic susceptibility, grain-size analysis), main pedocomplexes (PC) and Soil Horizons I (SH I), and location of main lithic assemblages (LA).
Chronology
Four sediment samples (Table 1), were collected for luminescence dating using opaque stainless-steel tubes hammered horizontally into cleaned stratigraphic sections. Since very little quartz was found in our samples, only potassium-rich feldspar (K-feldspar) grains were used for dating. Grains with diameters of 90–125 or 90–180 μm were extracted using standard procedures (Aitken, Reference Aitken1998) and measured using infrared stimulated luminescence (IRSL) following the method described in the Supplementary Information. Single aliquots composed of a few hundred grains were measured using an automated Risø thermoluminescence / optically stimulated luminescence (OSL) reader equipped with infrared (875 nm) light-emitted diodes for stimulation (Bøtter-Jensen et al., Reference Bøtter-Jensen, McKeever and Wintle2003) and a calibrated 90Sr/90Y source for beta irradiations. The IRSL emissions were detected using an Electron Tubes Ltd 9235B photomultiplier tube fitted with Schott BG-39 and Corning 7-59 filters to transmit wavelengths of 320–480 nm. IRSL ages from Alapars-1 are presented in Table 1.
Table 1. Alapars-1: infrared stimulated luminescence results: burial depths, units, grain sizes, dosimetry data, De, and ages for the K-feldspar samples.

a Values used for dose rate and age calculations, with measured (field) water contents shown in parentheses.
b The final ages are those obtained from pIRIR290 signals. All the ages were calculated by subtracting the residual dose (9 ± 2 Gy) from corresponding De values. A relative error of 2% was included in the uncertainty on the final ages, to allow for possible bias in the calibration of the laboratory beta source.
In addition to IRSL analysis, contiguous samples of 5-cm thickness from Units 6 to 8 of the Alapars-1 sequence were investigated for their cryptotephra potential, following the methods of Blockley et al. (Reference Blockley, Pyne-O'Donnell, Lowe, Matthews, Stone, Pollard, Turney and Molyneux2005) and Lane et al. (Reference Lane, Cullen, White, Bramham-Law and Smith2014). A full description of the protocol and tephra concentrations is presented in the Supplementary Information. Throughout Units 6 to 8, high concentrations of colourless glass shards were identified, with values ranging from 50,000 to ca. 2 million shards g−1 dry weight. The distribution profile is, however, continuous and lacks any obvious structure indicative of primary input derived from a volcanic eruption (see Davies, Reference Davies2015). Therefore, it is likely that the tephra formed a component part of the sediment source material and was not deposited in primary air-fall events (i.e., tephric; see Lowe and Hunt, Reference Lowe and Hunt2001). Thus, it was decided that the site was not suitable for further cryptotephra-stratigraphical investigation.
Artefact analysis
The lithic assemblages recovered from Alapars-1 were subjected to attribute analysis to assess artefact preservation and were examined for their metrical, technological and, typological characteristics (e.g., Hovers, Reference Hovers2009). The physical properties of the lithic artefacts reflect different natural post-depositional processes. To investigate the taphonomy of artefacts, we analysed edge damage, wear on the ridges of dorsal scars, and patination (Shackley, Reference Shackley1974; Villa and Courtin, Reference Villa and Courtin1983; Petraglia and Potts, Reference Petraglia and Potts1994; Burroni et al., Reference Burroni, Donahue, Pollard and Mussi2002; Anovitz et al., Reference Anovitz, Elam, Riciputi, Cole and Fayek2006; Glauberman and Thorson, Reference Glauberman and Thorson2012, and references therein). The relative sizes and shapes of artefacts, the amount of cortical cover, numbers of dorsal scars, and other characteristics enabled us to reconstruct the core-reduction sequences conducted at the site. Moreover, these attributes allowed us to study the decision-making processes related to the technological organisation and lithic raw material economy of Palaeolithic foragers (Binford, Reference Binford1979; Geneste, Reference Geneste1985; Kuhn, Reference Kuhn1995).
Obsidian artefact sourcing
X-ray fluorescence (XRF) techniques have frequently been used for obsidian sourcing since the 1960s, and portable XRF (pXRF) has become an established tool for such analyses over the last several years (e.g., Frahm and Feinberg, Reference Frahm and Feinberg2015, and references therein). Therefore, given that all lithic artefacts recovered from the site were made of obsidian, a sample (n = 736) was geochemically examined using a Niton XL3t 950 GOLDD+ pXRF instrument following procedures described by Frahm (Reference Frahm2014). Study of the Alapars-1 artefacts was coupled with pXRF examination of the nearest obsidian sources, including the lava dome on which the site is located.
RESULTS
Alapars-1 site stratigraphy and archaeological context
The Alapars-1 sequence is illustrated in Figure 3, and the bulk sedimentological properties are presented in Figure 4. The sequence comprises angular boulder-sized blocks of intermediate lava (Unit 13) overlain by 12 sedimentary units that primarily represent low- and high-energy alluvial and aeolian sedimentation. Within the sequence, there is evidence for multiple phases of pedogenesis, represented by three stratigraphically distinct soil complexes (Soil Horizon I, Pedocomplexes I–II), and the development of a laminar calcrete horizon. A summary of the sedimentological properties of the Alapars-1 sequence is presented in Table 2.
Table 2. Alapars-1: stratigraphical summary.

Units 12–11 (603–510 cm bd)
Unit 12 represents the base of the sequence and comprises massive to horizontally bedded coarse ash-lapilli pumice fragments with abundant fine sand and small granules throughout. There is a graded contact with Unit 11, which in turn has a silty-sand texture comprising coarse ash-lapilli pumice with fine–medium sand grains. Unit 11 is also characterised by the prevalence of pedofeatures, including cm-scale blocky peds, Fe/Mn staining throughout, root casts, and associated vertically orientated carbonate rhizoliths. TOC of Unit 11 is low (<0.7% throughout), while CaCO3 content increases (from 0% to 15%) through the stratum (see Fig. 4). χlf values are generally low (less than 0.6 10−8 m3 kg−1); however, the increase in the upper part of the stratum (to 0.35 10−8 m3 kg−1) likely reflects increases in Fe and Mn (Dearing, Reference Dearing1999).
Units 11 and 12 are interpreted as representing reworked pumice, with horizontal bedding characteristic of sub-aqueous sedimentation in an alluvial setting. A volcanogenic origin is supported by the consistently high χlf values (Dearing, Reference Dearing1999), while the increase in χlf in the upper part of the strata indicates enhancement of the magnetic signal by ferruginous minerals through pedogenic processes. The presence of carbonate rhizoliths in Unit 11 is consistent with the development of a Bk–Bc horizon, and a small increase of clay content in this stratum indicates some clay illuviation may have taken place. These latter properties indicate incipient pedogenesis (designated here as Soil Horizon I) within the fluvially reworked pumice.
Unit 10 (510–410 cm bd)
Unit 10 comprises two beds (Units 10a and 10b) of normally graded moderately sorted clast-rich sub-angular cobbles and boulders that dip 20–30° northeast to southwest in a matrix of fine sand-silt with frequent pumice lapilli. Clasts are principally of fine-grained mafic and indeterminate lithologies. These strata form elongated lenticular beds ca. 3 m in length that appear to taper east and west of the Alapars-1 trench borders. Associated with the 10b–10a contact are fragmented cm-scale beds of wavy laminated carbonate.
The geometry of the strata and sorted nature of the sediments in Units 10a and 10b are consistent with channel features that formed within a high–moderate energy flow regime. The angularity of the clasts and occurrence of solely volcanic lithologies indicate a short transportation history, with material derived from weathering of volcanic deposits in higher elevation areas of the GVC to the south of Alapars-1. Transportation of the material likely occurred in a south to north direction and by alluvial fan or fluvial processes (Mather et al., Reference Mather, Stokes and Whitfield2017), while channel formation likely eroded the underlying palaeosol, thereby explaining the truncation of Soil Horizon I. The wavy laminated carbonate associated with Units 10b–10a represents the formation of carbonate crusts on the surface bed load deposits as the consequence of CO2 degassing and microbial action (Pentecost, Reference Pentecost2005; Arenas-Abad et al., Reference Arenas-Abad, Vázquez-Urbez, Pardo-Tirapu and Sancho-Marcén2010). The fragmented nature of these features is a consequence of mechanical breakdown of the crusts by later fluvial activity.
Units 9–4 (410–153 cm bd)
Units 9–4 represent a series of tabular beds ranging in thickness from 16 to 82 cm. Unit 9 is a fine sand-silt forming granule-sized sub-angular blocky peds; it is characterised by low TOC (less than 0.3%) and CaCO3 (ca. 2%) contents and by relatively low χlf (0.24 10−8 m3 kg−1) values. Unit 8 has similar sedimentological properties; however, it is characterised by a greater abundance of carbonate (see Fig. 4), of which mm-scale sub-vertical carbonate rhizoliths and carbonate coatings of peds are common. This is reflected in the relatively higher CaCO3 content of Unit 8 (ca. 4.8%) in comparison to Unit 9, while its χlf (0.24 10−8 m3 kg−1) and TOC (<0.3%) are similar to the lower unit. Carbonate rhizoliths and carbonate ped coatings are also identifiable in Unit 7; however, rhizolith features here are finer and less abundant than in Unit 8. Unit 7 is composed of fine sand-silt with rare sub-angular obsidian pebbles and rounded cobbles of rhyolite. TOC content (<0.3%), CaCO3 content (ca. 4%), and χlf (0.22 10−8 m3 kg−1) values are comparable to those of Unit 8. Similar sedimentological properties are also identifiable in Unit 6 (TOC <0.4%, CaCO3 ca. 5%, χlf 0.20 10−8 m3 kg−1). Unit 5 is also a fine sand-silt; however, it is characterised by an absence of carbonate pedofeatures. This is reflected in the bulk sedimentological properties of the bed; it has a lower CaCO3 content (1.6%) than the other strata in Units 9–4, and its TOC (0.4%) and χlf (0.41 10−8 m3 kg−1) values are relatively high. Unit 4 is characterised by a sandy-silt texture, forming cm-scale granular aggregates, with powdery carbonate and mm-scale carbonate rhizoliths present throughout. The increase in carbonate through this unit is reflected by higher CaCO3 values (12.5%), while TOC (0.3%) and χlf (0.24 10−8 m3 kg−1) values are similar to Units 6–9. Burrows are found in association with the contact of Units 5 and 4, while the contact between Unit 4 and the overlying Unit 3 is sharp.
The poorly sorted, fine sand-silt texture of Units 9–4 is consistent with sedimentation in an alluvial setting, likely within a low-energy floodplain (Walling et al., Reference Walling, Fang, Nicholas, Sweet, Golosov, Belyaev and Walling2004). The occurrences of pedofeatures throughout these strata are indicative of the development of a cumulative palaeosol within the alluvial parent material. This is reflected in the relatively high χlf values throughout the strata, which are consistent with magnetic enhancement associated with pedogenic processes (Dearing, Reference Dearing1999). Variations in χlf values through these strata likely indicate varying contributions of diamagnetic calcium carbonate to the magnetic signal; the highest χlf values are associated with Unit 5, which has the lowest calcium carbonate content in this part of the sequence (Fig. 5). Collectively, Units 9–4 form a composite palaeosol of multiple Bt/Bk horizons (Pedocomplex I). IRSL age estimates from Unit 9 are 111 ± 21 ka (Alapars-OSL3) and 106 ± 10 ka (Alapars-OSL4).

Figure 5. Bivariate plot comparing mean grain size and sorting of Alapars-1 sediments. Mean grain size and sorting are presented on the phi scale and have been calculated following the measures described by Folk and Ward Reference Folk and Ward1957.
Units 3–2 (153–56 cm bd)
Unit 3 is characterised by carbonate structures with a small fraction of siliciclastic material. Present in the unit is a 4–8-mm-thick horizontal and sub-horizontal laminated micritic calcite. Interspersed between these beds are granule-sized sub-spherical carbonate-coated grains, silt-sized non-carbonate grains, and granule-sized clasts of reworked pumice lapilli. As one moves upwards through the unit an increase in carbonate content is observable, and carbonate beds ranging in thickness from 2–6 mm appear; the beds dip between 5° and 10° to the northeast. These features are represented by high CaCO3 values thoughout the unit, ranging from 35% to 55%. Associated with these high CaCO3 values is a concomitant decrease in χlf values to 0.13 10−8 m3 kg−1 and TOC of 0.9%. There is a sharp boundary between Unit 3 and the overlying Unit 2. Unit 2 consists of massive, well-sorted silt with powdery carbonate dispersed throughout. Within Unit 2 is a continuous band of cobble-sized clasts (88 cm bd); these are sub-rounded and comprise rhyolitic lithologies with carbonate coatings (see Fig. 3B). Associated with Unit 2 is an increase in TOC in comparison with the underlying strata (ca. 1.2%), a decrease in CaCO3 content throughout the stratum (from 40% to 15%), and an increase in χlf values to 0.24 10−8 m3 kg−1.
On the basis of our field observations, we have interpreted Unit 3 as microbially influenced calcrete (Knox, Reference Knox1977; Goudie,Reference Goudie, Goudie and Pye1983; Wright, Reference Wright1989; Genise et al., Reference Genise, Alonso-Zarza, Verde and Meléndez2013), representing the terrestrial accumulation of calcium carbonate in the vadose zone, most likely in a semi-arid climatic regime (Wright, Reference Wright, Nash and McLaren2007; Alonso-Zarza and Wright, Reference Alonso-Zarza and Wright2010). An aeolian origin of the non-carbonate fraction is suggested by the grain-size distribution of this stratum, which exhibits a shift to a finer texture (see Fig. 5) in comparison to underlying strata (Fedoroff et al., Reference Fedoroff, Courty, Lacroix and Oleschko1994; Alonso-Zarza and Silva, Reference Alonso-Zarza and Silva2002; Meléndez et al., Reference Meléndez, Alonso-Zarza and Sancho2011; Huerta et al., Reference Huerta, Rodríguez-Berriguete, Martín-García, Martín-Pérez, Fernández and Alonso-Zarza2015). The well-sorted nature and medium-fine silt texture of Unit 2 (see Fig. 5) is also consistent with aeolian source material. Taken together, Units 2 and 3 represent the down-sequence accumulation of calcium carbonate associated with soil-forming processes (Wright, Reference Wright, Nash and McLaren2007). This is demonstrated through the progressive enrichment of carbonate through Units 2 and 3 and the development of laminar calcrete within Unit 3, indicating pedogenic modification of aeolian parent material. The occurrence of sub-rounded cobble-sized clasts within Unit 2 represents a gravel lag, likely formed by deposition via fluvial processes, potentially a high flow event, followed by deflation of fine-grained material. We interpret Unit 2 as reworked rather than primary aeolian deposits, reflecting the combination of sub-aerial and sub-aqueous weathering and then erosive processes that have acted upon them. Together, Units 3 and 2 represent a compound Bk horizon as part of Pedocomplex II. IRSL age estimates for the two upper samples from Unit 2 are 63 ± 6 ka (Alapars-OSL1) and 67 ± 7 ka (Alapars-OSL2) (see Table 1).
Unit 1 (56–0 cm bd)
The uppermost strata of the Alapars-1 sequence are represented by Units 1b and 1a. Unit 1b has a sharp lower contact with Unit 2, characterised by the presence of vertical and sub-vertical cm-scale burrows and isolated clasts of pumice lapilli. Unit 1b comprises well-sorted silt with cm-scale blocky peds and frequent carbonate rhizoliths. At the top of the sequence, Unit 1a comprises well-sorted humic silt-clay with dispersed sub-rounded pebbles. The current land surface was affected by ploughing. These units are interpreted as Bk and Ap horizons, respectively.
Archaeological stratigraphy and lithic analysis
Lithic analysis
The lithic artefacts were recovered from three distinct positions within the depositional sequence at Alapars-1: Lithic Assemblage A (Units 9–4), Lithic Assemblage B (Unit 2), and Lithic Assemblage C (Units 1a and 1b). Only lithic artefacts were retrieved; faunal remains, if once present, were not preserved. All three assemblages share common MP characteristics, principally Levallois reduction sequences, and no diagnostic artefacts indicative of previous or later periods have been identified. The three assemblages vary in density of artefacts per m3, preservation and size of the artefacts, and the relative frequencies of the main techno-typological traits (Table 3).
Table 3. Alapars-1: technological breakdown.

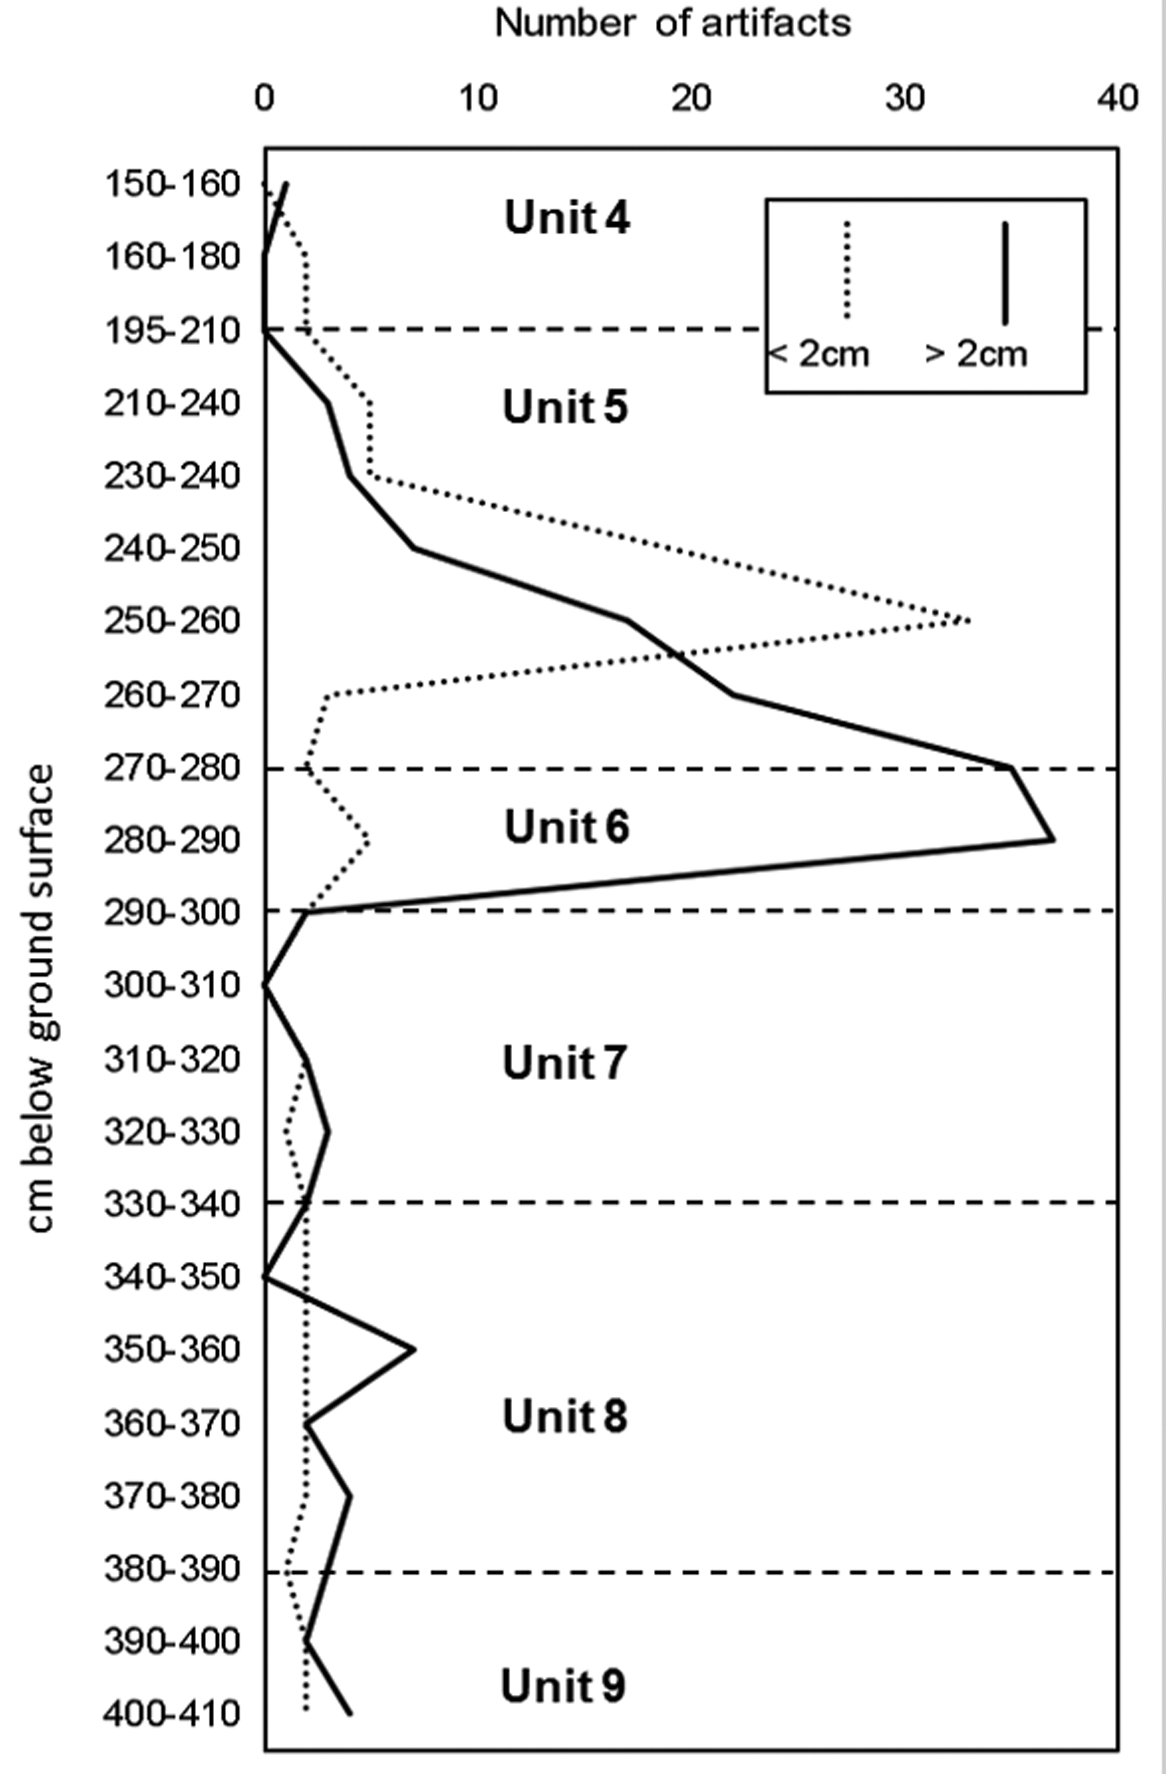
Lithic Assemblage A is dispersed vertically at a very low density over a depth range of ca. 260 cm, yet 75% of artefacts >2 cm (n = 128) and 69% of artefacts <2 cm (n = 254) were recovered from a ca. 60-cm vertical spread in Units 5 and 6 (Fig. 6). This concentration of artefacts is at a low density of 57 artefacts per m3. However, the density of artefacts per m3 in the rest of this sequence is lower still at eight artefacts per m3 (see Fig. 6, Table 3; n = 540, 171 ≥2 cm). Importantly, the concentration appears in two different depositional units within a cumulative palaeosols (Units 5 and 6), thus reflecting deposition over a prolonged period of accumulation.

Figure 6. Vertical distribution of lithic Assemblage A within Units 9–4.
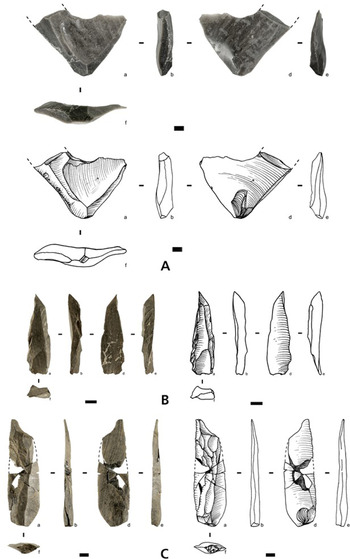
Lithic Assemblage A (n = 471, 285 ≥2 cm) is primarily composed of well-preserved small non-Levallois flakes (30.6% of the assemblage; Fig. 7A. is an exceptionally large flake). Levallois by-products appear in low frequencies (2.1% of the assemblage), mainly as flake blanks. A low frequency of Kombewa flakes (n = 10, 1.9%) was also observed. Such flakes are commonly by-products of core-on-flake reduction. Four blades were found, comprising 0.7% of the total assemblage (see Fig. 7A–B). One of the blades derives from a Levallois reduction sequence (sensu Boëda, Reference Boëda, Dibble and Bar-Yosef1995; Delagnes, Reference Delagnes2000) (see Fig. 7C). Concomitant with a Levallois approach, a ridge blade stemming from a laminar production was found (see Fig. 7B). This ridge blade is a result of rejuvenation of a core from its narrow side. Such a mode of rejuvenation is typical for laminar production (e.g., Meignen, Reference Meignen, Bar-Yosef, Akazawa and Aoki1998; Delagnes, Reference Delagnes2000) (see Fig. 7B). Two bladelets (0.4%) were also recovered (defined as length ≤50 mm, width ≤12 mm; see Bar-Yosef, Reference Bar-Yosef, Cauvin and Sanlaville1981). The blades and bladelets vary in size. Diverse modes of production are represented, of which only partial technological stages are represented on-site. The variation in size, the diversity in methods of manufacture, and the fragmentation of the reduction sequence all suggest that blades were produced off site and then transported to this locale.

Figure 7. (color online) (A) Broken flake (Assemblage A); (B) ridge blade (Assemblage A); (C) Levallois blade (Assemblage A).
The average maximum length of the debitage is 30 ± 13 mm (n = 155), with a maximum width of 19 ± 8 mm (n = 155) and a maximum thickness of 6 ± 3 mm (n = 155). The few retouched pieces (n = 7) are larger than the debitage, with an average of 46 ± 14 mm in maximum length, 31 ± 11 mm in maximum width, and 9 ± 4 mm in maximum thickness.
Lithic Assemblage B (n = 471, 285 ≥2 cm, 196 artefacts per m3) is associated with the carbonate-rich, pedogenically modified aeolian parent material of Unit 2. This assemblage is principally composed of both non-Levallois flakes and Levallois flakes and blades, with low frequencies of retouched blanks and cores (see Table 3). Assemblage B also includes cores and core trimming elements (CTEs), suggesting the initial stages of reduction (Fig. 8A–D, see Table 3). Three main core-reduction sequences can be identified: recurrent uni-polar-convergent Levallois flaking (see Fig. 8A–B), core-on-flake reduction (see Fig. 8C–D), and a low frequency of the end-products of blade production (n = 10, 2.1%, see Fig. 9A). Five Levallois uni-polar-convergent cores comprise 27.8% of the cores in Assemblage B. Among the debitage, Levallois blanks and CTEs appear at low frequencies (n = 10, 2.1% of Assemblage B, see Table 3). The Levallois CTEs mainly preserve lateral core curvatures (i.e., débordant, Fig. 9B), with only two overshot flakes. Cores-on-flakes are the most common core category in Assemblage B (n = 10, 55.6% of cores, see Fig. 8C–D). The average maximum dimensions of cores-on-flakes are 53 ± 16 mm in length (n = 10), 43 ± 13 mm in width (n = 10), and 17 ± 7 mm in thickness (n = 10). Comparison with average debitage dimensions (40 ± 18 mm for maximum length, 27 ± 11 mm maximum width, and 11 ± 6 mm maximum thickness, n = 225) suggests a deliberate selection of wider and thicker blanks for use as cores-on-flakes. Two-tailed t-tests indicate that cores-on-flakes are significantly wider and thicker than the debitage (width: t = 3.35, degrees of freedom (df) = 275, P <0.05; thickness: t = 2.53, df = 276, P = 0.03). Cores-on-flakes vary in their mode of preparation: some lack preparation of a striking platform prior to the removal of secondary blanks (see Fig. 8C), while, in a few instances, truncation was used as a preparatory stage prior to the secondary removal of flakes (following Schroëder, Reference Schroëder1969 or Solecki and Solecki, Reference Solecki and Solecki1970) (see Fig. 8D).
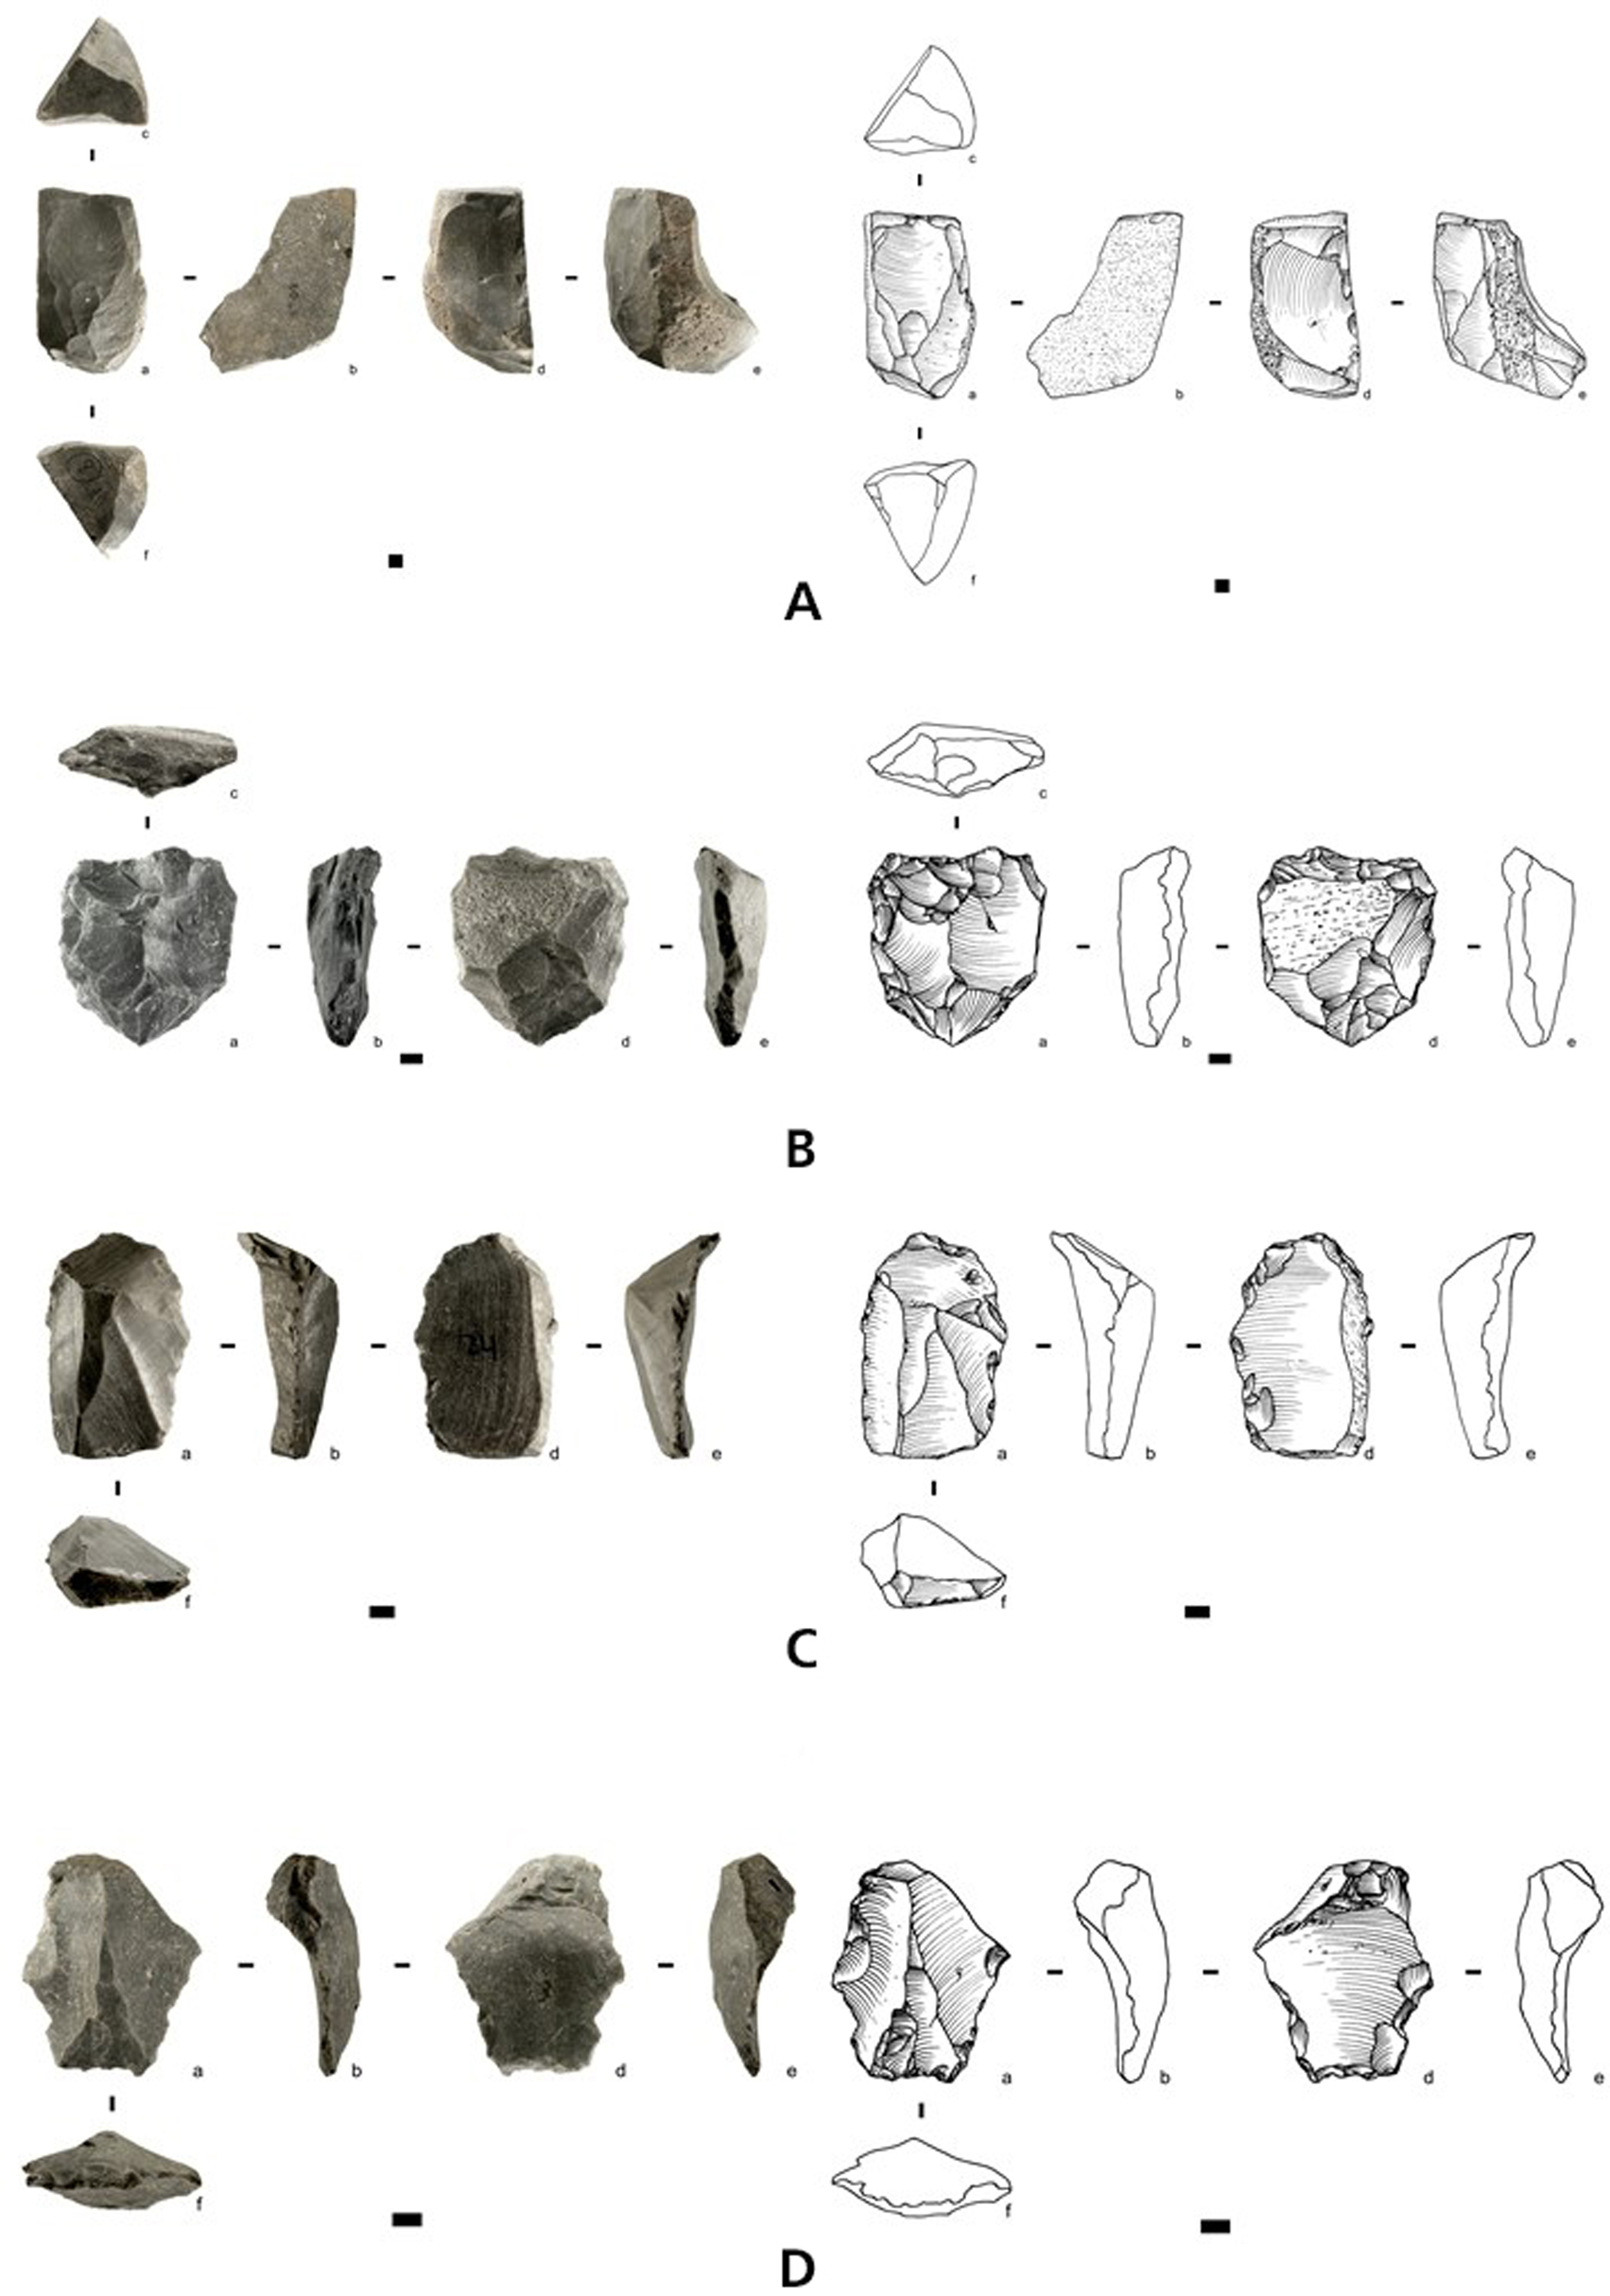
Figure 8. (color online) A-B) Levallois cores (Assemblage B); (C-D) core-on-flake artefacts (Assemblage B).

Figure 9. (color online) (A) Blade (Assemblage B); (B) core trimming element–débordant (Assemblage B); (C) Levallois flake (Assemblage B).
Lithic Assemblage C (n = 1399, 762 ≥2 cm, 350 artefacts per m3) is composed largely of non-Levallois flakes (n = 463, 33.1%) to a considerable degree. Levallois flakes (n = 8, 0.6%), CTEs (n = 33, 2.4%), a few tools (n = 51, 3.6%), and cores (n = 70, 5%) occur at lower frequencies (see Table 3). Only MP artefacts were recovered. This assemblage was recovered from the upper soil horizons of Pedocomplex II which, as discussed above, likely represents a modification of the most recent land surface by ploughing. Consequently, the assemblage was classed as being in a secondary context and no attribute analysis was performed.
In all analysed assemblages, the frequency of breakage among pieces >2 cm in maximum dimension is relatively high, at 85% in Assemblage B and 90% in Assemblage A. Yet, the preservation of the scars and edges in Assemblage A differs greatly from Assemblages B and C (see Burroni et al., Reference Burroni, Donahue, Pollard and Mussi2002 for definitions of the terms used). In Assemblage A, 88.3% of the debitage pieces are fresh, while in Assemblage B only 49.3% are fresh, with 41.8% slightly abraded and 8.9% heavily abraded. A similar differential pattern occurs regarding artefact weathering, with patinated items in Assemblage A amounting to only 11.0% of the artefacts, while in Assemblage B 42.7% of the debitage is patinated. Abrasion of artefacts suggests their movement in water and/or sediments (Burroni et al., Reference Burroni, Donahue, Pollard and Mussi2002).
Another indicator of the depositional differences between Assemblages A and B is the low number of artefacts <2 cm in maximum dimension in Assemblage B (39.5%), compared to their abundance in Assemblage A (68.3%, see Table 3). The higher proportion of small artefacts in Assemblage A runs counter to the lack of indications for on-site knapping. In contrast, Assemblage B, with its indications of on-site knapping, displays a much lower relative frequency of the small fraction (see below). Based on experimental studies, the expected proportion of artefacts <2 cm in undisturbed assemblages resulting from discrete knapping events ranges between 60% and 85% of all artefacts (Schick, Reference Schick1986). Such a discrepancy between the expected proportion of artefacts <2 cm and the proportion found in Assemblage B can be interpreted as the result of post-depositional winnowing of the smaller and lighter artefacts by low-energy water flow. The low frequency of small artefacts in Assemblage B and the combination of abrasion and weathering features on larger artefacts are likely products of the complex depositional history of Unit 2. The documented phases of deposition, deflation, and post-depositional translocation of material all likely resulted in the recurring exposure of artefacts to atmospheric conditions.
Beyond site formation differences, there are also differences in the relative frequencies of the main technological categories between the Lithic Assemblages A and B (see Table 3). In Assemblage A, there are fewer indications for on-site knapping: only a small number of cores, low frequencies of primary elements (with cortex covering more than 50% of dorsal surfaces), few CTEs, and no hammerstones were found (see Table 3).
Retouched artefacts in Assemblages A and B share common features related to the selection of blanks. The retouched component in Assemblage B averages 56 ± 27 mm in maximum length, 35 ± 15 mm in maximum width, and 14 ± 6 mm in maximum thickness (n = 43). The blanks chosen for further retouch are larger in Assemblages A and B than the debitage (see above) (see Fig. 9). In addition, variation in the relative frequencies of the retouched pieces among the two assemblages is observable, with significantly more retouched blanks in Assemblage B than Assemblage A (9.1% vs. 1.3% respectively; χ2 = 30.62, df = 1, P <0.05; see Table 3).
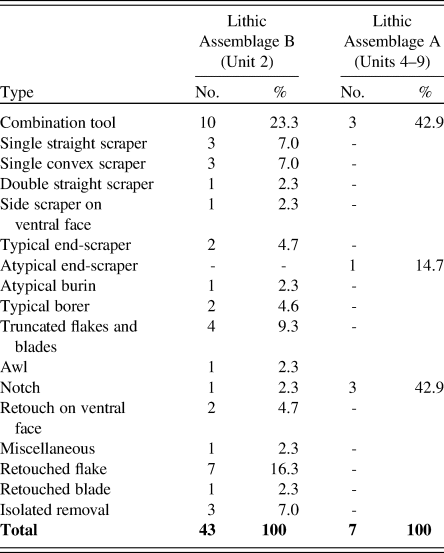
Classifying edge modifications as intentional retouch in Assemblage B was difficult due to post-depositional forces possibly mimicking retouch. However, despite this confounding factor and our necessarily conservative classification, Assemblage B contains a larger variety of tool types than Assemblage A. These include combination tools (mixtures of scraper retouch, truncation, and notches or isolated removals, e.g., Fig. 10A–B) and other tool types such as scrapers, retouched pieces, and truncations. Assemblage A, on the other hand, contains mainly combination tools (retouched flakes and end-scrapers) and end-scrapers and notches (following Bordes, Reference Bordes1961) (Table 4).

Figure 10. (color online) (A) Combination tool (scraper on ventral face and retouched flake); (B) combination tool (end-scraper and retouched flake); both from Assemblage B.
Table 4. Alapars-1: typological makeup of retouched tools.

Assemblage B exhibits evidence for nearly all stages of core reduction, including flake production, tool production, and use. The relatively high frequency of retouched artefacts in Assemblage B, many of which exhibit more than one type or location of retouch, suggests longer histories of use and reuse of these items. The comparisons between the techno-typological traits of Assemblages A and B, taking into account differences in artefact density and tool frequencies, suggest a longer duration of occupation and/or more frequent re-occupations during the times of deposition of Assemblage B when compared to the relatively short or infrequent occupations that resulted in Assemblage A.
Obsidian artefact sourcing
Artefacts from all stratigraphic units were analysed using pXRF to determine their elemental compositions and, in turn, volcanic sources (n = 736). Figure 11A is a scatter plot of Zr/Rb versus Sr/Rb, showing the obsidian sources that match the analysed artefacts. These source attributions are principally based on ratios between the so-called “mid-Z” elements (i.e., Rb to Nb), which yield reliable values for irregular, small, or weathered obsidian artefacts (see Frahm, Reference Frahm2016, and references therein). Out of 736 artefacts (72.8% of Assemblages A and B), 715 (97.1%) matched sources in the GVC, within which the site is located (see Fig. 11B). Obsidian from deposits other than those local to the GVC was identified only in Assemblage B (n = 21, 4.5%). Fourteen of these latter artefacts (3.0% of Assemblage B) match the three obsidian sources in the Tsaghkunyats volcanic area ca. 50 km to the northwest. Of these, a chip and a flake match the Tsaghkunyats-1 source, and a retouched tool and five artefacts were identified from the Tsaghkunyats-2 source. Two cores and four broken flakes match the Tsaghkunyats-3 obsidian source. A further six artefacts (1.3%), including chips and a CTE, were made on obsidian from the Hatis volcano ca. 10 km to the south of the GVC. Of all the analysed artefacts from Assemblage B, just one tool (0.2%) was made on obsidian from Pokr Arteni, located ca. 75 km as the crow flies to the west and >100 km on foot (see Fig. 11B).

Figure 11. (color online) (A) Scatter plot of Zr and Rb, both normalized to Sr to minimize size effects, for Alapars-1 artefacts and the corresponding geological reference specimens; (A) locations of obsidian sources in relation to Alapars-1.
DISCUSSION
Model of sediment accumulation and landscape development
The sequence at Alapars-1 has yielded evidence for multiple phases of sediment deposition and landscape stability during the late middle and late Pleistocene. A key feature of the Alapars-1 sequence is the geomorphic association with the Fantan Dome. A K-Ar date, yielding an age of 480 ± 50 ka, has been produced on obsidian that may derive from the dome (Lebedev et al., Reference Lebedev, Chernyshev and Yakushev2011). Although chronological evidence from the Alapars-1 sequence indicates a younger date for the sediment deposition, stratigraphic evidence indicates that sediments were unlikely to have been deposited after the formation of the dome in its current morphological state. For example, Unit 10 exhibits a dip of 10–16° to the northeast (see Fig. 2, Table 2), which is an unnaturally steep slope for channel or locally derived debris flow deposits given the current geometry of the landscape (see Fig. 2). Furthermore, the formation of the laminar calcrete characterising Unit 3 would have likely occurred in areas of subdued relief. Finally, the absence of colluvial deposits comprising material from the dome within the sequence also strongly suggests that deposition of the sediments in Alapars-1 occurred prior to dome formation, but after the deposition of the obsidian and dacite that compose the upper layers of the dome. On this basis, two scenarios explaining the stratigraphic relationship between the dome and the Alapars-1 sequence can be put forward (Fig. 12).

Figure 12. Hypothesised model of dome formation and sedimentation at Alapars-1. Scenario 1 represents exogenous dome growth, sedimentation, and endogenous dome inflation; Scenario 2 represents cryptodome formation resulting in deformation of overlying Alapars-1 sediment strata and volcanic deposits associated with the Gutansar volcanic complex.
First, the extrusion of the obsidian and lava occurred prior to the formation of the Alapars-1 sequence, resulting in the formation of a low, shallow-gradient lava dome (Fink, Reference Fink1983) (see Fig. 12, scenario 1). This was followed by the deposition of the Alapars-1 sediments, during which endogenic dome activity occurred, resulting in the inflation of the dome to its current morphological state. Thus, the K-Ar and FT ages from the Fantan Dome represent the earlier phase of exogenous volcanic activity.
The second scenario is that the Fantan Dome represents a cryptodome (Williams and McBirney, Reference Williams and McBirney1979; McPhie et al., Reference McPhie, Doyle and Allen1993; Stewart and McPhie, Reference Stewart and McPhie2003). In this case, intrusive magmatic activity occurred after the emplacement of the Alapars-1 sediments, resulting in the uplift and tilting of the sediment strata and underlying volcanic deposits. In this scenario, the K-Ar dates represent the age of the volcanic deposits that were uplifted as a consequence of later intrusive activity (see Fig. 12, scenario 2). It is important to note that the obsidian and the perlitic and rhyolitic lavas mapped in the vicinity of the Fantan Dome are part of the GVC. These have been dated to broadly the same time span as the obsidian from the Fantan Dome and are also chemically indistinguishable (Karapetian et al., Reference Karapetian, Jrbashian and Mnatsakanian2001; Lebedev et al., Reference Lebedev, Chernyshev and Yakushev2011; Frahm et al., Reference Frahm, Feinberg, Schmidt-Magee, Wilkinson, Gasparyan, Yeritsyan, Karapetian, Meliksetian, Muth and Adler2014). Whichever scenario is correct, the mechanism of the obsidian emplacement in the Fantan Dome, the mode of the dome's formation, and their relationship with the Alapars-1 sequence cannot be fully elucidated without comprehensive petrological, geochemical, and chronological investigations.
Although detailed micromorphological and geochemical analyses of samples from Alapars-1 are currently ongoing, the lithostratigraphic evidence reported here provides broad indications of landscape changes occurring in the area during several intervals of the late middle and late Pleistocene. The earliest deposits at Alapars-1, represented by Units 12–9, indicate several phases of alluvial deposition and pedogenesis subsequent to the emplacement of the lava at the base of the sequence. The onset of fluvial activity at the site is associated with the local reworking of the pumice lapilli deposits, of which several outcrops have been identified in the locality of Alapars-1 (Sherriff et al., Reference Sherriff, Wilkinson, Adler, Arakelyan, Beverly, Blockley and Gasparyan2019). Following this was an episode of stasis during which the pumice deposits were exposed to sub-aerial weathering, and a soil developed as a result (Soil Horizon I). This was followed by the reestablishment of a fluvial system under a higher-energy flow regime. The bed-form geometry of Units 10a and 10b indicates the stream channel ran in a southeast to northwest direction and likely emanated from the high elevation area around the flanks of the Gutansar volcano. Indeed, the present-day topography of the Alarpars-1 locale indicates the occurrence of previous stream activity, with several broadly south to north dry valleys dissecting the lava plateau on which Alapars-1 lies.
Although it was not possible to directly date the deposits of Units 12–10, the IRSL chronology from Unit 9 provides a minimum age estimate, indicating that the lower strata at Alapars-1 were formed prior to 110 ka. Given that, and based on the current chronological evidence from the GVC (namely that the emplacement of volcanogenic deposits in the vicinity of Alapars-1 occurred around 550 ka [MIS 13]), we can hypothesise that the deposition of the Alapars-1 lower strata occurred at some stage during the MIS 12–6 interval.
Units 9–4 mark a shift to lower-energy alluvial sedimentation and accretionary pedogenesis, forming a compound soil profile of several Bt–Bk horizons as a result (Pedocomplex I). Based on the IRSL age estimates of 111 ± 21 ka and 106 ± 10 ka for Unit 9, this shift took place during MIS 5e–5c. Units 9–4 contain the oldest lithic assemblage at the site (Assemblage A). Most artefacts are concentrated at the boundary of Units 6–5, indicating that the earliest occupation of Alapars-1 occurred during MIS 5 (Fig. 13).

Figure 13. Alapars-1 morphogenic events and occupation levels plotted against Lake Van δ18O (blue line) and arboreal pollen percentage for the period 10–130 ka BP (Pickarski et al., Reference Pickarski, Kwiecien, Langgut, Djamali and Litt2015a, Reference Pickarski, Kwiecien, Langgut and Litt2015b). (For interpretation of the references to color in this figure legend, the reader is referred to the web version of this article.)
The occurrence of several Bt–Bk horizons at Alapars-1 may indicate that conditions were warm and humid during MIS 5. Elsewhere in Armenia, there is evidence for the development of similar soil profiles associated with interglacial warmth (see Wolf et al., Reference Wolf, Baumgart, Meszner, Fülling, Haubold, Sahakyan, Meliksetian and Faust2016; Trigui et al., Reference Trigui, Wolf, Sahakyan, Hovakimyan, Sahakyan, Zech, Fuchs, Wolpert, Zech and Faust2019; Richter et al., Reference Richter, Wolf, Walther, Meng, Sahakyan, Hovakimyan, Wolpert, Fuchs and Faust2020). Although fragmentary in nature, the evidence from these sequences correlates well with palynological evidence from the long lacustrine sequences at Lake Van, Turkey (Litt et al., Reference Litt, Pickarski, Heumann, Stockhecke and Tzedakis2014) and Lake Urmia, Iran (Djamali et al., Reference Djamali, de Beaulieu, Shah-hosseini, Andrieu-Ponel, Ponel, Amini and Akhani2008; Stevens et al., Reference Stevens, Djamali, Andrieu-Ponel and Louis de Beaulieu2012), where warm and humid interglacial periods dominated by the expansion of open deciduous oak steppe-forest are postulated.
A third shift in depositional environment in the Alapars-1 sequence is marked by the onset of aeolian sedimentation associated with Unit 3. While it was not possible to date Unit 3, the IRSL chronology of Unit 2 suggests that the shift to aeolian deposition and sustained periods of arid conditions had already occurred prior to 63 ± 6 ka and 67 ± 7 ka (MIS 4), possibly during the later substages of MIS 5 or early MIS 4. The combined palynological, n-alkane, and geochemical evidence from Lake Van indicates that late MIS 5 and MIS 4 were characterised by dry conditions, punctuated with intervals of warm and wetter conditions (Pickarski et al., Reference Pickarski, Kwiecien, Langgut, Djamali and Litt2015a, Reference Pickarski, Kwiecien, Langgut and Litt2015b; Randlett et al., Reference Randlett, Bechtel, van der Meer, Peterse, Litt, Pickarski, Kwiecien, Stockhecke, Wehrli and Schubert2017).
The shift to aeolian deposition in Unit 3 must have been followed by pedogenesis, and therefore stability, given the development of pedogenic carbonates as manifested by field evidence and high CaCO3e concentrations. The presence of a well-developed laminar calcrete within the Alapars-1 sequence indicates formation under semi-arid conditions (Candy et al., Reference Candy, Black, Sellwood and Rowan2003). Determining the exact timing of the calcrete development at Alapars-1 is, though, challenging because of the multi-episodic nature of calcrete formation (see Wright, Reference Wright, Nash and McLaren2007) and the absence of chronometric dates from the relevant deposits. However, based on the macroscale sedimentological evidence, it is hypothesised that calcrete formation at Alapars-1 would have occurred subsequent to aeolian deposition and is therefore likely to post-date the IRSL ages of Unit 2. Nevertheless, further geochemical and chronological study of the deposit is needed to fully elucidate the timing and nature of this formation.
Sedimentological evidence from Unit 2 indicates a complex depositional history comprising four main phases: (1) aeolian sedimentation, (2) formation of a gravel lag associated with fluvial deposition and later deflation of fine-grained material, (3) a return to aeolian sedimentation, and (4) carbonate precipitation associated with pedogenesis and the formation of Pedocomplex II. Aeolian material may have been transported from a number of local and regional sources, and while an absence of geochemical evidence from the aeolian deposits at Alapars-1 precludes an interpretation of likely sources, it is important to note that other aeolian deposits have been identified elsewhere in the Hrazdan Basin (Sherriff et al., Reference Sherriff, Wilkinson, Adler, Arakelyan, Beverly, Blockley and Gasparyan2019). The occurrence of a gravel lag indicates that, during this episode of aeolian deposition, fluvial systems may still have been active, albeit likely ephemeral in nature.
Units 1a and 1b represent the development of the uppermost strata that are overprinted by Pedocomplex II and which have been subjected to modern ploughing. Lithic Assemblage A was recovered from Unit 1 and contains exclusively MP artefacts most likely eroded or reworked from the top of Unit 2.
The chronological and environmental context of the Alapars-1 occupations
The current spatiotemporal distribution of MP sites in the Southern Caucasus and the Armenian highland may be a product of hominin settlement patterns, landscape abandonment, current research bias, or a mixture of these and other factors. Neither the connections between the distribution of sites and climatic oscillations, nor the interregional effects of environmental changes on population dynamics are clear. For example, the MIS 5e interglacial is regarded as a period during which H. sapiens dispersed out of Africa and into Eurasia (e.g., Groucutt et al., Reference Groucutt, Petraglia, Bailey, Scerri, Parton, Clark-Balzan and Jennings2015). It has been suggested that major barriers to this dispersal, such as the Sahara Desert (northern Africa) and Negev Desert (Israel), became ecologically suitable and receptive to exchanges of faunal communities and human populations during that time (e.g., Vaks et al., Reference Vaks, Bar-Matthews, Ayalon, Matthews, Halicz and Frumkin2007; Groucutt et al., Reference Groucutt, Petraglia, Bailey, Scerri, Parton, Clark-Balzan and Jennings2015; Breeze et al., Reference Breeze, Groucutt, Drake, White, Jennings and Petraglia2016; Frumkin and Comay, Reference Frumkin and Comay2019). The most secure examples of H. sapiens ascribed to this phase are found in the Levant and include Qafzeh (Vandermeersch, Reference Vandermeersch1981; Schwarcz et al., Reference Schwarcz, Grun, Vandermeersch, Bar-Yosef, Valladas and Tchernov1988; Valladas et al., Reference Valladas, Reyss, Joron, Valladas, Bar-Yosef and Vandermeersch1988) and Skhul (McCown and Keith, Reference McCown and Keith1939; Mercier et al., Reference Mercier, Valladas, Bar-Yosef, Vandermeersch, Stringer and Joron1993; Grün et al., Reference Grün, Stringer, McDermott, Nathan, Porat, Robertson, Taylor, Mortimer, Eggins and McCulloch2005). However, in recent years, the palaeoclimatic record in the Levant for the later stages of MIS 5 has been interpreted as a period of marked aridity (e.g., Neugebauer et al., Reference Neugebauer, Schwab, Waldmann, Tjallingii, Frank, Hadzhiivanova and Naumann2016; Kiro et al., Reference Kiro, Goldstein, Garcia-Veigas, Levy, Kushnir, Stein and Lazar2017; Palchan et al., Reference Palchan, Neugebauer, Amitai, Waldmann, Schwab, Dulski, Brauer, Stein, Erel and Enzel2017). In contrast to the palaeoclimatic proxies from Lake Lisan (the lacustrine forerunner of the present Dead Sea), the MIS 5 proxies from Lake Van suggest a shift to progressively warmer and wetter conditions within three periods of MIS 5: MIS 5e–d (124.1–111.5 ka); MIS 5c (107.8–87.2 ka), and MIS 5a (84.9–77.5 ka) (Pickarski et al., Reference Pickarski, Kwiecien, Langgut, Djamali and Litt2015a, Reference Pickarski, Kwiecien, Langgut and Litt2015b; Kappenberg et al., Reference Kappenberg, Lehndorff, Pickarski, Litt and Amelung2019). The oscillations between these climatic periods likely triggered regional-to-local changes in the seasonal distribution of rainfall (see Rowe et al., Reference Rowe, Mason, Andrews, Marca, Thomas, Van Calsteren, Jex, Vonhof and Al-Omari2012; Stockhecke et al., Reference Stockhecke, Timmermann, Kipfer, Haug, Kwiecien, Friedrich, Menviel, Litt, Pickarski and Anselmetti2016). It has also been argued that climate, and specifically that of MIS 5, may not have been the determinant factor in the movement of hominin populations between Africa and Eurasia (Breeze et al., Reference Breeze, Groucutt, Drake, White, Jennings and Petraglia2016; Timmermann and Friedrich, Reference Timmermann and Friedrich2016; Greenbaum et al., Reference Greenbaum, Kolodny, Hovers, Feldman and Friesem2018). Based on these data, it should be expected that during MIS 5 there would be widespread evidence for the occupation of the Armenian highlands and the Southern Caucasus, whereas during MIS 4 and 3, when climatic conditions became more arid, hominin occupation should be expected to be limited.
Lithic Assemblage A is currently the second assemblage that can be attributed to MIS 5 in the Armenian highlands and the Southern Caucasus. The other was recovered at the site of Hovk-1, Unit 8, where a small lithic assemblage was found in a mainly natural accumulation of faunal material located at high elevation (2000 m asl), (Pinhasi et al., Reference Pinhasi, Gasparian, Wilkinson, Bailey, Bar-Oz, Bruch and Chataigner2008, Reference Pinhasi, Gasparian, Nahapetyan, Bar-Oz, Weissbrod, Bruch, Hovsepyan and Wilkinson2011). Assemblage A appears to represent repeated brief episodes of artefact maintenance and use. This assemblage contains mainly small items whose preservation suggests they were subject to fast burial. Interestingly, no long-distance transport of raw material was detected, and the assemblage derives completely from locally available raw material within the GVC, which falls within the expected daily foraging range of the site (Bailey and Davidson, Reference Bailey and Davidson1983).
During MIS 4 (71–57 ka) and mostly during MIS 3 (57–29 ka), there is a relatively higher abundance of archaeological assemblages in the Armenian highlands and the Southern Caucasus in comparison to any previous period (e.g., Adler et al., Reference Adler, Bar-Yosef, Belfer-Cohen, Tushabramishvili, Boaretto, Mercier, Valladas and Rink2008, Reference Adler, Yeritsyan, Wilkinson, Pinhasi, Bar-Oz, Nahapetyan and Bailey2012; Gasparyan et al., Reference Gasparyan, Egeland, Adler, Pinhasi, Glauberman, Haydosyan, Gasparyan and Arimura2014; Moncel at al., Reference Moncel, Pleurdeau, Pinhasi, Yeshurun, Agapishvili, Chevalier and Lebourdonnec2015; Glauberman et al., Reference Glauberman, Gasparyan, Wilkinson, Frahm, Raczynski-Henk, Haydosyan, Arakelyan, Karapetyan, Nahapetyan and Adler2016, Reference Glauberman, Gasparyan, Sherriff, Wilkinson, Li, Knul and Brittingham2020; Pleurdeau et al., Reference Pleurdeau, Moncel, Pinhasi, Yeshurun, Higham, Agapishvili and Bokeria2016; Douka and Higham, Reference Douka and Higham2017; Kandel et al., Reference Kandel, Gasparyan, Allué, Bigga, Bruch, Cullen and Frahm2017). Assemblage B, dated to 63 ± 6 and 67 ± 7 ka, adds to this corpus of sites, but is older than most of the others. This assemblage has been affected by the winnowing of smaller artefacts, as well as a reoccurring cycle of burial, surface exposure, and reburial. Assemblage B also exhibits techno-typological characteristics that are different from the underlying Assemblage A. In Assemblage B, there are indications of on-site knapping as represented by nearly all stages of core reduction, including flake production and use. This variability cannot be explained solely by differences in the post-depositional processes between Assemblages A and B.
The sourced obsidian artefacts from Assemblage B do not derive only from the local GVC area. A small number of artefacts are made on obsidian from sources located beyond the approximately 25-km daily foraging range (Bailey and Davidson, Reference Bailey and Davidson1983). Artefacts from obsidian sources closer to Alapars-1, namely the Hatis (ca. 10 km) and Tsaghkunyats sources (ca. 50 km), are represented by production classes of material. The most distant source (Pokr Arteni, ca. 75 km to the west as the crow flies and >100 km on foot) is represented by a retouched tool, conforming to the concept of individual provisioning (sensu Kuhn, Reference Kuhn1995).
In contrast with Assemblage A, the diversity of obsidian sources in Assemblage B may indicate either more extensive foraging trips of potentially longer duration or obsidian procurement, artefact manufacture, and use in the course of residential mobility by individuals equipped with mobile tool kits (sensu Binford, Reference Binford1979; Kuhn, Reference Kuhn1995). Most obsidian exploitation appears to have been associated with mobility and foraging forays within the daily exploration territory, while the longest obsidian transport distance was likely related to the social landscapes that extend beyond the immediate foraging scales (Tindale, Reference Tindale1974; Gamble, Reference Gamble1999). At the penecontemporaneous site of Lusakert-1 cave in the Hrazdan River valley and at the open-air site of Barozh 12 near the Arteni obsidian sources, similar raw material economies were observed (Frahm et al., Reference Frahm, Feinberg, Schmidt-Magee, Wilkinson, Gasparyan, Yeritsyan and Adler2016; Glauberman et al., Reference Glauberman, Gasparyan, Wilkinson, Frahm, Raczynski-Henk, Haydosyan, Arakelyan, Karapetyan, Nahapetyan and Adler2016).
The results from Alapars-1 suggest that during the ameliorated conditions of MIS 5, hominins ephemerally occupied the locality. A similar signature of ephemeral occupation was observed at the penecontemporaneous site of Hovk-1 (Pinhasi et al., Reference Pinhasi, Gasparian, Nahapetyan, Bar-Oz, Weissbrod, Bruch, Hovsepyan and Wilkinson2011). The emerging pattern could, therefore, be interpreted as signifying that either MIS 5 was a period characterised by low population densities, or alternatively that the lack of sites attributed to this time period is a result of taphonomic bias and/or limited research in the region. Similar interpretive scenarios have been discussed in the Western European record for the last interglacial, MIS 5e (e.g., Defleur and Desclaux, Reference Defleur and Desclaux2019; Defleur et al., Reference Defleur, Desclaux, Jabbour and Richards2020; vs. Slimak and Nicholson, Reference Slimak and Nicholson2020 debating those different interpretive scenarios).
During the glacial and interstadial periods (MIS 4–3) between ca. 71 and 29 ka, climates were generally drier and cooler, yet had intervals of warm and wetter conditions (Stockhecke et al., Reference Stockhecke, Timmermann, Kipfer, Haug, Kwiecien, Friedrich, Menviel, Litt, Pickarski and Anselmetti2016). During this period, occupation intensity, as documented in the number of sites and artefact densities, was apparently more substantial in the region.
CONCLUSIONS
This paper reports the findings from combined lithostratigraphic, chronometric, and archaeological analyses at the MP site of Alapars–1 in central Armenia. The site is situated in sedimentary deposits that cover an extrusive obsidian-rhyolitic dome within the GVC, is located at a high elevation of 1774 m asl, and contains lithic artefact assemblages indicative of the changing role of this locale within regional MP settlement systems. The Alapars-1 sequence provides evidence for three periods of MP occupation and changes in depositional environment during the MIS 5–3 interval.
The MIS 5 archaeological assemblages were recovered from a compound palaeosol that developed in an alluvial setting and suggest ephemeral occupations, with a focus on tool use and maintenance. Obsidian sourcing indicates utilisation of only locally occurring GVC obsidian. MIS 5 is regarded in eastern Anatolia as a period of warm, humid climates (Litt et al., Reference Litt, Pickarski, Heumann, Stockhecke and Tzedakis2014, Pickarski et al., Reference Pickarski, Kwiecien, Langgut, Djamali and Litt2015a), but despite the resource-rich landscapes that likely resulted, Alapars-1 is only the second site in the region dating to this time interval. Other documented exposures in Armenia with well-developed compound palaeosols and associated biomarker evidence also indicate a relatively warm and stable climate during MIS 5 (e.g., Wolf et al., Reference Wolf, Baumgart, Meszner, Fülling, Haubold, Sahakyan, Meliksetian and Faust2016; Trigui et al., Reference Trigui, Wolf, Sahakyan, Hovakimyan, Sahakyan, Zech, Fuchs, Wolpert, Zech and Faust2019; Richter, Reference Richter, Wolf, Walther, Meng, Sahakyan, Hovakimyan, Wolpert, Fuchs and Faust2020). In contrast, during MIS 4–3, when climatic conditions are likely to have been be more arid and less stable in the region (Pickarski et al., Reference Pickarski, Kwiecien, Langgut and Litt2015b; Stockhecke et al., Reference Stockhecke, Timmermann, Kipfer, Haug, Kwiecien, Friedrich, Menviel, Litt, Pickarski and Anselmetti2016; Wolf et al., Reference Wolf, Baumgart, Meszner, Fülling, Haubold, Sahakyan, Meliksetian and Faust2016; Trigui et al., Reference Trigui, Wolf, Sahakyan, Hovakimyan, Sahakyan, Zech, Fuchs, Wolpert, Zech and Faust2019; Richter, Reference Richter, Wolf, Walther, Meng, Sahakyan, Hovakimyan, Wolpert, Fuchs and Faust2020), hominin occupations at Alapars-1 were more intensive than those documented during MIS 5. Lithic artefact assemblages of the latter document nearly all stages of core reduction, showing an emphasis on blank production, use, and maintenance. Indeed, despite a complex formation history during MIS 4–3, longer duration or more frequent occupations are documented, suggesting an evolving use of the locality over time. The MIS 4–3 artefact assemblages are produced on both local and distant obsidian sources, suggesting an obsidian exploitation territory that extended over a wide geographic area (the most distant raw material is located more than 100 km away on foot). It is worth noting that obsidian sourcing at regional MP sites indicates the long-distance exploitation of the same obsidian sources, with overlapping artefact transports among source areas and archaeological sites (Frahm et al., Reference Frahm, Feinberg, Schmidt-Magee, Wilkinson, Gasparyan, Yeritsyan, Karapetian, Meliksetian, Muth and Adler2014, Reference Frahm, Feinberg, Schmidt-Magee, Wilkinson, Gasparyan, Yeritsyan and Adler2016; Glauberman et al., Reference Glauberman, Gasparyan, Wilkinson, Frahm, Raczynski-Henk, Haydosyan, Arakelyan, Karapetyan, Nahapetyan and Adler2016, Reference Glauberman, Gasparyan, Sherriff, Wilkinson, Li, Knul and Brittingham2020). This pattern suggests that extensive social networks were well established in this region during MIS 4–3. Mobility over large territories represents an adaptive coping mechanism that minimizes the risk of seasonal and decadal resource fluctuation and depletion (Kuhn et al., Reference Kuhn, Raichlen and Clark2016).
The record from Alapars-1 adds to the growing corpus of widespread evidence of MP occupation of the Armenian highland and Southern Caucasus during MIS 4–3. The current MP record indicates that throughout the fluctuating environmental conditions of MIS 5–3 hunter-gatherers were well adapted to a diverse array of biomes that were segregated by sharp topographic gradients. MP sites of variable size and density with artefact and faunal assemblages have been documented in palaeo-lake margins in basins, fluvial/floodplain settings in a variety of topographic positions, and ecotones between mountain ranges and basins (Adler et al., Reference Adler, Bar-Oz, Belfer-Cohen and Bar-Yosef2006; Ghukasyan et al., Reference Ghukasyan, Colonge, Nahapetyan, Ollivier, Gasparyan, Monchot and Chataigner2011; Pinhasi et al., Reference Pinhasi, Gasparian, Nahapetyan, Bar-Oz, Weissbrod, Bruch, Hovsepyan and Wilkinson2011; Gasparyan et al., Reference Gasparyan, Egeland, Adler, Pinhasi, Glauberman, Haydosyan, Gasparyan and Arimura2014; Moncel et al., Reference Moncel, Pleurdeau, Pinhasi, Yeshurun, Agapishvili, Chevalier and Lebourdonnec2015; Egeland et al., Reference Egeland, Gasparian, Fadem, Nahapetyan, Arakelyan and Nicholson2016; Frahm et al., Reference Frahm, Feinberg, Schmidt-Magee, Wilkinson, Gasparyan, Yeritsyan and Adler2016; Sherriff et al., Reference Sherriff, Wilkinson, Adler, Arakelyan, Beverly, Blockley and Gasparyan2019; Glauberman et al., Reference Glauberman, Gasparyan, Sherriff, Wilkinson, Li, Knul and Brittingham2020). Alapars-1 documents repeated but variable high-elevation occupations, thus broadening our understanding of the range of niches MP hominins were capable of exploiting in the rugged and ecologically diverse terrain of the Armenian highland.
ACKNOWLEDGMENTS
We thank Pavel Avetisyan, Director of the Institute for Archaeology and Ethnography, National Academy of Sciences, Republic of Armenia, for his continued support of our research. We also thank Suren Kesejyan, Hovik Partevyan, Artur Petrosyan, Avetis Grigoryan, Samvel Nahapetyan, and the University of Connecticut students who worked at the site. Figures 6–9 were drawn and photographed by Garik Prevyan and Dmitri Arakelyan. We also wish to thank Karen Bayramyan, Head of the Protection of Monuments of History and Culture Agency for the Kotayk and Gegharkunik Provinces, the Ministry of Culture, Republic of Armenia, for his assistance during the fieldwork activities. AMB wishes to thank the Fulbright Postdoctoral Fellowship Program. The excavations and analyses were funded by the Leverhulme Trust (Grant RPG-2016-102), the University of Winchester, and the University of Connecticut's Norian Armenian Programs Committee and the Gfoeller Renaissance Foundation, USA. We are grateful to the editors and anonymous reviewers who provided invaluable suggestions that greatly improved the quality of this paper.
SUPPLEMENTARY MATERIAL
The supplementary material for this article can be found at https://doi.org/10.1017/qua.2020.61