


1. Introduction
Mid-crustal scale shear zones in the internal parts of mountain belts usually accommodate most of the regionally imposed deformation. Thus, kinematic reconstruction of rock flow within such shear zones is one of the most effective ways to constrain key aspects for the tectonic regime within orogenic systems. Use of vorticity analysis for estimating kinematics of rock flow in sheared rocks has proven to be a useful and effective tool for quantifying the nature and distribution of flow regimes within different tectonic settings including: contractional (Simpson & De Paor, Reference Simpson, De Paor and Sengupta1997; Xypolias & Doutsos, Reference Xypolias and Doutsos2000; Xypolias & Koukouvelas, Reference Xypolias and Koukouvelas2001; Xypolias & Kokkalas, Reference Xypolias, Kokkalas, Law, Searle and Godin2006), extensional (Wells, Reference Wells2001; Bailey & Eyster, Reference Bailey and Eyster2003; Faghih & Soleimani, Reference Faghih and Soleimani2015) and transpressional (Wallis, Reference Wallis1995; Klepeis, Daczko & Clarke, Reference Klepeis, Daczko and Clarke1999; Holcombe & Little, Reference Holcombe and Little2001; Bailey, Francis & Fahrney, Reference Bailey, Francis, Fahrney, Alsop, Holdsworth, McCaffrey and Hand2004) deformation regimes.
Microstructural studies on quartz are of great significance, especially for understanding the flow mechanisms and deformation patterns in natural shear zones (Bouchez & Pecher, Reference Bouchez and Pecher1981). Quartz c-axis fabric development is governed by the dominant slip systems and the strain path or the kinematic framework. Therefore, well-developed c-axis fabrics in mylonites can be used to characterize the kinematics of rock flow (Schmid & Casey, Reference Schmid, Casey, Hobbs and Heard1986; Sullivan & Law, Reference Sullivan and Law2007), the sense of shear (Law, Reference Law, Knipe and Rutter1990), the vorticity number associated with rock flow (Xypolias, Reference Xypolias2009), the dominant deformation mechanisms (Lister & Dornsiepen, Reference Lister and Dornsiepen1982; Stipp et al. Reference Stipp, Stunitz, Heilbronner and Schmid2002a ) and the deformation temperature (Kruhl, Reference Kruhl1996, Reference Kruhl1998; Law, Searle & Simpson, Reference Law, Searle and Simpson2004; Morgan & Law, Reference Morgan and Law2004; Law, Reference Law2014). Variation in the degree of asymmetry of the quartz c-axis fabrics has also been used in many studies (Law, Knipe & Dayan, Reference Law, Knipe and Dayan1984; Law, Casey & Knipe, Reference Law, Casey and Knipe1986; Platt & Behrmann, Reference Platt and Behrmann1986; Ratschbacher, Wenk & Sintubin, Reference Ratschbacher, Wenk and Sintubin1991; Grujic et al. Reference Grujic, Casey, Davidson, Hollister, Kundig, Pavlis and Schmid1996; Xypolias et al. Reference Xypolias, Spanos, Chatzaras, Kokkalas, Koukouvelas, Law, Butler, Holdsworth, Krabbendam and Strachan2010; Wagner et al. Reference Wagner, Lee, Hacker and Seward2010; Law et al. Reference Law, Stahr, Francsis, Ashley, Grasemann and Ahmad2013) to infer vorticity gradients associated with emplacement of metamorphic rocks along ductile thrusts.
Many investigations have focused on the kinematics of rock flow within the Sanandaj–Sirjan High Pressure – Low Temperature (HP–LT) metamorphic belt (Mohajjel & Fergusson, Reference Mohajjel and Fergusson2000; Sarkarinejad, Reference Sarkarinejad2007; Sheikholeslami et al. Reference Sheikholeslami, Pique, Mobayen, Sabzehei, Bellon and Hashem Emami2008; Sarkarinejad, Faghih & Grasemann, Reference Sarkarinejad, Faghih and Grasemann2008; Sarkarinejad, Godin & Faghih, Reference Sarkarinejad, Godin and Faghih2009; Alizadeh, López-Martínez & Sarkarinejad, Reference Alizadeh, López-Martínez and Sarkarinejad2010; Sarkarinejad & Keshavarz, Reference Sarkarinejad and Keshavarz2015), but few studies have been devoted to systematic study of the kinematics of flow in the high-grade metamorphic massifs. In this study, new microtectonic, finite strain, kinematic and vorticity data from ductile shear zones located in the Sirjan thrust sheet composed of high-grade metamorphic rocks within the HP–LT Sanandaj–Sirjan metamorphic belt are presented. The present study aims to semi-quantify the ductile deformation conditions in this thrust sheet using quartz c-axis fabric data in order to obtain information on strain variations, deformation temperature and variations in kinematics at different structural positions based on detailed field observations and quantitative microstructural analyses. The main importance of this work lies in the fact that it provides a systematic study of the development of quartz c-axis fabrics in the Sirjan thrust sheet, which formed during progressive exhumation/ductile extrusion of gneissic basement rocks now exposed in a structural window, located in the eastern part of the Zagros Mountains.
2. Geological setting
The Zagros orogenic belt is a curvilinear part of the Alpine–Himalaya mountain range and forms the northeastern margin of the Afro-Arabian continent (Ricou, Reference Ricou1971; Alavi, Reference Alavi1994; Sarkarinejad, Partabian & Faghih, Reference Sarkarinejad, Partabian and Faghih2013). This belt is the result of Early to Middle Eocene closure of the Neo-Tethys by oceanic crust consumption on a NE-dipping subduction zone below the Iranian microcontinent, before Late Cretaceous to Tertiary continental collision between the Afro-Arabian continent and the Iranian microcontinent (Stöcklin, Reference Stöcklin1968; Dewey et al. Reference Dewey, Pitman, Ryan and Bonini1973; Berberian & King, Reference Berberian and King1981; Blanc et al. Reference Blanc, Allen, Inger and Hassani2003; Ghasemi & Talbot, Reference Ghasemi and Talbot2006). The Zagros orogenic belt is composed of seven major sub-parallel tectonic elements (Sarkarinejad & Ghanbarian, Reference Sarkarinejad and Ghanbarian2014). They are, from southwest to northeast: (1) the Zagros foreland folded belt, (2) the Zagros foreland fold-and-thrust belt (Stöcklin, Reference Stöcklin1968; Berberian & King, Reference Berberian and King1981; Alavi, Reference Alavi1994), (3) the Zagros thrust system (ZTS; Sarkarinejad & Azizi, Reference Sarkarinejad and Azizi2008), (4) the Zagros suture zone (Stöcklin, Reference Stöcklin, Burk and Drake1974; Sarkarinejad, Reference Sarkarinejad2005), (5) the Zagros hinterland fold-and-thrust belt (Sarkarinejad & Ghanbarian, Reference Sarkarinejad and Ghanbarian2014), (6) the Sanandaj–Sirjan HP–LT/HT–LP paired metamorphic belts (Sarkarinejad, Reference Sarkarinejad1999), and (7) the Urumieh–Dokhtar magmatic belt (Stöcklin, Reference Stöcklin1968) (Fig. 1). Subduction of the Neo-Tethyan oceanic crust was accompanied by widespread Mesozoic and syn- to post-Eocene calc-alkaline magmatism in the upper plate, along the Sanandaj–Sirjan HP–LT metamorphic belt and the Urumieh–Dokhtar magmatic arc, respectively (Agard et al. Reference Agard, Omrani, Jolivet and Mouthereau2005). Post-collisional crustal shortening is still ongoing (Jackson & McKenzie, Reference Jackson and Mckenzie1984; Allen, Jackson & Walker, Reference Allen, Jackson and Walker2004; Regard et al. Reference Regard, Bollier, Thomas, Abbasi, Mercier, Shabanian, Feghhi and Soleymani2004; Tatar, Hatzfeld & Ghafory-Ashtiyani, Reference Tatar, Hatzfeld and Ghafory-Ashtiyani2004) with a N–S-oriented convergence rate of approximately 20 ± 2 mm yr−1 in the direction N 8° ± 5° E at the longitude of Bahrain (Vernant et al. Reference Vernant, Nilforoushan, Hatzfeld, Abbasi, Vigny, Masson, Nankali, Martinod, Ashtiani, Bayer, Tavakoli and Chery2004). Shortening in the basement occurs dominantly by faulting and folding. Mid-crustal rocks are exhumed or extruded at the surface as a result of thrusting or mid-crustal flow (Sarkarinejad, Godin & Faghih, Reference Sarkarinejad, Godin and Faghih2009).

Figure 1. Shuttle Radar Topography Mission (SRTM) image depicting topographic relief of the structural domains of the Zagros orogen. Abbreviations: UDMB – Urumieh–Dokhtar Magmatic Belt; SSMB – Sanandaj–Sirjan Metamorphic Belt; ZHFTB – Zagros Hinterland Fold-and-Thrust Belt; ZSZ – Zagros Suture Zone; ZTS – Zagros Thrust System; ZFTB – Zagros Fold-and-Thrust Belt; ZFFB – Zagros Foreland Folded Belt.
The Sanandaj–Sirjan HP–LT metamorphic belt is one of the major tectonic units of the Zagros orogen, which extends 1500 km along strike from the Bitlis area in Turkey to the western end of Makran and is 100 km wide (Sengör et al. Reference Sengör, Altiner, Cin, Custaomer, Hsu, Audley-Charles and Hallam1988; McCall & Kidd, Reference McCall, Kidd and Leggett1981; Mohajjel, Fergusson & Sahandi, Reference Mohajjel, Fergusson and Sahandi2003; Sarkarinejad, Reference Sarkarinejad2007). The Sanandaj–Sirjan HP–LT metamorphic belt is a coherent assemblage of tectonometamorphic units belonging to the upper Iranian plate (Mouthereau et al. Reference Mouthereau, Lacombe, Tensi, Bellahsen, Kargar, Amrouch, Lacombe, Lavé, Roure and Vergés2007). This belt is part of a thrust system that has transported numerous slices of variously metamorphosed stratigraphic units from the northeast to southwest (Sarkarinejad & Azizi, Reference Sarkarinejad and Azizi2008).
The study area is a structural basement window into the metamorphic complex in the Sanandaj–Sirjan HP–LT metamorphic belt (Fig. 1). It is located in the Sirjan, 25 km south of Sirjan city in the southeastern part of Iran. This basement window is situated between two ophiolite zones – Khoy-Neyriz and Naien-Baft (Ghasemi & Talbot, Reference Ghasemi and Talbot2006) – and formed in the Zagros hinterland following collision of the Afro-Arabian continent and the Iranian microcontinent. The most predominant rocks in the study area consist of phyllite, micaschists, greenschists, quartzites, marble and crystalline dolomitic limestone (Fig. 2). In addition, sheared quartzo-feldspathic gneisses are exposed in the study area. The deformation and kinematic history recorded in the metamorphosed and deformed rocks of the Sirjan area is related to an inclined transpressional tectonic regime (Sarkarinejad, Partabian & Faghih, Reference Sarkarinejad, Partabian and Faghih2013).

Figure 2. Geological map of the study area; spatial distribution of quartz c-axis samples is shown on the inset map through the transect line and detailed structural map of the study area showing the location of samples (filled circles) collected for strain symmetry, deformation temperature, vorticity and quartz petrofabric analyses.
3. Sirjan gneissic shear zones
The Sirjan basement window is a NNE-trending exposure of foliated gneissic rocks that are up to several hundred metres thick and located above the Sirjan thrust sheet associated with the Zagros thrust system (Sarkarinejad & Azizi, Reference Sarkarinejad and Azizi2008). Metamorphic grade decreases from top to bottom so that the Sirjan thrust separates the gneissic rocks in the hanging wall from lower-grade metamorphic rocks in the footwall (Fig. 3a). The footwall block is mainly composed of metamorphic rocks such as greenschist, calc-schist, slate, phyllite, graphite schist and quartzite (Fig. 2). Marble can also be traced along contacts with other rocks and may be produced by thermal metamorphism. Footwall rocks have pervasive S/C fabrics, asymmetric boudins and folds that can be used to determine sense of shear (Fig. 3b).

Figure 3. (a) View of the Sirjan thrust sheet which separates gneissic rocks in the hanging wall from the low-grade metamorphic rocks of the footwall. (b) Asymmetric shearband boudin train of a quartz vein in the schist host rock. (c) Quartzo-feldspathic mylonite with asymmetric tails of K-feldspar porphyroclasts and S/C fabrics indicates top-to-the-SW sense of shear.
Strongly sheared gneissic rocks in the hanging wall display fabrics ranging from proto- to-ultra mylonite. The main mineral assemblage is quartz + feldspar + plagioclase + biotite + muscovite + amphibole. Characteristic metamorphic minerals include garnet, tourmaline, zircon and apatite. Penetrative foliation and lineation were formed by alignment of mica flakes, stretched quartz and feldspar in the gneissic rocks. K-feldspar porphyroclasts are suspended in a fine-grained matrix of the aligned recrystallized quartz. Samples of an augen gneiss/sheared mylonite contain lenticular/sub-rounded clasts of δ-type and σ-type with asymmetric tails on K-feldspar porphyroclasts, in which the elongated feldspar grains define the S-foliation, whereas in the porphyroclast tails, mica, amphibole and quartz form a C-foliation (Fig. 3c). In quartz-rich samples, mylonitic foliation is defined by shape-preferred orientation of elongate quartz ribbons (Fig. 4a). Small and sporadic leucogranite plutons intruded the middle part of the gneissic body. Fabrics in the small plutons have the same characteristics as in the country rocks, but their intensity is weaker.

Figure 4. Photomicrographs of quartz fabrics. All sections cut perpendicular to foliation and parallel to stretching lineation (crossed polarized light). (a) Oblique grain shape in the dynamically recrystallized quartz grains. SA (black dashed line) denote the main foliation and SB (white dashed line) the oblique foliation. (b) Ribbon quartz; the slightly sutured shape of the high-angle grain boundaries suggest that sub-grain rotation (SGR) was active. (c) Quartz exhibiting bulging (BLG) recrystallization at quartz grain boundaries indicating deformation temperatures of 280–400°C overprinting a higher temperature fabric. (d) Mylonite with domino-like structure of antithetic shear along micro-faults on the K-feldspar porphyroclasts. Grain-boundary migration recrystallization of quartz textures in matrix indicating deformation temperatures of 500–650°C.
4. Quartz microstructures
All microstructural and crystal fabric data are reported from oriented samples of quartz-rich gneisses. The samples were collected along a transect across the hanging wall to the Sirjan thrust. The fabric measurements were carried out on thin-sections cut perpendicular to foliation and parallel to stretching lineation. Observations on oriented thin-sections reveal that porphyroclasts in the mylonites are dominated by rigid and rotated K-feldspar and deformed biotite, while the matrix is made of recrystallized quartz, feldspar and biotite. Fine-grained quartz is deformed into tails that extend on both sides of the alkali-feldspar porphyroclasts, parallel to the mylonitic fabrics. These are σ-type and δ-type porphyroclasts (Passchier & Simpson, Reference Passchier and Simpson1986). S/C fabrics also can be observed on the mesoscopic and microscopic scales. These structures are used as shear sense indicators. In the quartz-rich samples, elongate dynamically recrystallized quartz ribbons show a preferred alignment (SB) oblique to the macroscopic foliation (Fig. 4a). In all thin-sections the sense of obliquity indicates a top to- the-SW sense of shear.
Microstructures in the quartz grains (Fig. 4b, c) suggest development of grain-boundary migration (GBM) and sub-grain rotation (SGR) with minor microstructural evidence for bulging grain boundaries (BLG; Fig. 4c, d), which indicate dynamic recrystallization under Regime 2–3 conditions as defined by Hirth & Tullis (Reference Hirth and Tullis1992). Quartz crystallographic preferred orientation (CPO) is commonly observed in rocks that are dynamically recrystallized (Schmid & Casey, Reference Schmid, Casey, Hobbs and Heard1986). In general, the presence of a CPO is interpreted as evidence for significant deformation in the field of dislocation glide and creep (Vernooij, Brok & Kunze, Reference Vernooij, Brok and Kunze2006).
Quartz c-axis fabrics were measured on recrystallized quartz grains using an optical microscope and Leitz 5-axis universal stage, with an average of 300 grains being measured in each oriented sample. The universal stage data for c-axis orientations were plotted with respect to the mesoscopic foliation on an equal-area, lower hemisphere stereographic projection, and contoured using SpheriState 3.2 software. The data are summarized in Figure 5. From the density distribution of quartz c-axes, the fabrics may be interpreted as transitional Type 1 to Type 2 (Lister, Reference Lister1977) cross-girdle c-axis fabrics indicating approximate plane strain deformation (Law, Reference Law, Knipe and Rutter1990). Fabric skeletons were traced by connecting the crests and ridges of each fabric diagram (Fig. 6; Lister & Williams, Reference Lister and Williams1979; Lister & Hobbs, Reference Lister and Hobbs1980). Skeletal analysis (Lister & Williams, Reference Lister and Williams1979) of the contoured fabrics indicates an unequal inclination of the peripheral legs with respect to the central girdle segment (internal asymmetry) and an obliquity of the central girdle segment with respect to the foliation trace (external asymmetry). The sense of obliquity in all cases indicates a top-to-the-SW sense of shear (Fig. 6). Almost all c-axis fabrics exhibit monoclinic peripheral point-maxima asymmetry with respect to the main foliation, which is consistent with the c-axis pattern commonly reported for non-coaxial deformation (Wang et al. Reference Wang, Zhang, Fan and Peng2005). The obliquity of the central girdle segment (Ψ) varies between 71° and 82°.

Figure 5. Optically measured quartz c-axis fabrics of selected quartz-rich samples: equal-area, lower hemisphere stereographic projections; foliation is orientated left–right and vertical; lineation is horizontal; contour intervals: 2, 4, 6 and 8 times uniform distribution. N – number of grains measured in each sample.

Figure 6. Quartz c-axis fabric skeletons of individual samples from the study area. The observed fabric asymmetry indicates a significant component of non-coaxial, top-to-the-SW or sinistral sense of shear. Sample location details given in Figure. 2.
External and internal fabric asymmetry may also be expressed by the relative magnitudes of the parameters C1 and C2 (external symmetry) and ω1 and ω2 (internal asymmetry) within individual samples (Platt & Behrmann, Reference Platt and Behrmann1986; Law, Reference Law1987, Reference Law, Knipe and Rutter1990; Law et al. Reference Law, Stahr, Francsis, Ashley, Grasemann and Ahmad2013). In our study samples, C1 is smaller than C2 indicating a top-to-the-SW sense of shear and ω2 is consistently greater than ω1, also consistent with non-coaxial deformation (Fig. 6; Table 1).
Table 1. Details of quartz c-axis fabrics, strain and vorticity analysis for quartz-rich samples from the study area. Sample location details given in Figure 2

5. Shear sense indicators
Oriented thin-sections and hand samples were used to determine the spatial distribution of shear sense in deformed rocks from the study area. Thin-sections were cut parallel to lineation and perpendicular to foliation (XZ plane). Mica fish (Simpson & Schmid, Reference Simpson and Schmid1983; Lister & Snoke, Reference Lister and Snoke1984; Passchier & Trouw, Reference Passchier and Trouw2005) (Fig. 7a), δ- and σ-type asymmetric tails on porphyroclasts (Hanmer & Passchier, Reference Hanmer and Passchier1991; Passchier & Trouw, Reference Passchier and Trouw2005; Fig. 7b, c), S/C shear plane (Figs 3c, 7d) and oblique quartz grain shape foliation (SB) in the Sirjan gneissic rocks (Fig. 4a) indicate a top-to-the-SW shear sense. The presence of cross-girdle quartz c-axis fabrics (Law, Reference Law1987) and their point maxima (Fig. 5) that are asymmetric with respect to the foliation and lineation also suggest a top-to-the-SW sense of shear.

Figure 7. Photomicrographs of kinematic indicators from the Sirjan thrust sheet. All photomicrographs are perpendicular to the foliation and parallel to stretching lineation, which display a sinistral sense of shear. (a) Ultramylonite with mica fish indicating top-to-the-W sense of shear; crossed polarized light. (b) Photomicrograph of mylonite with δ-type alkali-feldspar porphyroclasts and recrystallization of the quartz and feldspar by bulging in the matrix, its asymmetry trail indicating top-to-the-W shear sense. (c) Photomicrograph of a σ-type K-feldspar porphyroclast with muscovite wings. (d) Photograph of S/C fabric, with S inclined to the right and C subhorizontal, which is well developed and indicates a sinistral sense of shear.
On the mesoscopic scale, shear band boudins (Goscombe & Passchier, Reference Goscombe and Passchier2003; Goscombe, Passchier, & Hand, Reference Goscombe, Passchier and Hand2004; Pamplona & Rodrigues, Reference Pamplona and Rodrigues2011) in quartzite layers (Fig. 3b) and rotated porphyroclast and asymmetric folds (Hanmer & Passchier, Reference Hanmer and Passchier1991) confirm the top-to-the-SW sense of shear (Fig. 3c). All macroscopic and microscopic shear criteria support a non-coaxial flow regime.
6. Deformation thermometry
Three analytical methods were used to assess deformation temperatures recorded in the hanging wall of the Sirjan thrust sheet: (1) the stability fields of metamorphic mineral assemblages present within quartz-rich mylonite (cf. Jessell, Reference Jessell1987; Hirth & Tullis, Reference Hirth and Tullis1992; Fitz Gerald & Stünitz, Reference Fitz Gerald and Stünitz1993; Lloyd & Freeman, Reference Lloyd and Freeman1994; Hirth, Teyssier & Dunlap, Reference Hirth, Teyssier and Dunlap2001; Stipp et al. Reference Stipp, Stunitz, Heilbronner and Schmid2002a , Reference Stipp, Stunitz, Heilbronner and Schmid b ), (2) the opening angle in the quartz c-axis lattice preferred orientations (Kruhl, Reference Kruhl1998; Law, Searle & Simpson, Reference Law, Searle and Simpson2004; Law, Reference Law2014), and (3) quartz slip systems inferred from quartz lattice preferred orientations (Mainprice et al. Reference Mainprice, Bouchez, Blumenfeld and Tubia1986; Tullis & Yund, Reference Tullis, Yund, Evans and Wong1992).
Quartz grains exhibit undulose extinction, deformation bands, weak shape-preferred orientation, locally strong crystal-preferred orientation, oblique foliation and locally developed core-and-mantle structures, indicating deformation temperatures of 400–600°C (Stipp et al. Reference Stipp, Stunitz, Heilbronner and Schmid2002a ). Deformation temperature estimates can be obtained using quartz deformation microstructures preserved under different recrystallization conditions (Fig. 8a). Low temperature deformation (280–400°C) is indicated by bulging microstructures (BLG), intermediate temperatures (400–500°C) are suggested by sub-grain rotation recrystallization microstructures (SGR) and high temperatures (> 500°C) can be inferred from grain-boundary migration recrystallization microstructures (GBM) (Stipp et al. Reference Stipp, Stunitz, Heilbronner and Schmid2002a ,Reference Stipp, Stünitz, Heilbronner, Schmid, De Meer, Drury, De Bresser and Pennock b ). At temperatures > 650°C quartz exhibits chessboard extinction (Lister & Dornsiepen, Reference Lister and Dornsiepen1982).

Figure 8. (a) Simplified stereonets showing the dependence of quartz LPOs and inferred slip systems on increasing temperature during non-coaxial deformation and plane strain (see text). Quartz c-axes are shown in dark grey and <a> axes in light grey. Modified from Passchier & Trouw (Reference Passchier and Trouw2005). (b) Relationship between c-axis opening angle to temperature. Grey line is the best-fit line with ± 50°C error. X, Y and Z strain axes are shown. Boxes 1–15 from Kruhl (Reference Kruhl1998); boxes 16–18 indicate data from Law et al. (Reference Law, Morgan, Casey, Sylvester and Nyman1992), Nyman, Law & Morgan (Reference Nyman, Law and Morgan1995) and Okudaira et al. (Reference Okudaira, Takeshita, Hara and Ando1995), respectively; boxes 19 and 20 from Langille et al. (Reference Langille, Jessup, Cottle and Newell2010). Data from this study are shown. Modified from Law, Searle & Simpson (Reference Law, Knipe and Dayan2004).
In the case of plane strain, the opening angle (OA) is defined as the angle between the two girdles of the c-axis cross-girdle lattice preferred orientations, measured in the plane perpendicular to foliation and parallel to lineation (Fig. 8a). A positive correlation exists between opening angle and deformation temperature from 250°C to 650°C, although hydrolytic weakening and changes in strain rate also play a role (Law, Reference Law, Law, Butler, Holdsworth, Krabbendam and Strachan2010). According to Kruhl (Reference Kruhl1998), modified by Law, Searle & Simpson (Reference Law, Searle and Simpson2004), the geothermometer correlates graphically with the opening angle of quartz c-axis fabrics with increasing deformation temperature, with an uncertainty of ± 50°C (Fig. 8b). In our study, quartz c-axis fabric opening angles display a systematic variation with respect to structural distance from the underlying Sirjan thrust. Our samples have opening angles ranging from 56° to 80° (Fig. 6). These data provide a confirmation of the relationship between increasing opening angle and deformation temperature between ~ 430° and 625°C (Fig. 8b).
Additionally, because quartz c-axis fabric pattern is also a function of temperature and strain rate, such fabrics indicate the activation of different slip systems during deformation. At low temperatures (lower-greenschist facies) and faster strain rates, basal <a> slips results in c-axis point maxima forming near the Z-axis of the finite strain ellipsoid (Bouchez, Reference Bouchez1977; Bouchez & Peĉher, Reference Bouchez and Pecher1981; Schmid & Casey, Reference Schmid, Casey, Hobbs and Heard1986). With increasing temperature (mid-greenschist facies), rhomb <a> slip is activated, forcing the c-axis maxima to migrate to intermediate positions between the Y- and Z-axes. Under amphibolite-facies conditions the prism <a> slip system begins to be activated, resulting in point maxima near the Y-axis (Lister & Dornsiepen, Reference Lister and Dornsiepen1982; Mainprice et al. Reference Mainprice, Bouchez, Blumenfeld and Tubia1986; Schmid & Casey, Reference Schmid, Casey, Hobbs and Heard1986). Ultimately, at temperatures higher than 700°C, prism <c> slip is activated, with c-axes concentrating near the X-axis (Mainprice et al. Reference Mainprice, Bouchez, Blumenfeld and Tubia1986; Cavalcanti De Araújo et al. Reference Cavalcanti De Araújo, Alves Da Silva, Jardim De Sá, Holcombe and De Vasconcelos2003) (Fig. 8a). In this study, quartz fabric diagrams indicate a progressively increasing contribution of prism <a> slip, relative to basal <a> and rhomb <a> slip, with increasing distance from the underlying Sirjan thrust (Fig. 5). These thermometers yield information on deformation temperatures for the time during thrusting/exhumation at which ductile deformation, such as dislocation and dynamic recrystallization, stopped and crystallographic fabrics were locked in for individual samples (cf. Law et al. Reference Law, Stahr, Francsis, Ashley, Grasemann and Ahmad2013).
7. Kinematic vorticity analysis
Vorticity analysis enables estimation of the relative contributions of pure and simple shear components during ductile deformation. For plane strain deformation, components of pure shear and simple shear can be quantified in terms of the kinematic vorticity number Wk (Means, Reference Means1994) that ranges between 1.0 if deformation occurs under simple shear condition and 0 for pure shear. Sub-simple shear is the term used for flows between pure and simple shear (1>Wk>0) (Passchier & Trouw, Reference Passchier and Trouw2005). Equal contributions of pure and simple shear occur at Wk = 0.71 (Law, Searle & Simpson, Reference Law, Searle and Simpson2004). In natural systems the vorticity of flow may vary with both space and time. In such cases of non-steady-state deformation, flow may be more appropriately characterized by the mean kinematic vorticity number Wm, in which the vorticity of flow is integrated over space and time (Passchier, Reference Passchier1988). For steady-state deformation Wk (instantaneous deformation) = Wm (finite deformation; Passchier, Reference Passchier1988).
In the past two decades a number of vorticity gauges have been suggested for quantifying the degree of non-coaxiality of flow in deformed rocks (e.g. Passchier, Reference Passchier1987, Reference Passchier1988; Wallis, Reference Wallis1992, Reference Wallis1995; Wallis, Platt, & Knott, Reference Wallis, Platt and Knott1993; Simpson & De Paor, Reference Simpson, De Paor and Sengupta1997; Holcombe & Little, Reference Holcombe and Little2001; Law, Searle & Simpson, Reference Law, Searle and Simpson2004; Jessup, Law & Frassi, Reference Jessup, Law and Frassi2007; Gomez-Rivas et al. Reference Gomez-Rivas, Bons, Griera, Carreras, Druguet and Evans2007; Sullivan, Reference Sullivan2008). Recent vorticity studies indicate that differences in Wm from sample to sample can be detected with the use of the quartz c-axis fabric and strain ratio method (Wallis, Reference Wallis1992, Reference Wallis1995; Grasemann, Fritz & Vannay, Reference Grasemann, Fritz and Vannay1999; Law, Searle & Simpson, Reference Law, Searle and Simpson2004; Xypolias, Reference Xypolias2009).
Our samples from quartz-rich layers within the gneisses above the Sirjan thrust are appropriate for two methods of vorticity measurements: (1) the strain ratio / quartz c-axis fabric method (Rxz/β-method), and (2) the oblique recrystallized grain / quartz c-axis fabric method (δ/β-method). These two methods were employed on data collected from thin-sections cut parallel to lineation and perpendicular to foliation. Both methods assume a vorticity vector oriented perpendicular to the maximum and minimum principal axes of finite strain (i.e. it lies along the intermediate principal stretching rate axis during progressive flow) (Tikoff & Fossen, Reference Tikoff and Fossen1995) and the presence of a steady-state non-coaxial flow that leads to formation of monoclinic or orthorhombic symmetry (Lin, Jiang & Williams, Reference Lin, Jiang, Williams, Holdsworth, Strachan and Dewey1998; Passchier, Reference Passchier1998).
7.a. Method I: strain ratio / quartz c-axis fabric (Rxz/β-method)
In the study area quartz-rich samples are characterized by Type 1 crossed-girdle quartz c-axis fabrics which exhibit an asymmetry with respect to the trace of foliation in the XZ plane. The angle β between the perpendicular to the central girdle of the quartz c-axis fabric skeleton and main foliation is equal to the angle between the flow plane and principal plane of strain (Fig. 9a). The angle β is a function of Rxz (strain ratio) and is expressed by Xypolias (Reference Xypolias2009) as:
 $$\begin{equation*}
{\rm W}_{\rm m} = \cos \left[ {\tan ^{ - 1} \left( {\frac{{{\rm R}_{{\rm xz}} \tan ^2 \beta }}{{(1 + {\rm R}_{{\rm xz}} )\tan \beta }}} \right)} \right]
\end{equation*}$$
$$\begin{equation*}
{\rm W}_{\rm m} = \cos \left[ {\tan ^{ - 1} \left( {\frac{{{\rm R}_{{\rm xz}} \tan ^2 \beta }}{{(1 + {\rm R}_{{\rm xz}} )\tan \beta }}} \right)} \right]
\end{equation*}$$
Alternatively, estimates of Wm can be obtained graphically using the diagram shown in Figure 9b, which summarizes relationships between Rxz and β for various Wm values. Note that the Rxz/β-method is equivalent to the Rxz/θʹ-method (Tikoff & Fossen, Reference Tikoff and Fossen1995; Bailey & Eyster, Reference Bailey and Eyster2003), which uses the angle (θʹ) between the long axis of the finite strain ellipsoid and the shear zone boundary to estimate Wm.

Figure 9. (a) Fabric skeleton and angular relationships between quartz c-axis and external and internal fabric asymmetry. (b) Plot of β versus Rxz (principal normal strain ratio in the XZ plane) contoured for different Wk (Tikoff & Fossen Reference Tikoff and Fossen1995; Grasemann, Fritz & Vannay, Reference Grasemann, Fritz and Vannay1999). Length of error bars reflects degree of uncertainty in measuring β in each sample; stars indicate β value (Table 1) obtained from ‘best-fit’ skeleton. The majority of the measured ten samples indicate Wk between 0.51 and 0.89. (c) Alignment (SB) of elongate dynamically recrystallized quartz grains orientated oblique to macroscopic foliation (SA); δ angle defined as a maximum angle between grain long axes and foliation. Both diagrams (b) and (c) are drawn in the XZ plane and indicate a sinistral shear sense.
The finite strain ratio in the XZ plane (Rxz) was estimated using the Rf/Φ-method (Ramsay & Huber, Reference Ramsay and Huber1983; Lisle, Reference Lisle1985) on elliptical strain markers such as plastically deformed quartz grains in quartz-rich samples. For each thin-section, at least 80 deformed quartz grains were measured. Note that these Rxz values were calculated from the shape of plastically deformed elongate, slightly recrystallized quartz grains lying in the plane of the main foliation while analyses of shape data were performed using algebraic and geometric Rf/Φ methods (e.g. Xypolias, Chatzaras & Koukouvelas, Reference Xypolias, Chatzaras and Koukouvelas2007; Xypolias, Reference Xypolias2009; Samani, Reference Samani2013). Rf/Φ diagrams were constructed using the software of Chew (Reference Chew2003). Calculated strain ratios in the XZ plane range between 2.5 and 4.3 (Fig. 10; Table 1).

Figure 10. Estimation of Rxz finite strain parameters from the Rf/Φ method for the same collection of specimens.
The Wallis (Reference Wallis1995) method of vorticity analysis has been widely used in studies of natural shear zones (e.g. Xypolias & Doutsos, Reference Xypolias and Doutsos2000; Law, Searle & Simpson, Reference Law, Searle and Simpson2004; Sullivan, Reference Sullivan2008; Law, Reference Law, Law, Butler, Holdsworth, Krabbendam and Strachan2010; Sarkarinejad, Partabian & Faghih, Reference Sarkarinejad, Partabian and Faghih2013; Xypolias et al. Reference Xypolias, Spanos, Chatzaras, Kokkalas, Koukouvelas, Law, Butler, Holdsworth, Krabbendam and Strachan2010). The key assumption of this method is that the central girdle of quartz c-axis fabrics develops orthogonal to the flow/shear plane during general shearing. This assumption is strongly supported by both experimental (e.g. Bouchez & Duval, Reference Bouchez and Duval1982; Herwegh & Handy, Reference Herwegh and Handy1996; Herwegh, Handy & Heilbronner, Reference Herwegh, Handy and Heilbronner1997) and numerical simulation of quartz crystal fabric formation (e.g. Lister & Hobbs, Reference Lister and Hobbs1980; Etchecopar & Vasseur, Reference Etchecopar and Vasseur1987), as well as by observations in natural quartz mylonites (e.g. Burg, Reference Burg1986; Law, Reference Law, Knipe and Rutter1990; Sullivan & Law, Reference Sullivan and Law2007). Uncertainty in determination of the β angle is by far the largest source of error in Wm estimates obtained by this method (e.g. Grasemann, Fritz & Vannay, Reference Grasemann, Fritz and Vannay1999; Law et al. Reference Law, Mainprice, Casey, Lloyd, Knipe, Cook, Thigpen, Law, Butler, Holdsworth, Krabbendam and Strachan2010). Therefore, the method was applied to ten samples where the β angle could be determined with an uncertainty smaller than ± 3°. Error bars estimated by the maximum and minimum β-values for each sample are shown in the Rxz/β diagrams of Figure 9b. Note also that for the analysed samples, the error in Wm values arising as a consequence of the uncertainty in estimating strain ratio is always overlapped by the error in Wm produced by the uncertainty in assigning β values (Xypolias et al. Reference Xypolias, Spanos, Chatzaras, Kokkalas, Koukouvelas, Law, Butler, Holdsworth, Krabbendam and Strachan2010). Analysis of our samples yielded Wm values ranging from 0.51 to 0.89 (Table 1).
7.b. Method II: oblique grain shape/quartz c-axis fabric method (δ/β-method)
This method was originally proposed by Wallis (Reference Wallis1995) and is based on the assumption that newly formed recrystallized quartz grains within an oblique grain shape fabric (SB) initially grow with their long axes nearly parallel to the extensional instantaneous stretching axis (ISA1) of flow. The acute angle (η) is defined as the angle between the line of zero instantaneous rotation or flow apophysis (Ai) and instantaneous stretching axes (ISA; Passchier, Reference Passchier1988). For steady-state deformation, the orientation of the ISA1 is related to Wm by the following equation (Wallis, Reference Wallis1995):
 $$\begin{equation*}
{\rm W}_{\rm m} = \sin 2\eta = \sin = 2(\delta + \beta )
\end{equation*}$$
$$\begin{equation*}
{\rm W}_{\rm m} = \sin 2\eta = \sin = 2(\delta + \beta )
\end{equation*}$$
where β is the angle between foliation and the flow plane, which is inferred to be perpendicular to the central segment of the cross-girdle fabric, and the δ angle is inferred to be the maximum inclination angle between the long axis of elongate oblique dynamically recrystallized quartz grains (SB) and the main foliation (SA) (Fig. 9c).
This method has proved applicable to seven samples that are characterized by both an oblique grain shape (SB) and cross-girdle quartz c-axis fabrics. Within individual samples, determination of the δ angle was based on at least 90 orientation measurements of the long axes of oblique recrystallized grains with respect to the main foliation (SA). The angle δ was assigned to be the maximum angle from each continuous population of readings (Frassi et al. Reference Frassi, Carosi, Montomoli and Law2009; Xypolias et al. Reference Xypolias, Spanos, Chatzaras, Kokkalas, Koukouvelas, Law, Butler, Holdsworth, Krabbendam and Strachan2010). This analytical method yielded Wm estimates ranging from 0.6 to 0.84 (Table 1).
Wm estimates using the δ/β-method are not sensitive to small uncertainties in β-values. Although uncertainties in assigning δ have not been investigated so far, their effect on Wm estimates is not expected to be great (Xypolias, Reference Xypolias2010). Uncertainties in vorticity values estimated by applying this technique can be attributed to (1) heterogeneity of matrix material, (2) the presence of porphyroclasts, and (3) folding, which may deflect or influence the orientation of the quartz fabric (Langille et al. Reference Langille, Jessup, Cottle and Newell2010). To limit possible inaccuracies, measurements were made from quartz fabrics that were unaffected by these potential problems.
8. Discussion
8.a. Deformation temperatures and apparent thermal gradient within the mylonitic Sirjan thrust sheet
Quartz lattice preferred orientations and microstructures reflect deformation conditions and can be used for the estimation of deformation temperatures. The quartzo-feldspathic mylonites from the study area have opening angles ranging from 56° to 80°. Using the Kruhl (Reference Kruhl1998) thermometer these opening angles indicate deformation temperatures ranging from 430 to 625°C traced from the SE to NW along our sampling transect. The opening angles of the quartz fabric skeletons and inferred deformation temperatures are plotted against the structural distance above the Sirjan thrust in Figure 11. A linear regression line through these data indicates an apparent thermal field gradient of 253°C per km. A power law fit indicates a steeper apparent thermal gradient (~ 229°C per km) at less than 600 m above the Sirjan thrust, which decreases to 89°C per km at 600–900 m. The smooth upward increase in quartz c-axis opening angles and inferred deformation temperatures traced from the SE to NW, together with the steadily decreasing thermal field gradient (Fig. 11), suggest that shearing was pervasively distributed at the grain scale, rather than being concentrated on isolated individual shear surfaces (Jain & Manickavasagam, Reference Jain and Manickavasagam1993, Reference Jain and Manickavasagam1997; Hubbard, Reference Hubbard1996, Reference Hubbard1997) with shearing progressively decreasing in magnitude with distance above the Sirjan thrust.
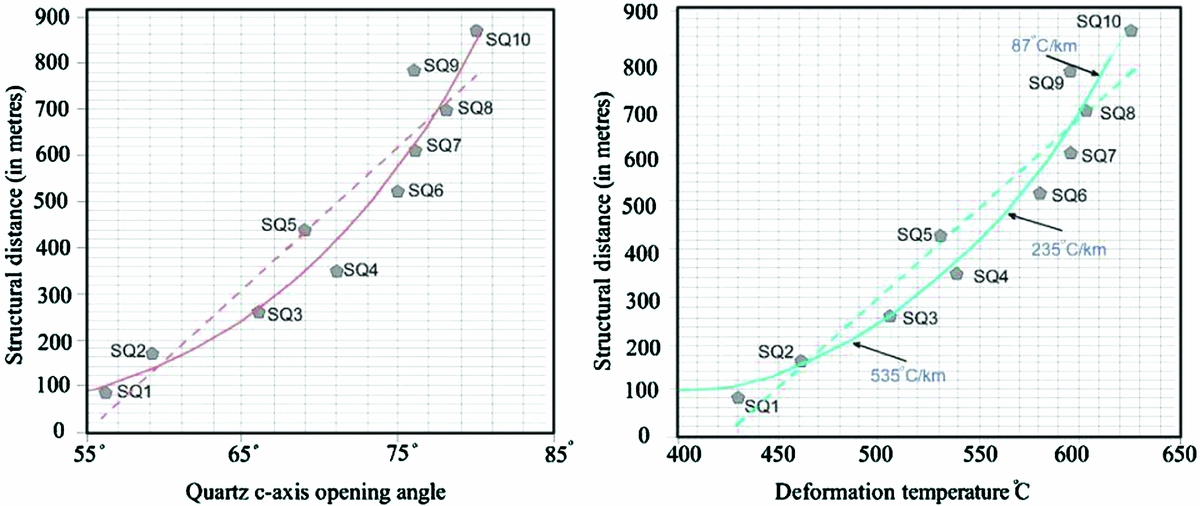
Figure 11. Quartz c-axis opening angles and inferred deformation temperatures plotted versus structural distance above the Sirjan thrust for samples collected along the NW–SE transect line shown in Figure 2. Deformation temperatures estimated by using the Kruhl (Reference Kruhl1998) fabric opening-angle thermometer have a nominal ± 50°C uncertainty. Power law best-fit curves and linear regression best-fit lines indicated by solid and dashed lines, respectively. Apparent thermal field gradients between samples also indicated. Sample location details given in Figure. 2.
The distribution of deformation temperatures based on quartz opening angles is in good agreement with deformation temperatures indicated by quartz recrystallization microstructures. Samples which exhibit dominantly rhomb <a> and prism <a> slip along with minor basal <a> slip based on the topology of the quartz c-axis fabrics (Fig. 5) display quartz microstructures suggesting sub-grain rotation recrystallization and opening angles indicating deformation temperatures of 400–500°C. In contrast, the limited evidence for grain-boundary bulging also recorded in these samples would indicate lower deformation temperatures (390–420°C), possibly reflecting later stages of deformation and exhumation (cf. Law et al. Reference Law, Stahr, Francsis, Ashley, Grasemann and Ahmad2013). Samples that exhibit dominantly prism <a> slip with minor rhomb <a> and basal <a> slip based on fabric topology (Fig. 5) have microstructures suggesting grain-boundary migration recrystallization and opening angles that indicate deformation temperatures of 500–630°C. Although, the skeletal topology of these quartz fabrics was interpreted as indicating a progressively increasing contribution of prism <a> slip, relative to basal <a> and rhomb <a> slip, with increasing distance above the Sirjan thrust fault, it may be suggested that the observed spatial variations in microstructures and fabric opening angles are a reflection of increasing hydrolytic weakening and decreasing strain rate traced away from the fault surface (Law, Reference Law2014). Unfortunately, no analytical criteria are available for assessing the influence of strain rate on fabric development and recrystallization regime that are independent of deformation temperature and hydrolytic weakening (Law et al. Reference Law, Stahr, Francsis, Ashley, Grasemann and Ahmad2013; Law, Reference Law2014). Assuming an average geothermal gradient of 30°C km−1, the Sirjan thrust was deformed at a maximum crustal depth of ~ 21 km based on our estimated deformation temperatures. Therefore, the shear zone located along the base of the Sirjan thrust sheet was initiated at mid-crustal levels in a contractional tectonic regime.
8.b. Kinematic vorticity profiles
The results of the vorticity analysis for each sample were plotted against structural distance from the thrust plane to examine the spatial variation of Wm values within the deformation zone as well as analytical consistency between the two methods (Fig. 12). In Figure 12 the length of each bar indicates the degree of uncertainty in the input data. It is clear that both methods record a consistent pattern of vorticity distribution along the sampling transect; however, there is a greater degree of uncertainty in estimating Wm values using Method I in comparison with Method II. Moreover, within individual samples, Method I generally indicates higher Wm values than those obtained by Method II.

Figure 12. Bar chart of vorticity numbers calculated by Method I (green bars; top) and Method II (red bars; bottom) versus structural distance from the Sirjan thrust; length of bars reflects the uncertainty in the calculation of Wm values. For further details see Table 1. Black rectangles on bars indicate Wm values for best-fit β-value (Fig. 6).
The majority of samples from the sampling transect, yield Wm estimates in the 0.51 and 0.89 range (31–60 % pure shear) using the Rxz/β-method (n = 10), and 0.6–0.84 (36–63 % pure shear) using the oblique quartz grain shape foliation method (n = 7). These results indicate a spatial variation in deformation during exhumation, in which simple shear dominated deformation near the thrust, and pure shear dominated deformation at greater distances above the thrust. Vorticity estimates derived from the Rxz/β-method record a higher component of simple shear than estimates derived from the δ/β-method (Fig. 12). Wallis (Reference Wallis1995) interpreted a similar mismatch between the Wm values obtained using these two methods to reflect a change of flow regime with time, and suggested that Method II may record the final increments of deformation.
Our observations indicate that the deformation history of rocks in the Sirjan thrust sheet is characterized by higher Wm values (~ 0.89) close to the thrust plane, which systematically decrease towards the middle parts of the overlying thrust sheet reaching a value of ~ 0.6 at a structural distance of 513 m above the thrust plane. Given the above discussion, comparison between Wm estimates obtained from methods I and II suggests that Method I may overestimate the simple shear component close to the thrust plane.
8.c. Mid-crustal exhumation/extrusion of the Sirjan thrust sheet
There is a wealth of field data showing key characteristics of crustal extrusion, including (Fig. 13): (1) high-grade units in the core of the thrust sheet, with inverted metamorphism across the lower margin of the fault zone; (2) evidence of partial melting, marked by younger ages in the centre of the sheet; (3) active deformation synchronous with crystallization of anatectic melts; (4) ductile fabrics progressively overprinted by semi-ductile and brittle structures; and (5) sub-simple shear strains, with a large component of up-dip stretching (cf. criteria described by Jones et al. Reference Jones, Holdsworth, Hand, Goscombe, Law, Searle and Godin2006).

Figure 13. Schematic diagram of the deformation pattern in the Sirjan thrust sheet. The occurrence of inversion metamorphism, partial melting, ductile fabrics progressively overprinted by semi-ductile and brittle structures and sub-simple shear strains with a large component of up-dip stretching reveals the extrusion mechanism for this thrust sheet. The length of the arrows indicates the value of pure shear in the deformation across the thrust sheet (for details see text).
In the study area the thrust sheet is exposed in a large asymmetric structural window and consists of gneissic basement rocks of the Arabian continent that have been extruded as a mylonitic thrust sheet. Small domes of leucogranite observed in the inner part of the thrust sheet are the result of anatectic melting. Thrusting along the eastern margin of the thrust sheet has resulted in emplacement of quartzo-feldspathic gneiss rock over relatively low-grade metamorphic rocks (Fig. 3a). Subhorizontal to shallowly plunging stretching lineations, moderately mylonitic foliations (Fig. 2) and semi-quantitative analysis of quartz fabrics (Fig. 5) from quartz-rich mylonite within the Sirjan thrust sheet demonstrate plane strain deformation under amphibolite- to granulite-facies conditions. Semi-brittle and ductile kinematic indicators including mylonitic gneiss with well-developed shear sense indicators such as domino-like structures with antithetic micro-faults transecting K-feldspar (Fig. 4d), rotated porphyroclasts, mica fish (Figs 3c, 7) and quartz c-axis patterns (Fig. 5) suggest a top-to-the-SW sense of shear.
Detailed fabric analysis of the preferred orientation of quartz c-axes indicates that this pervasive ductile deformation is characterized by heterogeneous general non-coaxial flow with components of simple and pure shear that formed in a sub-simple shear zone. The estimated kinematic vorticity (Wk) values indicate a 32–59 % pure shear component and a 41–68 % simple shear component. Moreover, quantitative vorticity analyses within quartzo-feldspathic gneisses of the Sirjan thrust sheet document a progressively increasing component of simple shear traced downwards towards the thrust plane (Fig. 12). The occurrence of strike-slip and oblique-slip deformation with a strong component of pure shear, confirms transpressional deformation (Sanderson & Marchini, Reference Sanderson and Marchini1984; Tikoff & Teyssier, Reference Tikoff and Teyssier1994). Several structural studies of deformation patterns imply a transpressional regime within the Sanandaj–Sirjan metamorphic belt (Mohajjel & Fergusson, Reference Mohajjel and Fergusson2000; Sarkarinejad, Faghih & Grasemann, Reference Sarkarinejad, Faghih and Grasemann2008; Sarkarinejad & Azizi, Reference Sarkarinejad and Azizi2008; Sarkarinejad, Godin & Faghih, Reference Sarkarinejad, Godin and Faghih2009), which show numerous shear zones accommodating deformation and exhumation of medium- to high-grade metamorphic rocks during oblique collision between the Afro-Arabian continent and the Iranian microcontinents.
Structural studies around the margins of the thrust sheet reveal a protracted kinematic history in which earlier ductile (crystal plastic) fabrics are generally overprinted by later brittle-ductile structures. The sequence of ductile and brittle structures now visible at the ground surface documents progressive exhumation. The western margin of the quartzo-feldspathic gneisses preserved in the thrust sheet is not as widely studied or well understood as the eastern margin. Further field work is clearly needed to provide additional constraints on the kinematics of deformation on the western margin. Available data indicate that the western margin of the thrust sheet is dominated by ductile deformation with little brittle deformation, while the eastern margin near to the thrust fault is characterized by ductile to brittle deformation.
8.d. Comparison with ductile shear zones from other orogens
The exhumation of the Sirjan gneissic thrust sheet and the associated pattern of spatial variations in deformation temperature and kinematics of flow are similar to what has been observed in: (1) the hanging wall to the Main Central Thrust in the Sutlej Valley and Shimla Klippe of the western Himalaya (Law et al. Reference Law, Stahr, Francsis, Ashley, Grasemann and Ahmad2013); (2) the footwall to the Moine thrust at the Stack of Glencoul in the Assynt region of NW Scotland (Law et al. Reference Law, Mainprice, Casey, Lloyd, Knipe, Cook, Thigpen, Law, Butler, Holdsworth, Krabbendam and Strachan2010; Law, Reference Law, Law, Butler, Holdsworth, Krabbendam and Strachan2010); (3) the footwall to the South Tibetan Detachment System in the Mount Everest Massif of Tibet/Nepal (Law, Searle & Simpson, Reference Law, Searle and Simpson2004; Jessup et al. Reference Jessup, Law, Searle, Hubbard, Law, Searle and Godin2006); (4) the Ama Drime Massif southern Tibet (Langille et al. Reference Langille, Jessup, Cottle and Newell2010); and (5) the Ochi nappe in the Alpine orogenic belt of Greece (Xypolias et al. Reference Xypolias, Spanos, Chatzaras, Kokkalas, Koukouvelas, Law, Butler, Holdsworth, Krabbendam and Strachan2010), which is characterized by a progressive reduction in simple shear traced from the base to the centre of the deformation zone (e.g. Xypolias et al. Reference Xypolias, Spanos, Chatzaras, Kokkalas, Koukouvelas, Law, Butler, Holdsworth, Krabbendam and Strachan2010).
The estimated deformation temperature indicated by quartz recrystallization microstructures and c-axis fabric opening angles in the study area is similar to the ranges of deformation temperatures estimated for Himalayan gneissic shear zones (e.g. Célérier et al. Reference Célérier, Harrison, Beyssac, Herman, Dunlap and Webb2009; Law et al. Reference Law, Mainprice, Casey, Lloyd, Knipe, Cook, Thigpen, Law, Butler, Holdsworth, Krabbendam and Strachan2010, Reference Law, Stahr, Francsis, Ashley, Grasemann and Ahmad2013; Langille et al. Reference Langille, Jessup, Cottle and Newell2010). For example, deformation temperatures indicated by fabric opening angles at 20–75 m above the Main Central Thrust are estimated at 535–550 and 610°C on the Sutlej and Eastern Sutlej transects, respectively. These temperatures steadily increase non-linearly up structural section, reaching 615°C at 1150 m above the Main Central Thrust on the Sutlej transect and 680°C at 2200 m above the Main Central Thrust on the Eastern Sutlej transect (Law et al. Reference Law, Stahr, Francsis, Ashley, Grasemann and Ahmad2013). Also, in the Kangmar gneiss dome of southern Tibet, deformation temperatures inferred from grain-scale microstructures and quartz lattice preferred orientations increase from 300–400°C to ≥ 600°C in the deepest exposed rocks (Wagner et al. Reference Wagner, Lee, Hacker and Seward2010).
The observed increase in Rxz strain ratios from 2.5 at the top of the Sirjan gneissic thrust sheet to 4.3 at the base is comparable with strain variations recorded within other ductile shear zones. For instance, low Rxz strain ratios of ~ 3 to 6.43 and 4.9 to 8.22 have been recorded at the uppermost structural levels of the Eva and Ochi thrust zones, respectively (Xypolias et al. Reference Xypolias, Spanos, Chatzaras, Kokkalas, Koukouvelas, Law, Butler, Holdsworth, Krabbendam and Strachan2010), and high strain ratios, possibly up to 20, have been recorded close to the Main Central Thrust in the Sutlej Valley of NW India (Grasemann, Fritz & Vannay, Reference Grasemann, Fritz and Vannay1999). Moreover, an overall downward increase in strain increase is at least locally documented for rocks in the hanging wall of the Main Central Thrust Zone by the intensity of the lattice preferred orientation of quartz c-axis fabrics (e.g. Bhattacharya & Weber, Reference Bhattacharya and Weber2004). The strain magnitude within the HP nappe of the Penninic Alps is also considered to increase downwards from a value of 2.0–6.0 at the top to an extremely high value (c. 30) near the base (Escher & Beaumont, Reference Escher and Beaumont1997; Xypolias & Kokkalas, Reference Xypolias, Kokkalas, Law, Searle and Godin2006).
9. Conclusion
A new study of quartz recrystallization microstructures and c-axis fabrics preserved in rocks from the hanging wall of the Sirjan thrust sheet suggests that these rocks record a top-to-the-SW sense of shear. Quantitative finite strain and vorticity analyses demonstrated that both the strain ratio and the kinematic vorticity number increase towards the underlying Sirjan thrust. The estimated mean kinematic vorticity number (Wm) based on quartz fabrics indicates deformation occurred under general shear conditions (Wm values of 0.6–0.89) with contemporaneous contributions of pure (32–59 %) and simple shear(41–68 %). Deformation temperatures (430 to 625 ± 50°C) inferred from fabric opening angles are in good agreement with likely ranges of deformation temperatures indicated by quartz recrystallization microstructures within individual samples. The observed spatial variation in strain and vorticity and deformation temperature within the study area is comparable with patterns recorded within other hinterlandward-located basement rocks of the world's orogenic belts.
Acknowledgements
The authors are grateful to Professor Mark Allen for his editorial authority. We would like to thank Professor Richard Law, for critical reading/editing of the manuscript, which helped to considerably improve the scientific content and presentation of the manuscript. We are grateful to Paris Xypolias, Chiara Frassi and Enrique Gomez-Rivas for their constructive comments, which greatly improved the earlier version of the manuscript. The Research Council of Shiraz University has supported this work, which is gratefully acknowledged.


