Introduction
The plerocercoid larvae (sparganum) of cestodes in the genus Spirometra are causative agent of human sparganosis that can manifest in local tissue damage, paralysis, blindness and even death (Anantaphruti et al., Reference Anantaphruti, Nawa and Vanvanitchai2011; Liu et al., Reference Liu, Li, Wang, Zhao and Zhu2015). Spargana of all Spirometra species infect a broad spectrum of amphibians and reptiles as their second intermediate host (Kuchta et al., Reference Kuchta, Scholz, Brabec, Wicht, Xiao, Ryan and Feng2015). The major aetiological agent of human sparganosis is Spirometra erinaceieuropaei which is mainly acquired by the consumption of undercooked or uncooked meat of frogs and snakes (Anantaphruti et al., Reference Anantaphruti, Nawa and Vanvanitchai2011). Although S. erinaceieuropaei was distributed globally, most sparganosis cases occur in eastern and southeastern Asian countries (Almeida et al., Reference Almeida, Coscarelli, Melo, Melo and Pinto2016; Tang et al., Reference Tang, Wong, Lai, Poon, Chan, Wu, Cheung, Poon, Tsang, Tang and Wu2017). China has the largest number of sparganosis cases in the world with more than 1000 cases have been reported, scattered over almost all administrative areas, so sparganosis still poses a serious threat to human health in China (Liu et al., Reference Liu, Li, Wang, Zhao and Zhu2015). Therefore, knowledge regarding the genetic characteristics and divergence pattern of the parasite is valuable for the control of sparganosis.
Several studies have used mitochondrial molecular markers (such as cox1 and cytb) to study genetic diversity of sparganum isolates from several geographical locations (Okamoto et al., Reference Okamoto, Iseto, Shibahara, Sato, Wandra, Craig and Ito2007; Jeon et al., Reference Jeon, Park, Lee, Choe, Kim, Sohn and Eom2016; Zhang et al., Reference Zhang, Wang, Cui, Jiang, Lin, Zhang, Liu and Wang2016, Reference Zhang, Duan, Shi, Jiang, Zeng, Wang and Cui2017). In comparison with mitochondrial genes, the simple sequence repeats (SSRs), or microsatellites have become the molecular marker of choice for genetic analysis owing to their high level of polymorphism (Bouck and Vision, Reference Bouck and Vision2007). In addition, the development of microsatellites from expressed sequence tag (EST) databases has been shown to be a feasible option for obtaining high-quality genetic markers (La Rosa et al., Reference La Rosa, Marucci, Rosenthal and Pozio2012). Using EST-SSRs, some remarkable advances have been made in population genetic analysis of human parasites in recent years (La Rosa et al., Reference La Rosa, Marucci, Rosenthal and Pozio2012; Gelanew et al., Reference Gelanew, Hailu, Schőnian, Lewis, Miles and Yeo2014; Garbarino et al., Reference Garbarino, Interisano, Chiatante, Marucci, Merli, Arrigoni, Cammi, Ricchi, Tonanzi, Tamba, La Rosa and Pozio2017). For the diphyllobothriid tapeworms, Bazsalovicsová et al. (Reference Bazsalovicsova, Koleničová, Králova-Hromadová, Minarik, Šoltys, Kuchta and Štefka2018) recently developed suitable microsatellite loci for Dibothriocephalus latus (the broad fish tapeworm). To date, however, none microsatellite markers have ever been developed for the spirometrid tapeworms. Therefore, in this study, we attempted to identify and characterize microsatellite loci sensitive enough to genotype S. erinaceieuropaei, and determine their usefulness as molecular markers for exploring population structure in S. erinaceieuropaei from southwestern China.
Materials and methods
Sparganum isolates
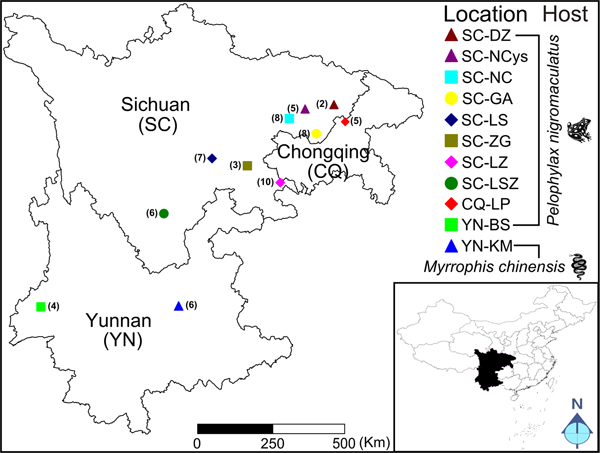
Total 64 sparganum isolates originating from 11 geographic regions of southwestern China were collected. The detailed information about isolates and hosts is shown in Fig. 1 and Supplementary Table S1. The spargana of S. erinaceieuropaei were collected from infected frogs (Pelophylax nigromaculatus) and snakes (Myrrophis chinensis) according to the methods described in Wei et al. (Reference Wei, Zhang, Cui, Liu, Jiang and Wang2015). Each tested sparganum was isolated from a single frog or snake, and then subjected to the analysis.

Fig. 1. Map of collection localities and host information for sparganum isolates. The number in the parenthesis indicates the sample size in each geographical location. Geographic regions in China are designated as follows: Dazhou, Sichuan (SC-DZ), Yingshan, Nanchong, Sichuan (SC-NCys), Nanchong, Sichuan (SC-NC), Guangan, Sichuan (SC-GA), Leshan, Sichuan (SC-LS), Zigong, Sichuan (SC-ZG), Luzhou, Sichuan (SC-LZ), Liangshanzhou, Sichuan (SC-LSZ), Liangping, Chongqing (CQ-LP), Baoshan, Yunnan (YN-BS) and Kunming, Yunnan (YN-KM).
Marker development
For each non-redundant SSR–EST, primer pairs that flanked the microsatellite and that spanned no greater than 300 bp were designed by using the Primer3 program (https://sourceforge.net/projects/primer3/). The screening of specific primers for S. erinaceieuropaei was performed in NCBI_Primer-BLAST (https://www.ncbi.nlm.nih.gov/tools/primer-blast/). Total genomic DNA was extracted from plerocercoid larvae using the EasyPure Genomic DNA Kit (Transgen, China) following the manufacturer's protocol. Polymerase chain reaction (PCR) amplifications of DNA were performed in 25 µL using a premixed 2× EasyTaq PCR Super Mix (Transgen, China). The amplification was carried out as follows: an initial denaturation at 94 °C for 5 min, then 94 °C for 30 s (denaturation); 50–60 °C for 30–60 s (annealing); 72 °C for 30–60 s (extension) for 32 cycles, followed by a final extension at 72 °C for 5 min. The PCR products used for genotyping were separated by electrophoresis on 8% non-denaturing polyacrylamide gels with a voltage of 100 V lasting 30 min and visualized via silver-staining. The samples which displayed more than a single band were considered to contain putative polymorphic sites and were further characterized.
Population genetic analysis
The population genetic parameters including allelic richness (A), observed heterozygosity (H o) and expected heterozygosity (H e) were calculated in GenePop v4.2 (Rousset, Reference Rousset2008). The pairwise F st values between populations were calculated in Arlequin v3.5 (Excoffier and Lischer, Reference Excoffier and Lischer2010) to estimate the levels of genetic differentiation among the populations and among the loci. In order to summarize the genetic relationships among the isolates and among the individuals, the principal coordinate analysis (PCA) was performed in GenAlEx v6.5 software (Smouse et al., Reference Smouse, Whitehead and Peakall2015). The structure of the sparganum populations was determined in STRUCTURE v2.3.4 (Hubisz et al., Reference Hubisz, Falush, Stephens and Pritchard2009) through K-means partitional clustering and the admixture model (Falush et al., Reference Falush, Stephens and Pritchard2003). Twenty independent runs were conducted for each of K = 1–11 using a length of burn-in of 105 and 106 replicates of Bayesian Monte-Carlo Markov Chain sampling. The average membership coefficients for the 20 simulation runs of a given K value were generated using CLUMPP v1.1.2 (Jakobsson and Rosenberg, Reference Jakobsson and Rosenberg2007) and a graphical presentation of the average membership coefficients for each isolate was generated in Microsoft Excel. The most appropriate number of K was calculated using STRUCTURE HARVESTER, web version (Earl and vonHoldt, Reference Earl and vonHoldt2012). Allelic data of EST–SSR were also used to confirm the genetic relationships among the tested genotypes by cluster analysis. The allelic data were transformed to binary mode using scores 1/0 for presence/absence of allele respectively, as described in Aggarwal et al. (Reference Aggarwal, Hendre, Varshney, Bhat, Krishnakumar and Singh2007). The clustering based on the neighbour-joining (NJ) method was performed in PAUP*4b10 (Swofford, Reference Swofford2003). In addition, in order to compare the phylogenetic patterns generated by microsatellites and mitochondrial markers, the clustering analysis of these sparganum samples was also performed using the mitochondrial cytochrome c oxidase subunit 1 (cox1) sequences. The cox1 sequences of isolates from CQ-LP, SC-NC, SC-NCys, SC-GA, SC-LZ, YN-BS and YN-KM were derived using the method described in Zhang et al. (Reference Zhang, Wang, Cui, Jiang, Lin, Zhang, Liu and Wang2016). A total of 18 newly added sequences representing samples from SC-DZ, SC-LS, SC-ZG and SC-LSZ were sequenced in this study using the method described in Zhang et al. (Reference Zhang, Wang, Cui, Jiang, Lin, Zhang, Liu and Wang2016). The phylogenetic analysis (NJ method) was also performed in PAUP*4b10.
Results
Development of functional EST–SSR markers
A total of 12 481 ESTs of the plerocercoid were obtained from the GenBank database. After a redundancy analysis to reduce overestimation, the cluster analysis revealed 267 SSR–ESTs as singletons and 2059 SSR–ESTs into 255 clusters. As a result, 522 non-redundant ESTs were identified that contained a total of 915 SSRs (Table 1). Analysis of SSR motifs in the non-redundant SSR–ESTs revealed 144 (27.59%) ESTs that contained more than one SSR. Of the total 915 SSRs, 427 (46.67%) were mononucleotide repeats (MNRs), 286 (31.26%) were di-nucleotide repeats (DNRs), 153 (16.72%) were tri-nucleotide repeats (TNRs), 41 (4.48%) were tetra-nucleotide repeats (TTNRs), 5 (0.55%) were penta-nucleotide repeats (PNRs) and 3 (0.33%) were hexa-nucleotide repeats (HNRs). Among the 286 DNRs, AG motif was the most common (46.15%) followed by the AC (40.21%) motif, whereas AT and CG motifs were uncommon (8.39 and 5.25%). Similarly, among the TNRs, the motif AGG was the most common (23.53%) followed by the motifs AAG (17.65%), AGC (13.73%) and CCG (13.07%) whereas the motif ACT was the least common (2.61%). However, the TTNRs, PNRs or HNRs were found in insignificant numbers (<5.36%).
Table 1. Frequency and distribution of different types of SSRs identified in the Spirometra ESTs (after considering sequence complementarities of the repeat motifs)

The 522 non-redundant SSR–ESTs were used for primer designing. In which, primers could be designed successfully for 246 ESTs. The remainders were inappropriate for primer designing due to short unique domains flanking the microsatellite core. Of the 246 potential SSR–ESTs, 104 were excluded for containing MNRs as the SSR core. Of the remaining 142 ESTs, only 81 were finally used for primer designing under the criteria of amplifying fragments shorter than 300 bp. Sixteen of these 81 SSR–ESTs varied among sparganum isolates employed in heteroduplex analysis, and the variation in only five of these derived from repeat variation. These five loci (C07, I03, M15, M20 and N11) were selected for use in the genetic diversity analysis (Table 2). TTNR was found in one locus (M15), the other four loci bore TNRs.
Table 2. Primer sets used to amplify microsatellites identified in sparganum isolates

T m, melting temperature. The subscript ‘n’ means a variable number of repeats.
a Accession number of the EST sequences from which the primers were designed.
Diversity analysis and genetic relationship
Total 64 natural sparganum isolates from 11 geographical locations of southwest China were genotyped at each of five selected loci. A total of 12 alleles were observed from 64 individuals. The loci of M20 and N11 identified three alleles, two alleles were observed under C07, I03 and M15 (average, 2.4 alleles per locus). Using the C07 only isolates from SC-LZ, SC-LSZ and SC-LS identified two alleles, others were fixed for a single allele (Table 3). With the I03, each geographical population identified only one allele with the exception of larvae from SC-LZ and SC-LSZ which identified two alleles. Under the loci of M15, M20 and N11, most of populations were observed more than one allele. However, specimens from YN-KM just identified one allele under all five loci. The overall observed heterozygosity (H o) and expected heterozygosity (H e) ranged from 0 to 0.9000 and 0 to 0.5737 respectively.
Table 3. General features of the genetic variability of sparganum isolates tested

N, number of individuals analysed; A, number of alleles; H o, observed heterozygosity; H e, expected heterozygosity.
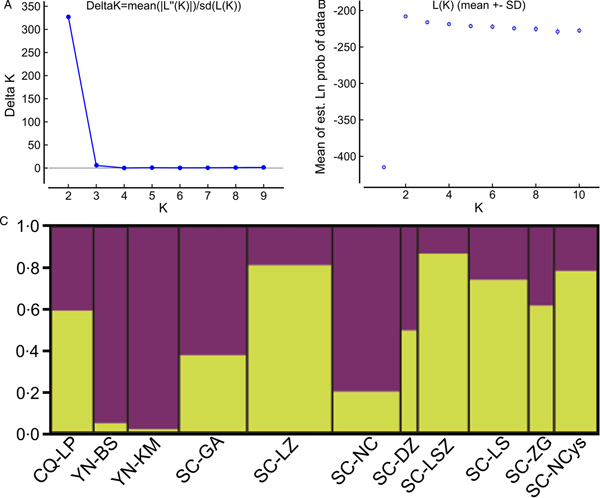
Analysing isolates from each geographical location as a distinct subpopulation enabled pairwise estimates of F st values which are used as a measure of genetic differentiation between populations (Supplementary Table S2). With the exception of F st values between YN-BS, YN-KM and several subpopulations from SC (such as SC-LZ, SC-LSZ, SC-LS and SC-NCys) above 0.25 (P < 0.05), most of the F st values were very low (below 0.15) and statistically insignificant (P > 0.05). Principal component analysis was performed on populations and then on individual larva to explore how variation was partitioned in the sample. Applying the PCA algorithm to the multi-locus F st values (Fig. 2A) separated YN-KM isolates from remaining isolates. Besides, the populations of YN-BS and SC-NC were distributed more separately. Analysing genetic distances among the 64 larvae by PCA showed two main clusters: cluster-1 and cluster-2 (Fig. 2B). Cluster-1 included individuals from SC-NCys (1 individual), SC-ZG (1), SC-LS (1), SC-DZ (1), SC-NC (6), SC-LZ (1), SC-GA (5), YN-KM (6), YN-BS (3) and CQ-LP (2). Cluster-2 contained samples from SC-NCys (4), SC-ZG (1), SC-LS (5), SC-LSZ (5), SC-DZ (1), SC-NC (2), SC-LZ (7), SC-GA (3) and CQ-LP (3). The Bayesian model-based clustering analysis implemented in STRUCTURE indicated that the sparganum isolates from southwest China could be organized derived from the admixture of two ancestral clusters (K = 2) based on the results of both the maximum ΔK and maximum L(K) (Fig. 3A and B). The STRUCTURE analysis did not divide the 11 populations according to their geographical origin. In contrast, each population showed a mixed membership to the inferred clusters. Isolates from YN-KM and a sample from YN-BS revealed one prominent genotype, whereas the remaining isolates indicated two main genotypes (Fig. 3C). In consistent with the STRUCTURE analysis, the NJ tree based on the allelic data also revealed two main clusters (Fig. 4). In addition, the two clusters revealed in the phylogenetic tree using the mitochondrial cox1 data too (Supplementary Fig. S1). The main patterns of trees generated by the two types of data (allelic data and cox1 data) were generally identical with the exception of two samples from Liangping of Chongqing of China (CQ-LP2 and CQ-LP3).

Fig. 2. (A) PCA describing the relationships of the 11 sparganum populations studied based on the F st values calculated using five microsatellite markers. (B) PCA describing the relationships of 64 individuals (based on the covariance values calculated using five microsatellite markers). The number in the parenthesis indicates the individual numbers included in each cluster. For the isolate code, see Fig. 1.

Fig. 3. Estimated population structure of sparganum isolates in China as inferred by STRUCTURE software on the basis of the data of five microsatellite markers obtained for 64 isolates from 11 geographical locations. (A) Plot of the mean posterior probability (Ln P(D)) values per clusters (K), based on 20 replicates per K, generated by the STRUCTURE software, and (B) delta-K analysis of Ln P(K). (C) STRUCTURE plots grouped by the Q-matrix (estimated membership coefficient for each sample) showing the distribution of genetic variation at K = 2. Each strain is represented by a vertical line, which is partitioned into the coloured segments that represent the parasite estimated membership fractions in K. The same colour indicates that the isolates belong to the same group. Different colours for the same isolate indicate the percentage of the genotype shared with each group. For the isolate code, see Fig. 1.

Fig. 4. The unrooted NJ tree based on five microsatellite data of 64 sparganum isolates. Numbers above branches represent the bootstrap values. Only bootstrap values above 60 are shown. For the isolate code, see Fig. 1.
Discussion
The larval forms (procercoid/plerocercoid) of Spirometra species can parasitize in human causing sparganosis. Although four valid species of spirometrid tapeworms have been described worldwide (Kuchta and Scholz, Reference Kuchta, Scholz, Caira and Jensen2017), only S. erinaceieuropaei affects humans in China leading to certain symptoms (Liu et al., Reference Liu, Li, Wang, Zhao and Zhu2015). It is still unknown whether there are other human infective species or genotypes of S. erinaceieuropaei in China. Here, we developed five EST-derived microsatellite markers, and performed a genetic variation analysis of 64 larvae of Spirometra collecting from 11 distinct geographical locations in China to determine the usefulness of these loci as genetic markers for examining population structure in Spirometra species.
EST databases are an attractive source of EST-based microsatellites for the population genetic analysis (Ellis and Burke, Reference Ellis and Burke2007; Bouck and Vision, Reference Bouck and Vision2007). However, the frequency and abundance of microsatellites can be highly variable depending on the dataset size (Varshney et al., Reference Varshney, Graner and Sorrells2005). The spirometrid tapeworms as neglected parasites for a long time, the corresponding dataset of ESTs is relatively small. Moreover, besides the S. erinaceieuropaei, there is almost no EST-dataset for other Spirometra species. Although SSRs from S. erinaceieuropaei were detected in a panel of 12 481 ESTs, many potential markers had been excluded because they did not comply with one or more of criteria described in La Rosa et al. (Reference La Rosa, Marucci, Rosenthal and Pozio2012). Finally, only five survived our criteria for inclusion.
The genetic diversity in S. erinaceieuropaei was first described by Okamoto et al. (Reference Okamoto, Iseto, Shibahara, Sato, Wandra, Craig and Ito2007), who detected the level of nucleotide variation in the partial sequence of mitochondrial cox1 gene of S. erinaceieuropaei collected from Asia, Australia and New Zealand, and concluded that the genetic difference within S. erinaceieuropaei was <2.6%. Furthermore, polymorphisms in spargana isolated in different intermediate hosts have been observed using different molecular markers (Wei et al., Reference Wei, Zhang, Cui, Liu, Jiang and Wang2015; Almeida et al., Reference Almeida, Coscarelli, Melo, Melo and Pinto2016; Jeon et al., Reference Jeon, Park, Lee, Choe, Kim, Sohn and Eom2016; Zhang et al., Reference Zhang, Wang, Cui, Jiang, Lin, Zhang, Liu and Wang2016). Recently, several complete mitochondrial genomes of Spirometra have been sequenced and mitogenomic comparative analysis have been made (Liu et al., Reference Liu, Li, Yuan, Zhou, Xiong, Lin, Zou and Zhu2012; Eom et al., Reference Eom, Park, Lee, Choe, Kim and Jeon2015; Zhang et al., Reference Zhang, Duan, Shi, Jiang, Zeng, Wang and Cui2017), which greatly improved the genetic diversity study of Spirometra species. As described above, in contrast to the analysis using single or multiple mitochondrial markers, microsatellites can be used for a more powerful exploration of genetic diversity (La Rosa et al., Reference La Rosa, Marucci, Rosenthal and Pozio2012, Reference La Rosa, Calero-Bernal, Pérez-Martín, Tonanzi, Galati, Serrano-Aguilera, Rosenthal and Pozio2018). Here, we performed a first analysis of sparganum population variability using five microsatellite markers. For these sparganum isolates, little variability was observed within each of geographical population. This was especially evident among isolates derived from YN-KM (only fixation of one allele). The pairwise F st was used to measure the population differentiation. According to Balloux and Lugon-Moulin (Reference Balloux and Lugon-Moulin2002), F st value within the range 0–0.05 indicates little genetic differentiation, 0.05–0.15 moderate differentiation, 0.15–0.25 great differentiation and >0.25 very great genetic differentiation. In this study most of the F st values were lower than 0.15 with the exception of F st values between YN isolates and several subpopulations from SC, which were higher than 0.25, indicating very great genetic differentiation, although the interpretation of F st must be qualified in sampling errors or very high genetic differentiation (Steinauer et al., Reference Steinauer, Blouin and Criscione2010; Zhang et al., Reference Zhang, Shi, Han, Xiong, Yi, Jiang, Wang, Shen, Cui and Wang2018). Both STRUCTURE analysis and clustering analysis supported that two genotypes existed among the Chinese sparganum populations, this is in agreement with the analysis based on mitochondrial molecular markers (Zhang et al., Reference Zhang, Wang, Cui, Jiang, Lin, Zhang, Liu and Wang2016). It will be valuable to use the same specimens analysed in previous study and investigate if microsatellites show the same pattern as mitochondrial genes. Therefore, the NJ analysis using the mitochondrial cox1 sequences of the same samples selected here was also performed. Interestingly, both of the phylogenetic trees generated by allelic data and cox1 data revealed two clusters. This may confirm the presence of these two lineages. Considering that the distribution of Spirometra species is cosmopolitan, the sampling amounts in this study are too small to reflect the true pattern of the genetic structure of spirometrid tapeworms. Therefore, we need for further investigation with deeper sampling (especially in the areas where there are cases of sparganosis) to elucidate the population structure.
In conclusion, the current study describes the effort to develop useful microsatellite markers for plerocercoid larvae of spirometrid tapeworms using available EST databases of S. erinaceieuropaei. Of all 12 481 ESTs screened, 522 non-redundant ESTs were identified that contained a total of 915 SSRs. Finally, five loci were selected for use in the next genetic diversity analysis. Using these loci, a total of 12 alleles were detected in 64 sparganum isolates collected from 11 geographical locations. Little variability was observed within each of geographical population, especially among isolates derived from YN-KM. Both STRUCTURE analysis and clustering analysis supported that two genotypes existed among the sparganum isolates from southwest China. To conclude, the five designed and validated microsatellite loci promise future application in population genetic studies on S. erinaceieuropaei. We look forward to the application of such markers for tracing and evaluating the genetic diversity of defined zoonotic outbreaks causing by spirometrid tapeworms.
Supplementary material
The supplementary material for this article can be found at https://doi.org/10.1017/S0031182019000222.
Author ORCIDs
Jing Cui, 0000-0001-8726-5498.
Acknowledgements
We thank Mr. YX Man, Y Xiang, KP Huang and DK Jiang, Ms. XQ Huang, J Liu, LD Yang and XX Dong for collecting valuable specimens used in this study.
Financial support
This work was supported by the National Natural Science Foundation of China (U1704189 and 81501768), Henan Province Science and Technology Key Project (182102310075), China Postdoctoral Science Foundation (2018T110740) and Backbone Teachers Development Program in Henan Province (2017GGJS011).
Conflict of interest
None of the authors has any financial or personal relationship with other people or organizations.
Ethical standards
The performance of this study was strictly according to the recommendations of the Guide for the Care and Use of Laboratory Animals of the Ministry of Health, China, and our protocol was approved by the Life Science Ethics Committee of Zhengzhou University (No. 2018-0119). All the frog and snake samples were collected from paddy fields after the permission of farm owners, with no specific permits being required by the authority for the collection of samples.