


Airborne laser scanning, also commonly known as lidar (light detection and ranging), is a remote-sensing technology widely recognized today as a powerful tool to explore archaeological sites (e.g., Opitz and Cowley Reference Opitz and Cowley2013; Schindling and Gibbes Reference Schindling and Gibbes2014). It is particularly efficient in forested or complex environmental contexts, where sites are inaccessible and poorly documented. Since 2009, various initiatives have demonstrated the potential of this tool for Mesoamerica and Central America (e.g., Canuto et al. Reference Canuto, Estrada-Belli, Garrison, Houston, Acuña, Kováč, Marken, Nondédéo, Auld-Thomas, Castanet, Chatelain, Chiriboga, Drápela, Lieskovský, Tokovinine, Velasquez, Fernández-Díaz and Shrestha2018; Chase et al. Reference Chase, Reese-Taylor, Fernandez-Diaz and Chase2016; Fisher et al. Reference Fisher, Fernández-Diaz, Cohen, Cruz, Gonzáles, Leisz, Pezzutti, Shrestha and Carter2016, Reference Fisher, Cohen, Fernández-Diaz and Leisz2017; Golden et al. Reference Golden, Murtha, Cook, Shaffer, Schroder, Hermitt, Firpi and Scherer2016; Hutson Reference Hutson2015; Prufer et al. Reference Prufer, Thompson and Kennett2015; Rosenswig et al. Reference Rosenswig, López-Torrijos and Antonelli2015; von Schwerin et al. Reference von Schwerin, Richards-Rissetto, Remondino, Spera, Auer, Billen, Loos, Stelson and Reindel2016). Although the area covered by each project varies considerably (Chase et al. [Reference Chase, Reese-Taylor, Fernandez-Diaz and Chase2016] record areas ranging from 9 to 1,057 km2 for flights conducted in Mesoamerica between 2009 and 2015), all archaeologists face similar, yet important, challenges when approaching this type of data. Such problems include the large volume of information generated (see McCoy Reference McCoy2017), the optimization of both the consistency and accuracy of desk-based interpretation of archaeological features, and the development of field strategies enabling the validation of desk-based approaches.
A variety of applications and methods-oriented publications have been presented over the past decade to approach these problems (e.g., Chase et al. Reference Chase, Reese-Taylor, Fernandez-Diaz and Chase2016; Evans et al. Reference Evans, Fletcher, Pottier, Chevance, Soutif, Tan, Im, Ea, Tin, Kim, Cromarty, De Greef, Hanus, Bâty, Kuszinger, Shimoda and Boornazian2013; Guyot et al. Reference Guyot, Hubert-Moy and Lorho2018; Henry et al. Reference Henry, Shields and Kidder2019; Opitz et al. Reference Opitz, Ryzewski, Cherry and Moloney2015; Quintus et al. Reference Quintus, Clark, Day and Schwert2015), and multiple approaches (or combinations of approaches) are adopted by specialists today. Regarding the desk-based analysis of lidar information, the common approach involves the interpretation of digital elevation models (DEMs) produced from the lidar raw data (initially point clouds) using a series of possible visualizations (e.g., Chase and Weishampel Reference Chase and Weishampel2016; Ebert et al. Reference Ebert, Hoggarth and Awe2016). Automated or semi-automated detection methods are also often used (e.g., Bennett et al. Reference Bennett, Cowley and De Laet2014; Casana Reference Casana2014; Ludemann Reference Ludemann2012; McCoy Reference McCoy2017; McCoy et al. Reference McCoy, Asner and Graves2011; Sevara et al. Reference Sevara, Pregesbauer, Doneus, Verhoeven and Trinks2016; Toumazet et al. Reference Toumazet, Vautier, Roussel and Dousteyssier2017; Verschoof and Lambers Reference Verschoof-van der Vaart and Lambers2019), and machine-learning-based approaches are currently being developed and tested (e.g., Guyot et al. Reference Guyot, Hubert-Moy and Lorho2018; Klassen et al. Reference Klassen, Weed and Evans2018). Regarding field observations and the ground observation process associated with desk-based analyses, several strategies have been adopted. Most of them, however, integrate both previous knowledge and post hoc sampling strategies (see example in Reese-Taylor et al. Reference Reese-Taylor, Hernández, Esquivel, Monteleone, Uriarte, Carr, Acuña, Fernandez-Diaz, Peuramaki-Brown and Dunning2016).
Several specialists have emphasized the importance of previous archaeological knowledge and expertise regarding both the region and the expected archaeological features for the confident interpretation of lidar imagery (see further discussion in Palmer Reference Palmer, Opitz and Cowley2013). A major concern when looking at lidar data, however, is the reliability of desk-based interpretation and the consistency of interoperator analysis during the interpretation of archaeological features. This is especially the case for manual feature extraction where individual decisions are part of the archaeological interpretation process (Banaszek et al. Reference Banaszek, Cowley and Middleton2018; Toumazet et al. Reference Toumazet, Vautier, Roussel and Dousteyssier2017). Manual feature extraction remains the most common method used to translate lidar-derived imagery into an archaeological map. While comparisons of desk-based observations (interpretation made using lidar-derived imagery) with ground observations (collection of data and interpretation made in the field) are frequent in specialized literature, not all of them address the question of interpersonal variability in manual feature extraction (e.g., Banaszek et al. Reference Banaszek, Cowley and Middleton2018; Quintus et al. Reference Quintus, Day and Smith2017; von Schwerin et al. Reference von Schwerin, Richards-Rissetto, Remondino, Spera, Auer, Billen, Loos, Stelson and Reindel2016). As emphasized by Quintus and colleagues (Reference Quintus, Day and Smith2017), many archaeologists have not been trained to interpret lidar data. This is complicated by the fact that the volume of data needing processing often necessitates the involvement of individuals beyond the principal investigator who has the relevant “previous knowledge.” External analysts (frequently students) are therefore often involved in the data extraction process, providing what Casana (Reference Casana2014) calls “brute force.” There is a clear disconnect between this technology and the future generations of archaeologists who will be increasingly exposed to it during their careers. The reliability of desk-based interpretations of lidar data can therefore be addressed from two perspectives. The first is a comparison of desk-based interpretations with field observations (a standard in the field). The second is a critical analysis of the community of mappers participating in desk-based interpretation and the procedures (typologies and indexes) that they employ.
In 2015, the Mésomobile project obtained 91 km2 of lidar data covering the region of Zacapu, in northern Michoacán, Mexico. Based on the extent of coverage and history of archaeological research in the region, manual feature extraction was the adopted approach. However, the potential team of analysts was limited to four researchers, as the local undergraduate and graduate students interested in participating had not been trained to work with these datasets. Two sets of issues were immediately apparent: (1) the methodological issue of rapidly and consistently mapping the large amount of information and (2) the lack of potential “analysts.”
In this article, we present and discuss our solution to these two issues: crowdsourced manual feature extraction, based on the participation of archaeology students using a web mapping platform. This experiment is comparable to the practices of nonspecialist-volunteered geographic information, as discussed by Elwood and colleagues (Elwood Reference Elwood2010; Elwood et al. Reference Elwood, Goodchild and Sui2012; Lambers et al. Reference Lambers, Verschoof-van der Vaart and Bourgeois2019; Yates Reference Yates2018), although restricted here to a predefined group of volunteers. More globally, it can be integrated into the broad and diverse possibilities of collaborative digital infrastructures currently developed to face big data management in archaeology (e.g., Bevan Reference Bevan2015; Gattiglia Reference Gattiglia2015; Jasło et al. Reference Jasło, Pilszyk and Szmyd2017). This approach enabled us to process a large amount of data in a relatively short period. It also allowed us to conduct data validation tests to compare desk-based manual feature extraction with the results of field observations. Here, we use two case studies: El Infiernillo and Las Milpillas. Both are prehispanic archaeological sites located in West Mexico and occupied circa AD 1250–1450. This article describes and discusses this experiment from the perspectives of both researchers and educators.
RESEARCH CONTEXT: ARCHAEOLOGY OF THE ZACAPU MALPAÍS
Between 2015 and 2018, the Mésomobile project investigated the long-term evolution of prehispanic human occupation in the north-central region of Michoacán, Mexico (Darras and Pereira Reference Darras and Pereira2014). The region experienced critical settlement pattern changes over the first millennium AD, including large-scale urbanization that substantially affected the natural landscape. Significant transformations occurred in the area known as the Zacapu “Malpaís”: a series of Pleistocene and Holocene lava flows unsuitable for farming but densely colonized by human groups as early as the Epiclassic period, circa AD 800 (Figure 1). Archaeological work by Migeon (Reference Migeon1990, Reference Migeon2016), Michelet (Reference Michelet and Darras1998, Reference Michelet, Litvak and Mirambell2000, Reference Michelet, Mastache, Cobean, Cook and Hirth2008), and Pereira and Forest (Reference Pereira and Forest2011; Forest Reference Forest, Brunet and Sauvin2012, Reference Forest2014, Reference Forest, Roskamp and Albiez-Wieck2016) has reconstructed the sociopolitical components of these aggregated settlements and established that their formation resulted from unprecedented urbanization in the region. Although initial settlement formation dates to the Epiclassic (Jadot Reference Jadot2016), the majority of urban features resulted from population aggregation occurring circa AD 1250. The material culture documented at these sites shows a clear affiliation with the Tarascan Empire, although in an early form considering that the imperial Tarascans ruled most of West Mexico at the time of the Spanish conquest, circa AD 1521 (Pollard Reference Pollard, Nichols and Pool2012).

FIGURE 1. Location of the lidar coverage in the Zacapu region, northern Michoacán, Mexico (Marion Forest).
Detailed work conducted between the 1980s and the 2010s at the sites of El Palacio (Mich. 23), Las Milpillas (Mich. 95), Malpaís Prieto (Mich. 31), and El Infiernillo (Mich. 38) provided us with an understanding of spatial and social settings at these early cities. Importantly, however, the broader urban system (intersite dynamics and the identification of hinterlands) needed further investigation. Traditional survey and mapping would have taken another decade of intensive fieldwork to complete.
Lidar data were collected by the National Center for Airborne Laser Mapping on March 29, 2015, employing a Teledyne Optech Titan MW multispectral lidar (Fernandez-Diaz et al. Reference Fernandez-Diaz, Carter, Glennie, Shrestha, Pan, Ekhtari, Singhania, Hauser and Sartori2016) mounted on a Piper Chieftain (PA-31-350) general aviation aircraft covering an overall area of 91.3 km2. Given the high terrain relief in the area, three different sensor and flying configurations were used: (a) 700 m above ground level (AGL) at 125 × 3 kHz, (b) 900 m AGL at 250 × 3 kHz, and (c) 1,100 m AGL at 100 × 3 kHz. All configurations employed the same scan angle, 30°, and scan frequency, 20 Hz. The processed point cloud yielded 1.1 billion returns from 0.945 billion laser pulses (roughly 1.17 returns per pulse), on average 10.4 pulses/m2 and 12.2 returns/m2, but with densities double the average within the main mapping target areas (25 km2). The point clouds were processed into surface elevation models (DEM and digital surface model) from which standard shaded relief images (azimuth 315°, elevation 45°, Z factor 1) were generated following National Center for Airborne Laser Mapping data processing procedures (Fernandez-Diaz et al. Reference Fernandez-Diaz, Carter, Shrestha and Glennie2014).
It was known that the prehispanic architecture in the Zacapu Malpaís was well preserved, and the lidar-derived DEM highlighted many known architectural feature types (e.g., pyramids, single-room buildings, terraces), as well as unknown landscape alterations including terrain management and agricultural features. Despite the enthusiasm of all project members, the mapping of the thousands of features visible on the DEM via manual extraction was an immense task, difficult to achieve with a small team (four researchers), no specific mapping protocols (each project has its own), and noneconomic stand-alone geographic information system (GIS) software that does not facilitate collective work, especially the integration of students. Thus, we developed a strategy to respond to these practical and methodological issues that was intended to be both economical and educational.
METHODS
We developed two main solutions. First, we constructed a web mapping tool that could bypass our software limitations and allow remote and independent collective labor. Second, we created a crowdsourcing protocol for digitizing archaeological features in this web mapping environment. The development and application of each of these solutions accelerated the extraction of archaeological features visible in the lidar derivatives and produced reasonably consistent interpretations. Equally important, the mapping tool and crowdsourcing protocol provided educational materials and supported active-learning training for archaeology students.
Setting Up the Web Mapping Tool
Because stand-alone versions of common GIS software only allow one person to work at a time and are often cost-prohibitive for students, a more accessible and intuitive tool was developed. Laurent Costa set up an online GIS system called web mapping or web GIS that allows collaborative and remote desk-based mapping (Haklay et al. Reference Haklay, Singleton and Parker2008). The web mapping system has many advantages: it is cost-effective (internal development using preexisting system architecture), highly customizable, easily deployable, and, if necessary, accessible for team members working remotely (several project members are based in Mexico). In addition, it is both intuitive and user-friendly and was developed using open-source codes. Web mapping platforms are particularly adapted to open-access presentation of archaeological data and, more generally, to heritage management projects (Dhonju et al. Reference Dhonju, Xiao, Shakya, Mills and Sarhosis2017; Knoth et al. Reference Knoth, Slimani, Appel and Pebesma2018; Yates Reference Yates2018). Consequently, web mapping solutions are used widely in public and government-funded initiatives but less often in research-focused development. The system used for the analysis of the Zacapu lidar data was initially developed for an earlier archaeological and historical project (“ArchéoFab project”; see Costa Reference Costa2016; Costa and Desachy Reference Costa and Desachy2018) and was intended to be a tool potentially adaptable to all historical sciences. It draws from the various technical and theoretical developments that have occurred in prior projects and in the field of web solutions for archaeology over the past decade (Bennett et al. Reference Bennett, Cowley and De Laet2014; Chaumet Reference Chaumet2008; Costa Reference Costa2016; Djindjian Reference Djindjian2008; Forest et al. Reference Forest, Costa and Pereira2018; Moscati Reference Moscati2008; von Schwerin et al. Reference von Schwerin, Richards-Rissetto, Remondino, Spera, Auer, Billen, Loos, Stelson and Reindel2016). Zacapu web mapping was conceived using DynMAP software (open-source code) and then stored securely by the Huma-Num research infrastructure server (Renneville and Pouyllau Reference Renneville and Pouyllau2013). The platform uses a MySQL database that enables the storage and management of spatial data (see user guide in Costa Reference Costa2015). The cartographic interface is generated with DynMAP via an HTML code (the application uses the plug-in Flash; Figure 2). The platform can be used in common web browsers, and it functions as a basic GIS with navigation, editing, selection, and measurement; multiple standard GIS input/export formats; and projection conversion systems (Figure 3). Both raster and vector data can be implemented and exported (e.g., .png, .jpeg, .tiff, .svg, .csv, .xls). The open-source components of this application make it potentially reproducible for any research community in social sciences. The Mésomobile web mapping platform is not publicly available, but many similar projects developed with DynMAP can be explored on the Huma-Num server (http://mapd.sig.huma-num.fr/dynmap/extensions/index.php?module=cartotheque2&cont=cartotheque).

FIGURE 2. Architecture of Mésomobile web mapping (Laurent Costa).

FIGURE 3. (a) Mésomobile web mapping interface and (b) closer view of the Las Milpillas site area presenting the five types of features mapped by volunteers using lidar-derived digital elevation model visualizations (displayed here: hillshade; Marion Forest).
We purposely opted for a simple-use ergonomic interface for individuals without GIS experience. Our initial priority was to develop a set of tools for manual feature extraction (i.e., editing toolbox). Costa implemented the web GIS with different raster files obtained from the lidar-derived DEM. Only two basic visualizations were selected for the projects discussed here: a standard hillshade model and a slope analysis model (Figure 4). While many more sophisticated visualizations of the lidar-derived DEM could have optimized desk-based interpretations (Bennett et al. Reference Bennett, Welham, Hill and Ford2012; Canuto et al. Reference Canuto, Estrada-Belli, Garrison, Houston, Acuña, Kováč, Marken, Nondédéo, Auld-Thomas, Castanet, Chatelain, Chiriboga, Drápela, Lieskovský, Tokovinine, Velasquez, Fernández-Díaz and Shrestha2018; Challis et al. Reference Challis, Forlin and Kincey2011; Chase and Weishampel Reference Chase and Weishampel2016; Kokalj and Hesse Reference Kokalj and Hesse2017; Magnoni et al. Reference Magnoni, Stanton, Barth, Fernandez-Diaz, Osorio León, Ruíz and Wheeler2016), consideration of the specific context of this experiment (i.e., nonspecialist crowdsourcing, users without backgrounds in GIS or remote sensing) suggested that basic visualizations that were easy to “read” and to understand were preferable. Another unfortunate limitation of this nonspecialist environment is the absence of detailed metadata (other than name of the volunteer, date of feature creation, and a free “note” entry) for the first case study. Finally, 100 m2 grid units were also added to the web mapping to organize volunteer work.
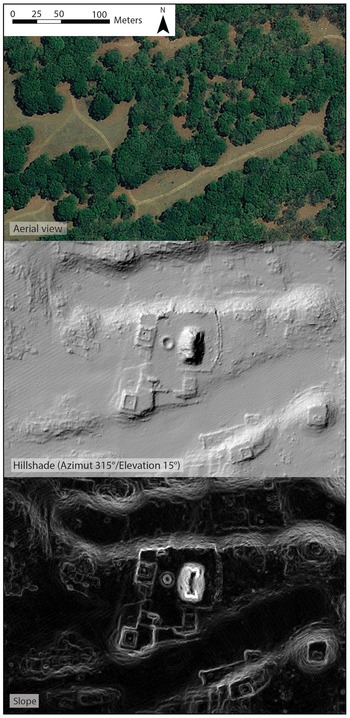
FIGURE 4. Comparison of the aerial view with two visualization techniques used to interpret the lidar-derived digital elevation model in the web mapping. Example area: main ceremonial precinct at Las Milpillas (Marion Forest).
Setting Up the “Crowdmapping”
Students and researchers who participated in the initiative received training in both how to use the web mapping platform and how to identify the main elements of the prehispanic architectural typology known for the Zacapu Malpaís. They learned the different types of features and how these forms appear in both hillshade and slope analysis visualizations. Results from previous excavations and/or surveys were not integrated into the web mapping.
Access to the web mapping program is subject to individual account creation, where each volunteer could access a series of shared base-map vector and raster files. We had administrator-level access, which enabled the addition and deletion of shapes and rasters, while volunteer students had editor-level access. Volunteers manually extracted features using a set of shapefiles pre-integrated. Three different shapefiles were used for El Infiernillo: “walls” (used for pyramids, mounds, and room buildings when recognizable), “linear features” (for terraces, embankment, and access features), and “others.” Five pre-interpretative shapefiles were employed for the analysis of Las Milpillas: “pyramidal mounds,” “room buildings,” “walls,” “linear features,” and “others.” These polyline shapefiles allowed collective mapping within a shared preliminary framework. While the system technically allows several mappers to work simultaneously on the same area and even the same feature (subject to internet connection speed and synchronization of the web platform), we opted for single-mapper feature interpretation. Unfortunately, this precludes any interoperator variability comparison, a test that would have undoubtedly provided important material for the analysis of this process (as conducted in Quintus et al. Reference Quintus, Day and Smith2017).
Once we established general protocols (e.g., formation of the tool, identification of archaeological feature characteristics, and creation of individual accounts), the participants started to work independently. After the initial training session, volunteers could continue mapping whenever and wherever they had an internet connection to access the platform. Mapping occurred over 47 days in October–November 2015 and over 81 days in April–June 2017 for the sites of El Infiernillo and Las Milpillas only (not the entire 91 km2). Figure 5 shows the result of the collaborative desk-based mapping for a small portion of the El Infiernillo site.

FIGURE 5. Collaborative web mapping of the built environment at El Infiernillo (sector of pyramid Y22; Marion Forest).
In 2016 and 2017, we were able to compare the volunteer desk-based interpretation of features with preexisting maps and survey data as well as new ground observations. We focus here on the validation of only one type of feature: single-room buildings. Such features account for more than 60% of the built environment across the four urban settlements in the Zacapu Malpaís (see Forest Reference Forest2014). Further, they are among the clearest features, both in the field and on lidar-derived visualizations. As such, they formed an excellent case to compare the results from previous work, web mapping, and ground observation results, although not always post hoc. Both study cases provide substantial material to discuss the advantages and issues of this approach to lidar “crowdmapping” and the engagement of a volunteer community.
TWO STUDY CASES FROM ZACAPU
Case 1: El Infiernillo (Mich. 38)
Archaeologists first recorded the site of El Infiernillo in 1983 and conducted a systematic survey there in 1994–1995. Compared with its contemporaneous neighbors, however, the site remains understudied. El Infiernillo is located on the western front of the Zacapu Malpaís, on a lava flow dating to 3200 ± 30 BP (Reyes-Guzmán et al. Reference Reyes-Guzmán, Siebe, Chevrel, Guilbaud, Salinas and Layer2018). Scholars have described the built environment at the site on several occasions (Forest Reference Forest2014; Michelet Reference Michelet and Darras1998, Reference Michelet, Mastache, Cobean, Cook and Hirth2008; Pereira and Forest Reference Pereira and Forest2010), and it is considered characteristic of Middle Postclassic urbanism in the region. Single-room houses and outdoor storage features form the main elements of the residential sphere at El Infiernillo, while pyramidal mounds, altars, and large collective buildings make up the civic-ceremonial components. The site also presents a very complex network of linear built features, interpreted by Michelet (Reference Michelet and Darras1998) as causeways facilitating circulation on the uneven terrain. Prior to the acquisition of lidar data for El Infiernillo, a systematic pedestrian survey was conducted in 1994 and 1995 that established the site boundaries and provided an initial count of pyramids (n = 22) and room buildings (n = 1,154; Michelet Reference Michelet and Darras1998). A 0.8 km2 section of the northern portion of the site was also intensively mapped (Forest Reference Forest2014).
The active participation of volunteers resulted in the creation of 3,311 features based on interpretations of the hillshade and slope visualizations (Table 1). Following the “crowdmapping,” we examined the results of manual feature extractions made by the volunteers (Figure 5), focusing specifically on room building features (n = 1,544). Three issues became apparent. The first was the digitizing of linear terrain management features in the shapefile dedicated to buildings. The second was the digitizing of one solid square feature (a room with four connected walls) using two or more line segments (and therefore counted as several features instead of one). Finally, there were a few instances where features were digitized twice, likely due to delays in internet uploading and map synchronization. While these issues had no impact on the cartographic representation of the results, they had a strong impact on the feature counts for the desk-based phase of the work. We made the decision to edit these specific cases, which resulted in a reduction of the final number of room buildings to 1,227 (79.5% of the preliminary count).
TABLE 1. Results of the Web Mapping Experiment for the Two Study Cases.

The next step was comparing the features identifiable in the lidar data with field observations, which are assumed in this study to be as systematic as can be and set the full coverage standard. Two sample areas were compared: the northern area mapped by Forest in 2010 (8 ha) and a post hoc 3 ha pedestrian survey conducted by Pereira, Forest, and Zimmer (Pereira et al. Reference Pereira, Michelet, Dorison, Faugère, Quezada, Lefebvre, Forest, Medina, Barrientos, Goudiaby, Barba, Blanca and Gillot2016; Zimmer Reference Zimmer2016) in the southern area. Table 2 presents the results of this comparison. In these two sample areas, analysis of the lidar data suggested the presence of 93 structures. Of these, 82 (88.1%) were confirmed by field observation (true positives), suggesting that desk-based extraction is an effective way to identify archaeological structures. The results of the pedestrian surveys, however, indicate that 37 structures (31.1% of the total count of verified room buildings) were missed using the lidar-derived DEM (false negatives), suggesting that a substantial number of features remained undetected during the desk-based interpretation (Figure 6). However, the overall efficiency of the desk-based analysis operated by the web mapping volunteers seems to be supported by the consistency of the total number of room building features identifiable in the lidar derivatives (n = 1,227) with the systematic count of this type of feature made at the site by Michelet and colleagues (n = 1,154). Because the field observations were not conducted post hoc, the number of false positives remains unknown for the northern area. However, the post hoc field observations made in the southern area concluded with zero false positives: the digitally mapped features are always confirmed in the field.

FIGURE 6. Comparison between desk-based and field observations for single-room building features in two sample areas, El Infiernillo: northern area (2010) and southern area (2016). The northern area features were digitally mapped after field observations and were not checked against the lidar data. Therefore, the number of false positives (features digitally identified but not documented in the field) remains unknown. The “desk-based mapping only” features presented here could be either true positives or false positives (Marion Forest).
TABLE 2. Comparison of Single-Room Building Counts at El Infiernillo between Desk-Based and Field Observations.

a The northern area features were digitally mapped after field observations and were not checked against the lidar data. Therefore, the number of false positives (features digitally identified but not documented in the field) remains unknown. The 11 features counted here could be either true positives or false positives.
Case 2: Las Milpillas (Mich. 95–96)
The settlement of Las Milpillas (Mich. 95–96) forms a sizable inhabited area located in the central portion of the Malpaís geologic complex. The site was first recorded in 1983 and excavated in 1984–1985 (Migeon Reference Migeon1990; Puaux Reference Puaux1989). Descriptions of the excavation and architecture have demonstrated that the primary occupation of the site was in the Middle Postclassic, circa AD 1250–1450, and that architectural features for both the domestic and civic-ceremonial spheres were similar to those observed at the nearby sites El Infiernillo and Malpaís Prieto. Michelet (Reference Michelet1984) created a 1:1,000 topographic map of Las Milpillas using an alidade. Forest (Reference Forest2014; Pereira and Forest Reference Pereira and Forest2011) digitized the unpublished map in a GIS in 2009 and systematically revised it in the field in 2010 with the addition of GPS references, architectural feature measurements, and the mapping of two extensions. This resulted in 0.47 km2 of coverage (central area of the site), including 17 pyramid mounds and 473 single-room buildings.
The second web mapping workshop began in April 2017. We maintained most of the 2015 protocol, making minor changes based on the first experiment's results. For example, we subdivided the three original pre-interpretative shapefiles (“walls,” “embankment/terrace,” “other”) into five different shapefiles: “Pyramid,” “Room building,” “Embankment/terrace,” “Wall,” and “Other.” The desk-based interpretation of pyramid mounds and room buildings had presented excellent reliability in the field, and they could be isolated from the start. The mapping group during this second crowdsourcing experiment was composed of eight persons (including six students), who manually extracted the features based on the same DEM visualizations—hillshade and slope (Table 1). The results of this crowdsourcing web mapping are compared with the first case study in Table 3. The average number of features identified and digitized by each volunteer remained relatively stable between the two experiments. After the crowdsourcing, one volunteer pursued the web mapping intensively and reached a higher rate of 133 features identified per day. The manual extraction issues already commented on in the previous case (discontinuous tracing, wrong shape tracing, double tracing) appeared in this second iteration, too, and errors were edited by the supervisors. The number of room buildings identifiable in the lidar data was reduced from an initial count of 957 to 921 (96% of the original extraction). This illustrates the improvements in consistency resulting from the creation of more specific shapefiles for this feature type. The total area mapped consisted of 1.23 km2 (exceeding the pre-lidar map by 0.76 km2 and including inhabited sectors west and south of the previously documented area).
TABLE 3. Results and Performance for Crowdsourced Web Mapping.

This desk-based data extraction was compared with the field observations made in 1984 (Faugère et al. Reference Faugère, Migeon and Puaux1984; Michelet Reference Michelet1984) and 2010 (Forest Reference Forest2010, Reference Forest2014; Pereira and Forest Reference Pereira and Forest2010). Due to the use of field observations obtained prior to the lidar data acquisition, it is impossible to quantify and discuss false positives, since these are only verifiable during post hoc ground-truthing. For the 0.47 km2 that were previously mapped, all other available indicators are presented in Table 4.
TABLE 4. Comparison of Single-Room Building Counts at Las Milpillas between Desk-Based and Field Observations.

a Features were digitally mapped after field observations and were not checked against the lidar data. Therefore, the number of false positives (features digitally identified but not documented in the field) remains unknown. The 38 features counted here can be either true positives or false positives.
The confirmation of desk-based mapped features by field observation reaches 89.1%. These results are strong enough that, if extrapolated to the entire site, they could provide new population estimates for Las Milpillas. There was, however, a large number of false negatives (34.0% of the verified count of room buildings), indicating a sizable proportion of residential structures that may be missed by desk-based interpretations (see Table 4 and Figure 7). Such false negative rates (consistent with observations made in the first study case) may result from the weakness of the lidar-derived visualizations used in this experiment but could also result from the ongoing degradation of the site since the 1980s. This is especially evident in the lower areas, where a broad modern dirt road and general erosion have altered the archaeological record.

FIGURE 7. Comparison between desk-based and field observations for single-room building features, Las Milpillas. Features were digitally mapped after the field observations and were not checked against the lidar data. Therefore, the number of false positives (features digitally identified but not documented in the field) remains unknown. The “desk-based mapping only” features presented here could be either true positives or false positives (Marion Forest).
Nevertheless, these results confirm the overall robustness of desk-based extraction conducted with web mapping. For the case of Las Milpillas, the consistency of the web mapping results with those of earlier surveys suggests that we can confidently integrate the results of the analysis of the lidar-derived DEM with that previous work. Integration of these results increases the number of known family residences from 473 to at least 1,000 and extends the area of the site from 0.47 km2 to 1.23 km2. Our understanding of this settlement has changed significantly with these results.
DISCUSSION
The acquisition of lidar data is an increasingly important way to document large archaeological landscapes that are difficult or impossible to assess through traditional pedestrian surveys. As this study demonstrates, the constraints and methodological issues related to this technology require specific tools to approach potential analyses. Although archaeologists often develop idiosyncratic solutions to such methodological issues based on the context in which they are working, we suggest that the protocols and solutions that we have developed here can be adapted to suit many situations and research contexts. Although we initiated the collective web mapping project for research development and to improve efficacy, we soon discovered the tremendous pedagogical potential of this initiative and focused on its progress and examination.
The two web mapping workshops have generated significant new archaeological documentation, and, from this perspective, we achieved most of our initial scientific and methodological goals. The acquisition and analysis of lidar-derived datasets have therefore had a substantial impact on the archaeology of the Zacapu area, contributing to a progressively higher-resolution understanding of settlement morphology, strategies of landscape modification used in prehispanic times, and population demographics.
The concordance between the archaeological features detected based on lidar DEM visualizations and field observations (over 80%) supports the integration of such results into future research. Further development of more sophisticated visualizations could, however, provide significant improvements regarding the rate of false negatives observed. Importantly, the participation of nonspecialist mappers does not seem to affect the process. The errors pertain more to the digitizing process than to the interpretation, the latter of which appears to be both easily and rapidly corrected, and are almost eradicated by the creation of pre-interpretative shapefiles for each feature type. Although the decision to increase the number of pre-integrated shapefiles from three to five enabled further interpretation from the mappers, it resulted in less than 4% of the small extraction errors in the shapefiles, thereby necessitating very little corrective post–web mapping work. Instead of several trained analysts working full-time on digitizing, a crowdsourcing process representing the limited labor investment of a group of volunteers and an expert analyst supervising the process can produce a strong dataset with substantial scientific potential.
While it is often impossible or impractical (due to limitations of time, money, or access) for an entire dataset produced in a desk-based environment to be verified in the field, sampling strategies have to be created. In our case, the comparison between desk-based and field observations was essentially determined by the preexisting datasets. Only one area at El Infiernillo can be considered as a “post hoc” ground verification as observed in typical lidar-based research workflows. Datasets from the 1980s, 1990s, and 2010s, although differing in their acquisition methodologies, constituted relevant sampling areas and comparative information. Unfortunately, they do not permit the quantification and critical analysis of false positives.
The results of this study demonstrate that improvement is possible. The development of a stronger metadata implementation system during web mapping could enable a finer analysis of the process, especially pertaining to potential issues related to interoperator variability and bias that cannot be systematically explored here. On the other hand, the volunteered initiative was an educational experience involving the use of standard visualizations without data manipulation; hillshade and slope analysis were the only lidar data renderings used. It is likely that more sophisticated raster rendering of the lidar data as well as processing algorithms and other automated techniques would optimize the desk-based crowdsourced interpretation and ameliorate the high rate of false negatives observed in our study. While the optimization of desk-based lidar data analysis is desirable, the ease of implementation was of concern in the context of introducing undergraduates to lidar data and a crowdsourcing initiative.
The second emphasis of this experiment was to observe how lidar data management could be used as an educational tool to train and familiarize future archaeologists with the technology. The pool of participants was composed of both nonspecialists and archaeology students with little or no experience in GIS and web mapping (84.6%). Approximately 53% had no information about lidar technology prior to the Mésomobile workshops. A brief anonymous survey conducted after web mapping collected interesting feedback about web mapping and the overall experience (Table 5). We asked the participants a series of questions related to their experience during the workshop, the introductory training, the web mapping exercise, and the learning outcomes. A large portion of the pool found the training elements to be well adapted to the exercise (presentation of the architecture typology: 100%; archaeological context, examples: 92.3%), but impressions of the training for the web mapping interface itself (framework and tools) were variable (7.69% of participants found it to be insufficient, 23.08% thought it sufficient, and 69.23% thought the training was well adapted to the exercise). Qualitative comments emphasized the fact that participants became more efficient at digitizing and identifying archaeological features with continuous practice using the tools and the lidar image. On the other hand, some participants noted that use of the tools themselves (navigation and editing tools) was not satisfying compared with stand-alone GIS software. Regarding learning outcomes and the overall experience, 84.62% of the pool noted that the lidar web mapping workshop was a “good” to “excellent” introduction to GIS solutions and to lidar technology. The same proportion of respondents expressed that this exercise was a significant learning experience for their education in archaeology.
TABLE 5. Results from the Exit Survey Conducted with Web Mapping Participants (n = 13).

In what began as a research-focused experiment, the web mapping of El Infiernillo and Las Milpillas became an accessible way to expose future generations to lidar technology and use. The first workshop in 2015 was a valuable initial experience in several ways (e.g., testing the web mapping tool for the first time as a collective method, introducing students to the tools, observing), but the replication of the exercise refined the research methods. Students were integrated as motivated trainees and served as the necessary “brute force.” This exercise could be replicated again in different research and educational contexts. Beyond the introduction to GIS and remote sensing, we believe that exposing students to further research frameworks like the volunteered geographic information is critical for providing them with skills to approach the new paradigms and datasets that are emerging in the social sciences. Big data and high technological skill acquisition already are and will increasingly be major aspects of archaeology in the coming years and decades, and the community of researchers and educators has to prepare new labor strategies and training protocols.
Acknowledgments
This work was conducted within the Mésomobile project directed by Véronique Darras and Grégory Pereira, researchers at the French National Center for Scientific Research (Unité Mixte de Recherche 8096, Archéologie des Amériques), and funded by the French National Agency for Research (ANR-14-CE31-0016). Fieldwork was supported by the Uacúsecha project directed by Grégory Pereira and by the National Center for Scientific Research, the French Ministère de l'Europe et des Affaires Etrangères, and the Centro Francés de Estudios Mexicanos and Centro-Americanos in Mexico. All the data acquisition (fieldwork and remote sensing operations) discussed in the article received the authorization of the Consejo de Arqueología of the Instituto de Antropología e Historia of Mexico (permit numbers C.A.401-36/0356, 401.B[4]19.2011/36/1660, 401.B[4]19.2015/36/2458, 401.B[4]19.2016/36/2271) and complies with the permits’ terms. The operations are reported in technical reports submitted to and accepted by the same authority and available in the Consejo de Arqueología technical archives.
We want to thank Christophe Petit (professor, University Paris 1 Panthéon-Sorbonne) for making this experiment possible by opening his research seminar to our workshop in 2015. The following undergraduate and master's students actively participated in this initiative, and we thank them warmly for their hard work: Marie Benoît, Nicolas Bermeo, Clémence Bernard, Benjamin Buffet, Hugo Cador, Marion Connan, Ana Cremont, Margaux Desola, Sarah Davidoux, Claudia Dias, Amari Djama, Clément Membrives, Angélique Montes, Arthur Mouquet, Philippe Rajat, Madeleine Tisserand, Bastien Torres, Christophe Tuffery, and Clara Zimmer. Finally, we thank the three anonymous reviewers for providing insightful comments on this article.
Data Availability Statement
The lidar data used in this study are permanently stored at the Maison Archéologie et Ethnologie in Nanterre, France. For all requests or questions that concern the lidar data, please contact the Mésomobile project principal investigators: Dr. Grégory Pereira and Dr. Véronique Darras, CNRS UMR8096 ArchAm, Maison Archéologie et Ethnologie, 21 allée de l'Université, Nanterre Cedex F-92023, gregory.pereira@cnrs.fr, veronique.darras@mae.cnrs.fr.
The web mapping platform is available online after the creation of a user account. User account creation requests can be submitted to the project principal investigators and Dr. Laurent Costa (platform administrator), CNRS UMR7040 ArScAn, Maison Archéologie et Ethnologie, 21 allée de l'Université, Nanterre Cedex F92023, Laurent.costa@cnrs.fr.


