


Introduction
Cocoa (Theobroma cacao) is a perennial tree crop that plays a major role in the economies of a number of countries in the tropical belt, including Indonesia. Cocoa is mainly a smallholder crop, supporting farming communities around the globe. Requirements for plant growth and pod yields result in the uptake of substantial amounts of macronutrients from the soil, of which a large proportion are recycled within the agrosystem (van Vliet and Giller, Reference van Vliet and Giller2017). However, long periods of cocoa production result in the loss of nutrients from the system (Hartemink, Reference Hartemink2005). In addition, nutrient availability is affected by decreases in soil pH and soil organic matter (SOM) (Ahenkorah et al., Reference Ahenkorah, Akrofi and Adri1974; Wessel, Reference Wessel1971). Therefore, for any sustainable cocoa production an adequate fertiliser application regime is critical.
Comparative studies of soils under fallow land, secondary forest and cocoa in Cameroon and Nigeria demonstrated lower farm soil contents of the major plant macronutrients and SOM, as well as lower soil pH values in the soils supporting cocoa (Reference Adejuwan and EkanadeAdejuwan and Ekanade, 1988; Agoume and Birang, Reference Agoume and Birang2009). The result of these changes is that cocoa farms do not generally meet the recommended soil parameters for optimal production (Hardy, Reference Hardy1958; Harwood and McPaul, Reference Harwood and McPaul1959; Murray, Reference Murray1967; Nelson et al., Reference Nelson, Webb, Berthelsen, Curry, Yinil and Fidelis2011). Soil contents of N, P and exchangeable cations are frequently substantially less than the recommended amounts (Acquaye et al., Reference Acquaye, Smith and Lockard1965; Ahenkorah and Akrofi, Reference Ahenkorah and Akrofi1968; Hardy, Reference Hardy1958; Manikandan et al., Reference Manikandan, Joshi, Khan, Mohapatra and Biddappa1987). Soil C content is also commonly below recommended amounts as forest or fallow organic matter is reduced by cocoa cropping (Agoume and Birang, Reference Agoume and Birang2009; McMahon et al., Reference McMahon, Purung, Lambert, Mulia, Nurlaila, Susilo, Sulistyowati, Sukamto, Israel, Saftar, Amir, Purwantara, Iswanto, Guest and Keane2015; van Vliet and Giller, Reference van Vliet and Giller2017; Wessel, Reference Wessel1971). Wessel (Reference Wessel1971) found SOM to be correlated with total N, organic P, cation exchange capacity (CEC) and the sum of exchangeable bases and considered SOM and soil pH as key indicators of soil fertility (p. 19). Lower soil pH values also impact the uptake of P and micronutrients by cocoa plants (Ahenkorah and Akrofi, Reference Ahenkorah and Akrofi1968; van Vliet and Giller, Reference van Vliet and Giller2017). Despite the detrimental effect of cocoa production on soil properties, fertiliser applications by cocoa smallholders are often inadequate due to restricted access to capital and the ready availability of unsuitable formulations subsidised for food crop production (Moriarty et al., Reference Moriarty, Elchinger, Hill, Katz and Barnett2014; Mulia et al., Reference Mulia, McMahon, Purwantara, Djufry, Lambert, Keane and Guest2019; Ogunlade et al., Reference Ogunlade, Oluyole and Aikpokpodion2009). Farmers have not been provided with suitable (affordable) alternatives.
In Sulawesi, poor soil nutrition and long-term utilisation of inappropriate fertilisers, pest and disease impacts, ageing trees and human demographic changes have resulted in significant declines in cocoa farm productivity. Since Sulawesi is the primary centre of cocoa production in Indonesia, the decline in farm productivity on the island has created major impacts on national production (ICCO, 2015), as well as the livelihoods of smallholders (Arsyad et al., Reference Arsyad, Nasir, Arundhana, Phan-Thien, Toribio, McMahon, Guest and Walton2019). Cocoa is produced in a free market environment (Akiyama and Nishio, Reference Akiyama and Nishio1996; Ruf and Yoddang, Reference Ruf1998) and government intervention has been minimal and largely ineffective (Panlibuton and Lusby, Reference Panlibuton and Lusby2006). The problem is exacerbated by poor management practices, partly due to limited availability of capital to smallholder families for farm inputs, especially fertilisers (Moriarty et al., Reference Moriarty, Elchinger, Hill, Katz and Barnett2014). Government subsidies are provided for fertilisers, used for growing food crops, such as maize and rice, and these products are used on cocoa trees (Mulia et al., Reference Mulia, McMahon, Purwantara, Djufry, Lambert, Keane and Guest2019). These fertilisers, usually NPK (15:15:15), have a relatively high ratio of N, but cocoa, in common with many tree crops, requires high amounts of P and K in relation to N, as well as Mg (Nelson et al., Reference Nelson, Webb, Berthelsen, Curry, Yinil and Fidelis2011). For example, a formulation reported to be successful on cocoa farms in Malaysia and PNG includes Mg and has a relatively high K:N ratio (Nelson et al., Reference Nelson, Webb, Berthelsen, Curry, Yinil and Fidelis2011; Noordiana et al., Reference Noordiana, Syed Omar, Shamshuddin and Nik Aziz2007). Research in Ghana has shown high N inputs to have a negative effect on cocoa production; hence, the Ghanaian government recommends formulations with reduced N (van Vliet and Giller, Reference van Vliet and Giller2017). Excessive applications of N can result in high losses by leaching, especially on sandy soils (Huett, Reference Huett1997; Lessa and Anderson, Reference Lessa and Anderson1996) and ammonium sources of external N may result acidification of the soil due to nitrification (Marschner, Reference Marschner1995).
In order to increase productivity of their smallholdings, many cocoa farmers in Sulawesi are replanting their farms using productive cocoa clones with improved pest/disease resistance. This development is not usually matched by nutrient inputs, which is essential especially if soil fertility has already declined due to previous farm production based on long-term utilisation of ammonium-based fertilisers and inappropriate farming practices. To address this problem, appropriate and affordable mineral fertiliser formulations are needed. In addition, increasing the rate of organic amendment of smallholdings is a critical requirement and could be achieved by promoting subsidised organic fertilisers for Indonesian cocoa farmers as well as improved organic matter management on farms. SOM not only provides a reservoir of macro- and micronutrients but also improves nutrient availability to plants (Burger and Jackson, Reference Burger and Jackson2003; Steiner et al., Reference Steiner, Teixeira, Lehmann, Nehls, de Macedo, Blum and Zech2007; Tiessen et al., Reference Tiessen, Cuevas and Chacon1994). On marginal soils, organic amendments have also been demonstrated to increase survival rates, growth and yield of young cocoa, as well as plant nutrient contents (Acheampong et al., Reference Acheampong, Hadley, Daymond and Adu-Yeboah2015; Mulia et al., Reference Mulia, McMahon, Purwantara, Djufry, Lambert, Keane and Guest2019).
An experiment was conducted over a 4-year period to test the effect of combinations of a customised mineral fertiliser and other soil amendments, including a commercially available organic fertiliser and rock salt containing micronutrients, on growth of young cocoa on soils of low nutritional status in South Sulawesi. The main objectives of the study were to (1) evaluate the effect of alternative soil amendments on growth and flowering of cocoa trees in a replicated field trial, including (a) a nitrate-based (customised) fertiliser or alternatively, NPK with urea (used commonly by cocoa farmers) (b) a rock salt, an organic fertiliser and a microbial mix, all commercial products designed to improve crop productivity, supplied in combination with either of the two mineral fertiliser options and (2) evaluate the effect of the amendments on soil properties. We report marginal improvements in soil properties due to the alternative amendments and higher early growth rates in trees supplied with organic fertiliser. Overall growth and flowering were also higher in plants provided with the customised fertiliser and micronutrients than in those supplied with the NPK/urea fertiliser commonly used by local farmers.
Materials and Methods
Location of trial and climate
The trial was located on the Mars Cocoa Research Station in Tarengge, Wotu Subdistrict, East Luwu, South Sulawesi. Coordinates: 2.55574 S, 120.799211 E, 30 m above sea level. East Luwu has a wet, humid climate (Classification Af), with no dry months (Kottek et al., Reference Kottek, Grieser, Beck, Rudolf and Rubel2006), with September and October generally being the months with lowest rainfall. Temperatures range between 26 and 31 °C. Rainfall was measured daily at the Mars research station: data on total rainfall and the number of wet days per month were collected.
Treatments and trial design
Planting material
One cocoa genotype was used in the trial: a local clone, MCC02, certified and released by the national government. Budwood of the clone was collected from mature trees growing at the research station, grafted in a nursery onto root stock seedlings and issued from open pollinated seeds of the same clone trees. The grafted seedlings were maintained in a nursery for 6 months and then planted out in the trial location in April 2014. Planting holes (60 × 60 × 60 cm) had been pre-prepared with 5 kg compost in advance for 20 of the main treatments. Compost was prepared from cow manure, cocoa pod husks, empty oil palm bunches, rice straw and leaf material, such as Gliricidia sepium leaves. This was a commercial compost produced locally as a small business with only a small proportion (averaging 5%) of cocoa pod waste (depending on availability due to the crop cycle). In four additional treatments, the planting holes were not supplied with compost. Planting holes in the plots allocated for the best practice alternative treatments (customised fertiliser – see below) were pre-prepared with 200 g NPK fertiliser, 400 g dolomite, 3 kg organic fertiliser and 500 g rock phosphate, while in the remaining plots (usual farmer practice) 20 g NPK fertiliser was added to the planting holes. The cocoa seedlings were planted with a spacing of 2 × 3 m under light Gliricidia sepium shade. The spacing between the shade trees (approx. 550 ha−1) was 3 × 6 m. To thin the shade, some shade trees were removed 2 years after the cocoa was planted. The young cocoa plants were maintained at the trial site until June 2014, when treatments commenced (see below).
Trial design
The trial at Tarengge, East Luwu was based on an incomplete random block design with 4 replicate blocks and 24 treatments. Plots for each treatment were distributed randomly within their respective blocks. Blocks were contiguous on 2 ha land at the Mars Cocoa Research Station. Each plot consisted of 32 trees giving a total number of 3072 trees in the trial. Two outer rows of trees acted as guard rows for each plot (20 trees) and the 12 remaining trees in the centre of the plot were used for evaluations (a total of 1152 trees evaluated in the trial).
Treatments included combinations of soil nutrient amendments (mineral fertiliser, micronutrients (+/−), organic fertiliser (+/−) and microbial inoculations (+/−), and for trees treated with organic fertiliser, the microbial culture medium (+/−). In addition, selected treatments in each of four groups (A–D) that were not supplied with compost in the planting hole were included. Treatments are listed in Table 1.
Table 1. Treatments (combinations of soil nutrient amendments and a promoting microbial mixture) applied to the Tarengge trial in East Luwu: 24 combinations of mineral fertiliser (customised or farmer)/micronutrient/organic fertiliser treatmentsa with a microbial inoculumb and, for trees supplied with organic fertiliser, an inoculum consisting of the nutrient medium of the microbial preparation, without the microbesc. Compost was supplied to all planting holes except for four treatments: NPC-A-D (no planting compost A-D). Treatment combinations that included organic fertiliser supply are indicated by shading

aY (yes, treatment supplied); N (no, treatment not supplied); b200 ml of promoting microbes inoculated every 3 months; c200 ml of microbial culture medium (without microbes) inoculated every 3 months.
A maintenance schedule was established to manage the trial site. The young cocoa trees were pruned four times per year, by conducting heavy pruning in the wet season and light pruning in drier periods. Shade trees were pruned twice per year. Weeds were removed manually with a grass cutter once per month.
Soil amendments applied in the trial
Differential soil treatments (Table 1) commenced in June 2014. The cocoa saplings were provided with either a NPK fertiliser/urea combination commonly used by cocoa farmers in Sulawesi or an alternative formulated fertiliser. The ‘usual practice’ fertiliser was designated as ‘farmer fertiliser’ and the specially formulated fertiliser as ‘customised fertiliser’. Soil treatments were applied every 3 months (four times per year) providing the following total amounts to each tree per year: customised fertiliser was applied as a combination of Nitrabor (YaraLiva Nitrabor®; Yara, UK (480 g per tree per year), dolomite (680 g per tree per year), rock phosphate (680 g per tree per year) and KCl (280 g per tree per year)) while farmer fertiliser was urea combined with a commercially available NPK formulation (15:15:15) + TE (trace elements, including Mn, B, Cu, Zn and Mo) supplied in granular form. Mature trees were supplied with 480 g per tree per year NPK + TE and 320 g per tree per year urea. Lower amounts of NPK and urea mineral fertiliser were applied to young trees, beginning with 20 g NPK in June 2014, and increasing this by 20 g each quarter to the full amount (120 g per quarter) by September 2016, while urea was increased from 10 g in the first quarter to 80 g by September 2016. Fertiliser was supplied by distributing the total amount allocated per tree equally between four holes (5–10 cm deep) equidistant from each other and 75–100 cm from the tree. Nitrabor is nitrate-based, containing calcium nitrate and boron. The rock phosphate, originally from Egypt, consisted of 27% P2O5 and was supplied by PT Multimas Chemindo Indonesia. The dolomite (particle size 100-mesh) was a local product, Barokah Dolomit Super, containing 30% CaO, 18–22% MgO and 1% moisture.
Other soil nutrient amendments were combined with either of the two fertiliser types. These included micronutrients, a preparation based on rock salts and a commercial organic fertiliser, which were either applied at a rate of 200 g per tree per year and 8 kg per tree per year, respectively, or left out. The organic fertiliser (Petro organic, PT. Pupuk Indonesia (PERSERO) Group) properties included an approximately 12.5% C content, 10–25 C/N ratio, 4–12% moisture content and pH 6–8. Various materials were used to prepare the product including cow manure, chicken manure, sugarcane stem waste and oil palm bunch waste. The product was used in the trial as it is one of the few available organic fertiliser products subsidised by the national government, making it affordable to farmers. Rock salt used in the trial was a finely ground product originally from Java containing a range of trace elements, including 1–5 ppm micronutrients such as B, Se, Mn, Zn, Ni and Cu, as well as 0.01% contents of Ca, Mg, S, Fe, Na and K (Supplementary Table a).
Additional treatments, a promoting microbe preparation and its nutrient culture medium without the microbes, were supplied by Agrinos (USA) and also applied in combination with the other treatments or left out (Table 1). The Agrinos commercial product HYT® was received in three bottles: HYT-A®, a microbial solution, HYT-B®, an amino acid nutrient solution and HYB-C®, a powder of hydrolysed chitin. A volume of 268 litres of tap water (pH 5–6) was added to 4 litres of HYT-A, 4 litres of HYT-B and 400 g of HYT-C, stirred well and left for 72 h for activation. pH was checked every 24 h, decreasing pH indicating microbial activation/activity and proliferation. After 3 days, an additional 4 litres of HYT-B was added to form the final microbial solution to be used in the field. The microbial composition of the product was not released by the company. Every 3 months, trees in the plots allocated for these treatments were supplied with either 200 ml per tree of the microbial preparation or an equivalent volume of the microbial nutrient medium (containing hydrolysed chitin and amino acids) without microbes to check for a possible effect of these microbial nutrients on native soil microbes. The latter treatment (with only microbial nutrients) also acted as a control for the commercial microbial inoculum to assure that in case of any effect by this commercial product, it could be affirmed that this was due to the added microbes and not native microbial activity supported by specific microbial nutrients in this product.
The soil amendment combinations were divided into four groups (A–D), with each group consisting of 5 treatments, giving a total of 20 treatments. Four additional plots in each group of treatments were used to test the effect of adding no compost to the planting holes in comparison with equivalent treatments in the group that included planting compost. Including the zero planting compost treatments, a total of 24 soil treatments were applied in the trial (Table 1).
Parameters evaluated in each treatment
Soil parameters
Soil parameters were evaluated in each plot in 2017, 3 years after treatments were commenced. After removing litter at the surface, topsoil subsamples were collected in each plot to 20 cm depth following a zigzag path through the plot. Nine subsamples in each plot were combined, mixed, oven-dried and stored prior to testing at a certified soil lab, Palm Oil Research Institute, Medan, Sumatra. Soil parameters measured included pH (water), carbon content, nitrogen and organic nitrogen, exchangeable cations, CEC, base saturation, exchangeable Al and total Zn concentrations. Sand, silt and clay content were determined by the Pipette method. Organic C was determined by the Walkley-Black method. Total N was determined by the Kjeldahl method. Inorganic N was determined following extraction of nitrate and ammonium ions from soil into solution. The difference of total and inorganic N concentrations provided an estimate of organic N concentration. Available P was determined by the Bray 1 method: air-dried soil was extracted with 0.025 N HCl and 0.03 N NH4F, the filtrate treated with molybdate–ascorbic acid reagent and P concentration estimated by colorimetric determination. Exchangeable Ca, Mg, K and Na were determined following extraction in ammonium acetate (pH 7) and atomic absorption spectroscopy (AAS). Zn (total) was extracted with 25% HCl and measured by AAS. Soil exchangeable Al was extracted with KCl (1 N) and determined by AAS.
Cocoa trees
Evaluation of growth, leaf flush production and pest/disease incidence commenced in August 2014, while evaluation of flowering commenced in October 2014. For the 4.5-year period, evaluations were conducted at the beginning of each month.
Growth
Stem diameter was measured in each tree every month. Incremental growth in the stem was determined for each individual tree after the first evaluation as the difference in tree diameter from the previous month, providing an estimate of the rate of diameter expansion (or the absolute growth rate) per month. To estimate cumulative growth of each tree, growth increments were added to each successive month. The average growth rate of the 12 trees in each of the 4 replicate plots was used in statistical analyses to compare treatments.
Flushing and flowering
Flowering was evaluated from 2014 to March 2018 in the trees using the following score system (1–4): 1, nil (no flowers); 2, low (1–20 flowers per tree); 3, medium (20–100 flowers per tree); 4, high (over 100 flowers per tree). Flushing was scored from nil to high (1–4) in the same period as follows: 1, no leaf flushes; 2, flushes on 1–5 branches; 3, flushes on 6–10 branches; 4, flushes on >10 branches. For both flushing and flowering, the average score of the 12 trees in each plot was calculated, providing 4 replicate values. The replicates were used to obtain the means and other statistics.
Statistical analyses
Three-way models (GLM) and pairwise comparisons
Average incremental growth and flowering under differential treatments for the total period of evaluation (July 2014 to November 2018) and for the first year of evaluation only (July 2014–June 2015) were analysed separately. All statistical analyses were conducted on IBM’s SPSS Ver 25 using one-way ANOVA or the general linear model (GLM), which enabled models to be applied testing growth and flowering for main effects and their interactions, in addition to pairwise comparisons. To evaluate the effect of the major soil nutrition amendments on growth and other parameters, a GLM three-way factorial model was applied to test the main effects and interactions of fertiliser (‘customised’ or ‘farmer’), micronutrients (with/without) and organic fertiliser (with/without). The model was balanced by excluding treatment 2 in each of fertiliser combinations and the zero planting compost controls. Both of these were included in one-way ANOVA (see below). Tests for normality (Shapiro–Wilk) and homogeneity (Levene’s test for homogeneity) of the data were applied to ensure the validity of the analysis.
One-way ANOVA
For each combination of soil nutritional treatment, the effect of applying promoting microbes (or their culture medium), on growth, flowering and flushing was tested by one-way ANOVA. The effect of withholding compost in the planting holes was compared with their equivalent treatments, all of which included planting compost (see Table 1).
Correlations of growth and flowering with soil properties
For each plot, Pearson correlation tests were applied to compare growth (incremental increase in diameter per month) and flowering with individual soil parameters.
Results
Soil parameters in 2017
Baseline soil parameters at the site prior to establishment of the trial are shown in Table 2, in addition to the minimum soil requirements recommended for cocoa production. Figures 1–3 show mean values for soil parameters determined in 2017 in the Tarengge trial, East Luwu (3 years after the treatments were commenced) in plots receiving differential mineral fertiliser (customised or farmer practice), micronutrient (with or without) and organic fertiliser (with or without) treatments. The soil at the trial site in 2017 had an average sand/silt/clay % distribution of 43/39/18. In plots treated with ‘farmer’ fertiliser (NPK/urea), mean soil pH (4.7) was lower than the minimum recommended value of 5.5 (Table 2), but plots supplied with customised fertiliser had a higher mean soil pH (5.4). Organic fertiliser treatment also appeared to increase soil pH slightly (Figure 1a). Mean soil C and total N contents, however, were unaffected by the nutrient amendments (Figure 1b and Figure 1c). In addition, soil C content was lower than recommended values (Table 2). Most of the total N (>90%) was in organic form. The soil C/N ratio, which varied between 7 and 8, was little affected by the nutrient amendments (data not shown). However, available P was substantially higher in plots receiving farmer fertiliser (11.8 ppm) than in those supplied with customised fertiliser (7.8 ppm) and also increased by organic fertiliser supply (Figure 1d).
Table 2. Recommended soil nutrient contents and other properties on cocoa farms
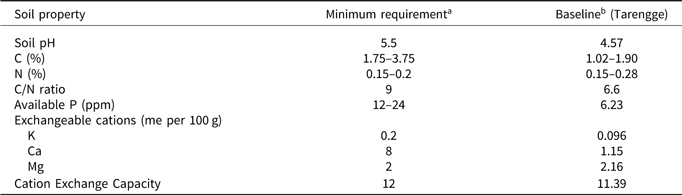
aAfter Wessel (Reference Wessel1971) and Hardy (Reference Hardy1958); bbefore treatments commenced.

Figure 1. (a) Soil pH, (b) C (%), (c) total N (%) and (d) available P (ppm) in the trial at Tarengge, East Luwu showing marginal means after 3 years of soil nutrient amendment with customised/farmer fertiliser, +/− micronutrients and +/− organic fertiliser.

Figure 2. Concentrations of exchangeable K (a), Na (b), Ca (c) and Mg (d) in the trial at Tarengge, East Luwu showing marginal means after 3 years of soil nutrient amendment with customised/farmer fertiliser, +/− micronutrients and +/− organic fertiliser.

Figure 3. (a) Base saturation (%), (b) cation exchange capacity (CEC), (c) total exchangeable cations, (d) exchangeable Al, (e) Zn (ppm) and (f) conductivity in the trial at Tarengge, East Luwu showing marginal means after 3 years of soil nutrient amendment with customised/farmer fertiliser, +/− micronutrients and +/− organic fertiliser.
Figure 2 indicates exchangeable Ca and Mg concentrations in all treated plots were below levels recommended for cocoa production (van Vliet and Giller, Reference van Vliet and Giller2017; Nelson et al., Reference Nelson, Webb, Berthelsen, Curry, Yinil and Fidelis2011), as indicated in Table 2. The average baseline soil Mg content for the trial site was relatively high (Table 2), but some of the eight individual subsamples in the baseline analysis (varying between 0.98 and 2.24% Mg) were deficient. Exchangeable K deficiency was also detected in baseline measurements (Table 2), but following the nutrient amendments exchangeable K was generally sufficient (Figure 2a). However, Ca/Mg/K ratios were below recommended values (Hardy, Reference Hardy1958). Customised fertiliser application resulted in substantially higher exchangeable cation concentrations than treatment with farmer fertiliser. Organic fertiliser treatment clearly increased exchangeable Ca (Figure 2c). Generally, the soil data indicated that the alternative soil treatments (particularly using customised and organic fertiliser) had a beneficial effect on soil nutrient cations by increasing the concentration of total exchangeable cations and the base saturation (Figure 3a and Figure 3c). Applying customised fertiliser, micronutrients or organic fertiliser resulted in higher means for CEC, but the data were too variable to be conclusive (Figure 3b).
Mean exchangeable Al and total Zn concentrations were both higher in the farmer fertiliser-treated plots (Figure 3d and e). Soil conductivity was slightly higher in the customised fertiliser plots (Figure 3f).
Tree growth and flowering
Soil nutrient amendments and growth
Growth was determined by the incremental increase in stem diameter each month. Cumulative growth per month for treatment groups A–D for the total evaluation period of 1584 days (from August 2014 to November 2018) indicates rapid growth occurred in the first year, but this slowed after July 2015 (Figure 4a). Tree growth slowed in the dry seasons, particularly in 2015 during an extended, severe dry season. Tables 3 and 4 show significant main effects and interactions identified by three-way ANOVA, and pairwise comparisons of the estimated marginal means of the mineral fertiliser, micronutrient and organic fertiliser treatments. Among the soil amendments (Table 1), the trees treated with customised fertiliser (A and B) had a higher average growth rate for the total evaluation period than those supplied with the farmer fertiliser (C and D) (Tables 3 and 4). However, a significant difference for growth between the two fertiliser treatments did not occur in the first year. On the contrary, the trees supplied with organic fertiliser grew more rapidly in the first year (Figure 4b, Tables 3 and 4), although the marginal mean rate of growth for the total (4-year) period was not significantly higher in trees supplied with organic fertiliser. Nevertheless, Figure 4b indicates that the advantage created by higher early diameter increments in the trees treated with organic fertiliser was maintained until December 2018.

Figure 4. Cumulative expansion of the stem diameter, (a) and (b), and flowering (c) of cocoa trees in the Tarengge trial, East Luwu supplied with customised fertiliser/micronutrients (A), customised fertiliser/no micronutrients (B), farmer fertiliser/micronutrients (C) or farmer fertiliser/no micronutrients (D) (graphs a and c) or provided with/without organic fertiliser (graph b). Growth was monitored each month for over 4 years beginning in August 2014 and flowering was scored monthly for over 3 years, beginning in October 2014. Growth and flowering data are the means of four replicates. Grey bars (right-hand axis) indicate the total rainfall (mm month−1) during the evaluation period.
Table 3. Main effects and interactions of three soil amendments on the average incremental increase in diameter per month of cocoa trees and flowering score at Tarengge: left, the first year after treatments were applied; right, the total period (4 years) of evaluation

*p < 0.05; **p < 0.01; a R 2 = 0.161, Adjusted R 2 = 0.056; b R 2 = 0.274, Adjusted R 2 = 0.183; c R 2 = 0.162, Adjusted R 2 = 0.057; d R 2 = 0.216, Adjusted R 2 = 0.118.
Table 4. Pairwise comparisons of estimated marginal mean (EMM) values in three-way factorial models

* p < 0.05
A significant interaction occurred between micronutrient (rock salt) supply and the mineral fertiliser treatment (Table 3) as growth was higher in farmer fertiliser treatments that included micronutrients (Figure 4). As shown in Figure 4a, trees supplied with a combination of farmer fertiliser and micronutrients (group C, see Table 1) grew more rapidly, especially in the earlier stages of growth, than the farmer fertiliser-treated trees without micronutrients (group D).
The drought of 2015 (beginning in the middle of the year, Figure 4a and Figure 4b) had a clear impact on trees in all of the treatments in the Tarengge trial, almost halting growth for 2 months – the extremely low rainfall in this period is shown in Figures 4 and S1. A slight decrease in growth rate occurred in mid-2016. This coincided with the first significant pod production levels in the young trees. The growth rate then remained constant until evaluation was completed in early December 2018.
Flowering
As the young trees developed flowering rates increased (Figure 4c), although this trend was interrupted by the dry conditions of 2015. The customised fertiliser and micronutrient treatment both had significant positive effects on the average flowering score for the total period (Tables 3 and 4). Figure 4c indicates average flowering scores in the Treatment A plots were higher than in the other treatments, especially in the first 2 years of evaluation. Added rock salt (micronutrient treatment) also significantly increased flowering in the first year (Tables 3 and 4).
Microbial treatments
The effect of individual combinations of nutrient amendments and microbial inoculations on the average growth rate and flowering score for both the first year and the whole period are shown in Figure 5. No significant differences in either growth or flowering were detected between individual treatments (one-way ANOVA, Tukey b test). However, the significant effect of organic fertiliser supply on early growth detected by factorial analysis (Tables 3 and 4) is apparent in the higher growth rates in the first three treatments (1–3) as shown in Figure 5.

Figure 5. Average growth rate (+/− SE) in (a) the first year of evaluation and (b) 4.5 years and the average flowering score (+/− SE) in (c) the first year of evaluation and (d) 3.5 years, of cocoa trees in the Tarengge trial, East Luwu following microbial/organic fertiliser combined treatments (1–5) and a comparative treatment where no planting compost was provided (see Table 1): OF, organic fertiliser; MB, microbial inoculation (including microbes and culture medium); N, culture medium only. No significant difference was detected between treatments (one-way ANOVA, Tukey b test, p < 0.05).
In addition, Figure 5 shows data for the zero planting compost treatments included in each of the treatment groups (A–D): for either growth or flowering no significant differences occurred between the zero planting compost controls and their respective, comparative counterparts in each group (A1, B5, C1 and D5).
Correlations between soil properties, growth and flowering
Pearson correlations of soil properties with average growth rates and flowering score in each plot are shown in Table 5. Soil pH was positively correlated with average growth in the first year. The data indicate soil exchangeable Al decreased growth. In addition, negative correlations were detected in the first year of growth for total and organic N. However, average growth in the total period was higher in plots with relatively high available P and exchangeable Mg. Correlations between soil properties and flowering scores in each plot of the trial indicated a positive effect of soil exchangeable basic cations, particularly Ca2+ and Mg2+ on flowering (Table 5). As with growth, the correlation of flowering and Al was negative.
Table 5. Pearson correlations of growth rates and flowering scores with soil properties in individual plots

*p < 0.05; **p < 0.01.
Microbial treatments and soil P
Data on growth and available P concentrations for the combined fertiliser/microbial inoculation treatments (Figure 6) indicate a strong relationship between supply of organic fertiliser and promoting microbes or the nutrients used to sustain soil microbes. Treatments 1 and 2, which included a mixture of beneficial microorganisms or the nutrients supporting growth of microbes, resulted in significantly higher soil concentrations of available P (Figure 6). This suggests available P was promoted by the introduced microbial inoculum in treatment 1 and native microbes in treatment 2. The decreasing trend in available P between treatments 1 and 3 (treatment 3 with organic fertiliser but without microbial inoculum) was matched by average growth rates, both in the first year (Figure 6a) and the total period (Figure 6b). Available P and growth values resulting from treatment 2 (which supplied the nutrient culture supporting growth of microbes) were intermediate (Figure 6a and Figure 6b), but neither were significantly different from values in treatment 1. Growth rates were particularly low in the farmer fertiliser (NPK/urea) plots with no organic fertiliser added (i.e. treatments 4 and 5 in group C and D) while farmer fertiliser treatments combined with organic fertiliser and microbial inoculations (treatments 1 and 2) had similar growth rates to the best practice (customised fertiliser) treatments (data not shown).

Figure 6. Effect of treatments 1–5 on available P concentration (vertical bars) 3 years after soil amendments commenced and average growth (broken line, right-hand axis) in the first year (a) and over the total 4-year period (b) in the Tarengge trial, East Luwu: OF, organic fertiliser; MB, microbial inoculation (including microbes and culture medium); N, culture medium only. For soil P concentrations, the same letter indicates no significant difference (p < 0.05) occurred between treatments.
Flushing
Leaf flushes were produced regularly, independently of total rainfall or the number of wet days (Figure S1). However, the dry conditions in 2015 were associated with greater fluctuations in the number of leaf flushes than in later (wetter) years. Figure S1 shows flushing from 2014 to 2018 in plots supplied with farmer fertiliser or customised fertiliser. These amendments had no effect on the degree of flushing producing almost identical trends (Figure S1) and no significant differences in flushing were detected due to amendments (data not shown).
Discussion
Effect of soil amendments on growth rates
Growth and soil data collected from the trial at Tarengge demonstrated that the alternative soil nutrient amendments (customised nitrate-based fertiliser, micronutrients and organic fertiliser) promoted growth of the young cocoa trees. Marginal mean rates of stem diameter increment over 4 years were higher in the cocoa trees supplied with the customised fertiliser, a combination of Nitrabor (Ca nitrate + boron), dolomite, rock phosphate and potassium chloride, than in those supplied with NPK/urea (‘farmer fertiliser’). Available P and exchangeable cations (particularly Ca and Mg) concentrations appeared to be more limiting than soil N as they were below minimum recommended levels for cocoa farms (see Table 2) and positive correlations with growth were detected in individual plots (Table 5). The negative correlation of soil N and organic N with growth in the first year (Table 5) might be related to a high N:P ratio, which can lead to lower uptake of P. Reports from Nigeria and Cote d’Ivoire attribute suppression of early growth in cocoa to decreased P uptake as a result of using fertilisers with a relatively high N content (van Vliet and Giller, Reference van Vliet and Giller2017; Wessel, Reference Wessel1971). Mainstone et al. (Reference Mainstone, Thong and Tan1977) recommended adding sufficient P to cocoa planting holes in Malaysia. High soil N and P relative to K and Mg can also suppress growth of young cocoa plants, and Wessel (Reference Wessel1971) recommends that N supply should be balanced with K and Mg. In the trial in Tarengge, the NPK/urea (farmer fertiliser) possibly resulted in high soil nutrient ratios in the root zone (e.g., the N:P ratio) suppressing uptake of macronutrients required for growth. This may account for the negative correlation of total/organic N and early growth (Table 5).
Exchangeable cation concentrations were positively correlated with both growth and flowering (Table 5). Three years after treatments were commenced, application of customised nitrate-based fertiliser had resulted in increased concentrations of exchangeable cations and higher soil pH (5.4), in comparison with farmer fertiliser treatments with ammonium-based NPK/urea. This effect could be attributed to dissolution of the dolomite and rock phosphate (which contains CaO) provided in the customised treatment as well as to the exclusive use in this treatment of nitrate as a source of nitrogen; nitrate salts do not cause acidification of soil as is the case with ammonium-based formulations, such as the NPK fertiliser in the farmer treatment. The negative correlation between growth and exchangeable Al (Table 5) taken together with higher Al concentrations in plots supplied with farmer fertiliser could have contributed to the lower average growth rates of trees treated according to usual practice (Figure 4). Lower soil pH in the farmer treatment might account for the higher exchangeable Al levels in these plots since acidic conditions increase soil availability of Al. Since exchangeable Ca and Mg levels were low (especially in the farmer fertiliser treatments), Al ions possibly impaired growth by displacing the nutrient cations from exchange sites.
While customised fertiliser supply resulted in higher exchangeable cation concentrations, soil pH and growth rates than the ‘farmer fertiliser’ treatment, this was not the case for available P. The marginal mean concentration of available P was higher in soils amended with NPK/urea or ‘farmer fertiliser’ than in those supplied with the customised fertiliser (Figure 1d). In the customised fertiliser treatment, P was supplied in the form of rock phosphate. Release of P from rock phosphate into available forms has been reported to be slower than from conventional NPK fertilisers (Yusdar and Hanafi, Reference Yusdar and Hanafi2003). For example, in a trial in North Sumatra P was applied either in the form of triple superphosphate or rock phosphate to mature cocoa, resulting in lower yields in the trees supplied with rock phosphate. This was attributed by the researchers to insufficient P uptake due to low solubility of the rock phosphate (Sidhu et al., Reference Sidhu and Sinuraya2003). In the Tarengge trial, slow P release from rock phosphate would have been exacerbated by its combination with dolomite (in the customised treatment), as P dissolution rates from rock phosphate decrease as soil pH is increased (Mosaic, n.d.).
Despite higher P availability in farmer fertiliser treatments and the correlation of available P with growth (Figure 1d; Table 5), average growth rates were lower in trees supplied with farmer fertiliser. The lower growth rates could have been a result of a low soil pH in these plots (Figure 1a), which results in fixation of mobile forms of P and displacement of nutrient cations from soil exchange sites. However, as discussed further below the data suggest microbial inoculations combined with organic fertiliser supply promoted growth and P availability in both the NPK/urea and customised fertiliser treatments.
Role of microbial inoculations in P availability and growth
The positive correlation of available P concentration and growth rate (Table 5) suggests P availability in the trial was limiting to growth. Applying the microbial mix or supporting native microbes with microbial nutrient medium, in the presence of organic fertiliser, increased available P and growth rates (Figures 5 and 6). Growth rates for these treatments (1 and 2, see Table 1) were similar whether supplied with customised or farmer fertiliser. In contrast, trees in the farmer fertiliser plots without added organic fertiliser (treatments 4 and 5) had much lower growth rates (data not shown). The lower marginal mean growth rates in the farmer fertiliser treatments could be explained by the very low growth rates in these plots, which had no organic amendment. These data suggest the combination of organic fertiliser and microbial inoculations strongly promoted growth and improved P availability (Figure 6), particularly in the farmer fertiliser plots. In the case of treatment 2, presumably native microorganisms were promoted by the microbial medium, a mixture of chitins and amino acids, used as nutrients in commercial microbial inoculum. No significant difference in available P was observed between treatments 1 and 2, indicating similar efficiency of native microbes and commercial inoculum. Specific microbial nutrients present in the commercial microbial product used in the experiment possibly promoted native microbial activity, which was practically as efficient as the commercial microbial inoculum in treatment 1. However, organic fertiliser supply without microbes or the specific nutrient medium (treatment 3) resulted in lower levels of P availability. A large proportion of soil P is associated with organic matter (Omotoso, Reference Omotoso1971), some of which is released by enzymes, such as phosphatase, secreted by soil microbes and this could account for the significantly high P concentrations in organic fertiliser/microbial treatments.
Organic fertiliser and early growth
Organic fertiliser supply significantly increased growth rates in the early period of rapid growth (the first year after treatments were applied, Tables 3 and 4; Figure 4b). Nutrient demand is high during early growth (Adejobi et al., Reference Adejobi, Agele and Ewulo2017) and the positive correlation of soil pH and growth in the Tarengge trial during this period (Table 5) might be related to greater availability of critical nutrients, especially P and exchangeable cations. Higher rates of early, compared to later, growth recorded in other tree species have been linked to N supplied with mineral fertiliser (Cicek et al., Reference Cicek, Yilmaz and Yilmaz2010), but in Tarengge soil concentrations of other nutrients, including P, were positively correlated with growth (Table 5), indicating they were limiting. Since P was limiting at Tarengge and organic fertiliser increased available P, particularly in combination with added promoting microorganisms (Figure 6), this might account for the positive effect of the organic fertiliser on growth. Organic forms of P require microbial activity for release into forms available to plants (Jacoby et al., Reference Jacoby, Peukert, Succurro, Koprivova and Kopriva2017). Studies in Kerala showed that mixed cropping increased SOM content, which was in turn associated with increased levels of beneficial microorganisms, including phosphate-solubilising bacteria (Nair and Rao, Reference Nair and Rao1977). It is possible that soil microbes were active in promoting P uptake from the rock phosphate supplied as part of the customised fertiliser in the Tarengge trial. Phosphate-solubilising bacteria and AM fungi have been reported to solubilise P from inorganic sources including rock phosphate (Kaleem Abbasi and Manzoor, Reference Kaleem Abbasi and Manzoor2018; Yusdar and Hanafi, Reference Yusdar and Hanafi2003). However, liming (part of the customised fertiliser treatment) could have impeded P release from rock phosphate sources.
The importance of organic matter supply is indicated by the results of treatment 4 and 5 plots in group C and D (farmer fertiliser supply with no organic matter added, Table 1), which had the lowest growth rates in the trial (data not shown). Positive effects of organic amendment on cocoa tree survival, growth and yield have been reported in West Africa (Acheampong et al., Reference Acheampong, Hadley, Daymond and Adu-Yeboah2015; Adejobi et al., Reference Adejobi, Akanbi, Ugioro, Adeosun, Mohammed, Nduka and Adeniyi2014) and Indonesia (Mulia et al, Reference Mulia, McMahon, Purwantara, Djufry, Lambert, Keane and Guest2019). A correlation of cocoa yield and soil organic P content was demonstrated in Nigeria (Omotoso, Reference Omotoso1971). Acheampong et al. (Reference Acheampong, Hadley, Daymond and Adu-Yeboah2015) reported higher stomatal conductance, as well as water use efficiency, in trees supplied with organic fertiliser. Organic amendment has been reported to improve exchange capacity and to enhance microbial activity (Burger and Jackson, Reference Burger and Jackson2003; Steiner et al., Reference Steiner, Teixeira, Lehmann, Nehls, de Macedo, Blum and Zech2007). Microbial biomass in soil increases with supply of organic matter (Alfaro-Flores et al., Reference Alfaro-Flores, Morales-Belpaire and Schneider2015). Exchange sites and microbes stimulated by organic matter provide a reservoir of nutrients and enhance plant availability (Burger and Jackson, Reference Burger and Jackson2003; Tiessen et al., Reference Tiessen, Cuevas and Chacon1994). In the Tarengge trial, the organic treatment also increased exchangeable Mg and Ca (Figure 2). In a trial on a marginal soil in Sulawesi, Mulia et al. (Reference Mulia, McMahon, Purwantara, Djufry, Lambert, Keane and Guest2019) reported that organic amendment with compost increased growth, yield and tissue Ca and Mg concentrations in young cocoa trees. In particular, higher tissue Mg/K ratios following soil treatments that also included dolomite were attributed to an effect of the organic amendment.
Micronutrients and growth
The significant interaction of the micronutrient and mineral fertiliser treatments (Table 3) is indicative that growth was promoted when micronutrients were supplied in combination with farmer fertiliser, but not with customised fertiliser (see Figure 4a). This suggests either the rich mixture of customised fertiliser and micronutrients led to higher salinity levels (with a negative impact on growth) or alternatively, micronutrient treatment compensated for a factor(s) lacking in the farmer fertiliser. Higher salinity levels might also have inhibited microbial activity (pers. Comm. by supplier, Agrinos). Although the marginal mean of soil conductivity (an indicator of salinity) in the customised fertiliser-treated plots was slightly higher than that for the NPK/urea amended plots (Figure 3f) it remained relatively low. An alternative explanation is that nutrients lacking in the farmer fertiliser, such as Mg and Ca, were provided in the rock salt (the reported product content of both elements is 0.01%, Supplementary Table a).
Flowering and leaf flush production
Flowering rates were higher in soil treatments receiving customised fertiliser or micronutrients. Clearly, the NPK/urea (farmer fertiliser) treatment lacks an ingredient or factor necessary for flowering. The data in Table 5 indicate a positive correlation between basic cations, especially calcium and magnesium, and average flowering score. The significant effect of micronutrients in the first year (Tables 3, 4) suggests that a high demand for a factor provided by this treatment occurred during this period of rapid growth. During this period, the combined amendment of customised fertiliser and micronutrients (treatment A) resulted in higher flowering rates than the other treatments (Figure 4c).
Nutrient amendments in the trial did not have an impact on leaf flush production (Figure S1), confirming observations in previous studies (Cunningham et al., 1961). Cycles of leaf flush production are generally determined internally, rather than by climatic factors (Almeida and Valle, Reference Almeida and Valle2010;; Asomaning et al., Reference Asomaning, Kwakwa and Hutcheon1971; McMahon et al., Reference McMahon, Susilo, Parawansa, Bryceson, Nurlaila, Mulia, Saftar, Purwantara, bin Purung, Lambert, Guest and Keane2018). However, dry conditions (especially during the drought of 2015) appeared to increase fluctuations in leaf flushing.
Rehabilitating soils to support cocoa production
Despite applying soil amendments for 3 years (including dolomite to half of the plots), by 2017 the topsoil at the trial site in Tarengge remained deficient in exchangeable Ca and Mg, with concentrations below minimum recommended levels for cocoa growth and production (see Figure 2). Cocoa production has a detrimental impact on exchangeable cation concentrations. Ahenkorah et al. (Reference Ahenkorah, Akrofi and Adri1974) reported that Ca, Mg and K concentrations decreased by 10, 22 and 23%, respectively, in soil under unshaded cocoa. Low soil Mg has been reported to be limiting in cocoa production systems in West Africa (Charter, Reference Charter1956; Jadin and Snoeck, Reference Jadin and Snoeck1985; Wessel, Reference Wessel1971), Indonesia (Mulia et al., Reference Mulia, McMahon, Purwantara, Djufry, Lambert, Keane and Guest2019) and Malaysia (Shamshuddin et al., Reference Shamshuddin, Azura, Shazana, Fauziah, Panhwar and Naher2014). For this reason, a number of fertiliser formulations recommended for cocoa production include MgO (Cunningham and Lamb, Reference Cunningham and Lamb1959; Nelson et al., Reference Nelson, Webb, Berthelsen, Curry, Yinil and Fidelis2011; Noordiana et al., Reference Noordiana, Syed Omar, Shamshuddin and Nik Aziz2007). In the Tarengge trial, higher mean concentrations of exchangeable Ca and Mg in plots treated with customised fertiliser could be attributed to the use of dolomite (as part of the customised fertiliser treatment), while less Ca or Mg was added with the farmer fertiliser (NPK/urea). The higher pH values in plots treated with customised fertiliser could have increased uptake of exchangeable cations, promoting growth. Low exchangeable Ca:K and Mg:K ratios possibly affected growth in the trial, for example, Mg is sensitive to displacement from exchange sites by K (Kurvitis and Kirkby, Reference Kurvitis and Kirkby1980).
Soil organic content has been reported to be lower under cocoa than other land use systems, including fallow and secondary forest (Agoume and Birang, Reference Agoume and Birang2009). At Tarengge, despite treatment with organic fertiliser and mineral amendments for 3 years, the marginal mean of % C for this treatment was not higher than in plots not including organic amendment (Figure 1b), indicating that maintaining a high SOM content is challenging. The results of the trial highlight the importance of organic matter and suggest the relation of organic matter and microbial activity is a key determinant of P availability. Phosphorus stocks in soil (ca 80 kg ha−1) are much lower than soil stocks of total N (5000–7000 kg ha−1) or K (400–1300 kg ha−1) (van Vliet and Giller, Reference van Vliet and Giller2017), making cocoa farms vulnerable to P deficiency. P bioavailability is generally low, especially in weathered tropical soils (Hinsinger, Reference Hinsinger2001); a large proportion of P on cocoa farms (e.g., 21–74% in Nigeria) is reported to be fixed and unavailable for plant uptake (Omotoso, Reference Omotoso1975). This is exacerbated by other factors, such as heavy shade, low soil pH and a high ferric content (Jadin and Snoeck, Reference Jadin and Snoeck1985; van Vliet and Giller, Reference van Vliet and Giller2017). In the Tarengge trial, cocoa growth was responsive to NPK in the presence of microbial treatments combined with supply of organic matter (Figure 6), and this response appeared to be closely associated with available P concentrations (Table 5).
Applying combinations such as those in the customised nitrate-based formulation used in the Tarengge trial would be beneficial to cocoa growing communities, especially when they are replanting cocoa. Indonesian governmental departments could implement the promising strategy of developing a specific and affordable mineral fertiliser suitable for cocoa and encourage smallholders to address issues of soil, nutrition and productivity limitations. It is recommended that any governmental cocoa project should include training of farmers on soil management, with a special focus on organic matter management and liming to improve soil fertility and assure the future of cocoa in Indonesia.
Conclusion
The results of the experiment in Tarengge on establishment of young cocoa on depleted cocoa soils have shown significantly higher rates of growth and early flowering in treatments combining organic fertiliser and customised nitrate-based fertilisers. The alternative treatments, including organic fertiliser with micronutrients and microbial inoculum, applied in the trial at Tarengge also improved some soil parameters. The positive effects on cocoa tree growth and flowering were particularly evident during the time of tree establishment in the first 2 years after planting. Further studies are needed to establish the mechanisms underlying the beneficial effect of the alternative nutrient amendments tested in this trial.
Acknowledgements
Mars Cocoa Research Station (Tarengge) field staff collected and collated data over the 4 years of the experiment.
Financial support
None.
Supplementary materials
For supplementary material for this article, please visit https://doi.org/10.1017/S0014479720000320


