


INTRODUCTION
Oysters are the premier ecological engineers of the temperate zone and have been so since the Cretaceous (e.g. Gutíerrez et al., Reference Gutíerrez, Jones, Strayer and Iribarne2003; Parras & Casadío, Reference Parras and Casadío2006; El-Sabbagh, Reference El-Sabbagh2008; Troost, Reference Troost2010; Powell et al., Reference Powell, Klinck, Ashton-Alcox, Hofmann and Morson2012a). Unlike their contemporaneity of tropical waters, the corals, the calcium carbonate underpinning substrate production and reef building by the oyster is fully and continuously exposed to the elements while the animal is alive. Destruction of the oyster shell begins during life (Barnes et al., Reference Barnes, Luckenbach and Kingsley-Smith2010; Carver et al., Reference Carver, Thériault and Malley2010) and proceeds apace after death (Christmas et al., Reference Christmas, McGinty, Randle, Smith and Jordan1997; Powell et al., Reference Powell, Kraeuter and Ashton-Alcox2006; Powell & Klinck, Reference Powell and Klinck2007; Waldbusser et al., Reference Waldbusser, Steenson and Green2011), so that the reef framework is sustained only by the continual input of shells as the animals die (Mann et al., Reference Mann, Harding and Southworth2009a; Southworth et al., Reference Southworth, Harding, Wesson and Mann2010; Powell et al., Reference Powell, Klinck, Ashton-Alcox, Hofmann and Morson2012a). In contrast, corals cover much of their skeleton with living tissue, thereby limiting taphonomic attack during life, likely a necessity given the high rates of carbonate degradation in these climes (Greenstein & Pandolfi, Reference Greenstein and Pandolfi2003; MacDonald & Perry, Reference MacDonald and Perry2003; Mallela & Perry, Reference Mallela and Perry2007). Oyster reefs, like all other hardgrounds created by carbonate producers, are regions with high rates of carbonate destruction (e.g. Powell et al., Reference Powell, Staff, Callender, Ashton-Alcox, Brett, Parsons-Hubbard, Walker and Raymond2011). That being so, and inasmuch as the oyster lacks the clever adaptation of the coral of protecting its skeleton during life, the oyster must deal with the taphonomic challenge by other means.
Oysters are unusual in several other ways. They are the only protandrous hermaphrodites among the major reef builders; protandry minimizes Allee effects, but imposes constraints leading to the maintenance of appropriate sex ratios (Powell et al., Reference Powell, Morson, Ashton-Alcox and Kim2013). Oysters have an anisodiametric growth form. Between-local-population variations in growth form may originate from location, oyster density, edaphic constraints and other processes (Kent, Reference Kent1998), but shape has not been predictably associated with any one or several biological and environmental drivers.
Here, we examine the oyster's approach to allometry and argue that this is an adaptation to the necessities imposed by the continuing requirement of producing shell carbonate to offset the vicissitudes of taphonomy. The allometric equation relating a linear dimension such as length L to an energy determinant such as biomass B, B = aLb , is a fundamental component of growth and metabolic energetics (Lundberg & Persson, Reference Lundberg and Persson1993; Hochachka et al., Reference Hochachka, Darveau, Andrews and Suarez2003; Brown et al., Reference Brown, Gillooly, Allen, Savage and West2004; Rossetto et al., Reference Rossetto, de Leo, Bevacqua and Micheli2012). A range of population models, both theoretical (Brown et al., Reference Brown, Marquet and Taper1993; Lika & Nisbet, Reference Lika and Nisbet2000; Gillooly et al., Reference Gillooly, Brown, West, Savage and Charnov2001) and species specific (e.g. Ren & Ross, Reference Ren and Ross2001, Reference Ren and Ross2005; van der Veer et al., Reference van der Veer, Cardoso and van der Meer2006), have been derived based on formulations of this type, as most physiological processes can be specified with an equation of this form. For the physiological process in question, namely the relationship between biomass and size as expressed by length, the scaling exponent b is relatively stable in bivalve molluscs, typically taking on a value near 3 (Powell & Stanton, Reference Powell and Stanton1985); that is, biomass typically scales as the cube of the length. A few species, scallops being a good example (MacDonald & Thompson, Reference MacDonald and Thompson1985), routinely fall below this value by a few tenths, but the relationship remains relatively stable between locations and populations. Here, we will address the degree to which oysters conform to this expectation and evaluate the stability in the allometric relationship temporally and at the local and geographic scale. We will argue that the allometric relationship is remarkably variable in oysters and that this is in part a result of anisodiametric growth. We will further argue, however, that biomass routinely scales nearer the square of the length rather than the cube and that this is a constraint imposed by the exigency of carbonate production for reef maintenance and accretion in the face of high rates of taphonomic degradation.
METHODS
Datasets
We analyse four datasets. (1) The Delaware Bay oyster stock survey carried out for the New Jersey oyster beds has measured length and dry tissue weight of oysters from each of 20 oyster beds yearly, in late October, since 1990. Details of survey design are provided by Powell et al. (Reference Powell, Ashton-Alcox, Kraeuter, Ford and Bushek2008, Reference Powell, Klinck, Ashton-Alcox and Kraeuter2009). Gay & O'Donnell (Reference Gay and O'Donnell2009) provide information on the salinity structure of the bay. The Delaware Bay dataset provides an independent estimate of the allometric parameters for each year for each bed obtained from 50 individuals selected from four different locations per bed; the individuals chosen to fairly represent the size range represented in the samples. Sample collection took place in October of each year. All beds are subtidal. The methodology has been invariant over the time series. For some analyses, we combine beds into four assessment regions based on variations in natural mortality rate and growth (see Figure 1 in Powell et al., Reference Powell, Ashton-Alcox, Kraeuter, Ford and Bushek2008; see also Kraeuter et al., Reference Kraeuter, Ford and Cummings2007; Bushek et al., Reference Bushek, Ford and Burt2012), hereafter termed, in order of their placement in the salinity gradient from downestuary to upestuary, the high-mortality region, Shell Rock, the medium-mortality region and the low-mortality region. The mortality reference primarily appertains to a gradient in mortality imposed by diseases that target adult animals (Haskin & Ford, Reference Haskin and Ford1982; Bushek et al., Reference Bushek, Ford and Burt2012). (2) The Virginia Institute of Marine Science has carried out a yearly stock survey for the public oyster grounds since 1993 using hydraulic patent tongs (Mann et al., Reference Mann, Southworth, Harding and Wesson2004). This analysis used data from 25 individuals representing the size range present in the samples from each of 19 oyster grounds covering the range of the resource in the Virginia portion of the Chesapeake Bay for the period 2010–2012. Sample collection took place in October and November. All bars are subtidal. Mann et al. (Reference Mann, Southworth, Harding and Wesson2009b) and Southworth et al. (Reference Southworth, Harding, Wesson and Mann2010) provide details on sampling protocol. (3) An extensive survey of Galveston Bay oyster beds was carried out in 1992 to provide data supporting the analyses of Klinck et al. (Reference Klinck, Hofmann, Powell and Dekshenieks2002), Powell et al. (Reference Powell, Klinck, Hofmann and McManus2003) and Dekshenieks et al. (Reference Dekshenieks, Hofmann, Klinck and Powell2000). Sample collection took place in April and May. All collections were from subtidal reefs or, in a few cases, subtidal portions of emergent reefs. Sufficient oysters, 40 in nearly all cases and never less than 20, were chosen representing the size range collected. The dataset analysed covered 42 beds: locations are provided by Powell et al. (Reference Powell, Klinck, Hofmann, Wilson-Ormond and Ellis1995a). (4) The NOAA Status and Trends ‘Mussel Watch’ Program sampled all major coastal bodies of water yearly from 1986 to 2010. Data on length and wet weight were available for 1995–2010 for each of the oyster-bearing estuaries and lagoons from Delaware Bay, New Jersey to Laguna Madre, Texas. Unlike the other datasets analysed, the Mussel Watch sampling protocol targeted large animals, was limited numerically at each sampling time, and, for some sites, sampling occurred biennially over part of the time period. As a consequence, spatial analyses were conducted by summing all sampling sites within 56 ‘bays’ as defined by Kim & Powell (Reference Kim and Powell2006) and Kim et al. (Reference Kim, Powell, Wade and Presley2008). A further increase in data quantity and a further enhancement in the sizes measured were obtained by lumping all sampling years for each of these bays. Of the 56 bays, analyses were based on measurements from <60 animals in only 17 cases, <50 animals in only 10 cases, and none less than 39. Details of site locations are provided in Lauenstein et al. (Reference Lauenstein, Cantillo, Kokkinakis, Frew, Jobling and Fay1997). These sites covered a wide range of reef types from emergent to subtidal and from fringing reefs to open-bay reefs. Multiple sites representing a range of reef types were occupied in most bays. Because of data restrictions at the level of site, however, reef type was not included as a main effect in statistical analysis. Sample collection took place in December–January of each year. McDonald et al. (Reference McDonald, Frank, Ramirez, Wang and Brooks2006) provide analytical methods. Kimbrough et al. (Reference Kimbrough, Johnson, Lauenstein, Christensen and Apeti2008) review the Mussel Watch Program. For comparability between bays, we excluded all oysters <5 cm in length from the analyses presented herein.

Fig. 1. Average values of the scaling exponent b for the allometric equation relating biomass B to length L (B = aLb ) for 20 oyster beds in Delaware Bay sampled from 1991 to 2012. The straight line represents the median of these measurements: 2.03.
Statistical analyses
We exclude from analysis the parameter a in the allometric equation because some of our datasets use dry tissue weight DW and some use wet tissue weight WW – these two measures typically differ by a factor of 5 (e.g. Yoo & Yoo, Reference Yoo and Yoo1973; Choi et al., Reference Choi, Lewis, Powell and Ray1993; Kang et al., Reference Kang, Choi, Bulgakov, Kim and Kim2003; Lejart et al., Reference Lejart, Clavier, Chauvaud and Hily2012) – and because condition index varies by a factor of 1.3–2 in oysters (Hopkins et al., Reference Hopkins, Mackin and Menzel1954; Haven, Reference Haven1960; Choi et al., Reference Choi, Lewis, Powell and Ray1993; Páez-Osuna et al., Reference Páez-Osuna, Frías-Espericueta and Osuna-López1995) over the course of the gametogenic cycle. Given that c = WW/DW or any other standardization of biomass at a given length, we note that B/c = aLb and thus B = (ca)Lb ; that is, a change in condition or method of measurement does not affect the scaling exponent as long as it occurs equivalently over the size range. This would be the case for the dry-weight wet-weight conversion, but may not be true for a change in condition. Consequently, we assume in further analysis that the value of the scaling exponent is independent of variation in the method or timing of measurement of biomass, with the exception of caveats and supporting analyses provided subsequently in the Results and Discussion (Variations in Scaling Exponents: Conjectures on the How of It) sections concerning condition.
We are aware of the broader discussion in the literature with respect to line-fitting methods for power functions (Ricker, Reference Ricker1973; Troutman & Williams, Reference Troutman, Williams and Size1987; LaBarbera, Reference LaBarbera1989; Warton et al., Reference Warton, Wright, Falster and Westoby2006; Packard, Reference Packard2011, Reference Packard2013). We retain the standard OLS method in this study and report additional analyses in the same format because essentially all such calculations in the literature conform to the latter as their intent is to predict weight from length, as length is invariably less variable than weight (see Ricker, Reference Ricker1975), and as a primary objective of this study is to compare across taxa. We note that Ricker (Reference Ricker1975) provides formulae to convert to the alternative geometric mean regression discussed by Ricker (Reference Ricker1973) using regression coefficients that we summarize where appropriate in sections that follow.
Statistical comparisons used ANOVA, with interaction terms where appropriate. Results were consistent regardless of the use of parametric or non-parametric tests; thus, we present only the parametric results. A posteriori investigation of ANOVA results used least squares means tests with α = 0.05. Correlation analysis used Spearman's Rank tests.
RESULTS
Delaware Bay
We compared scaling exponents b for the relationship between biomass and shell length (B = aLb ) between the four regions and across the 22 years. Regression coefficients ≥0.6 occurred in over 80% of the cases (Table 1). In general, the few lower regression coefficients were observed to co-occur with lower b values. The 11 cases where low regression coefficients (<0.45) and low b values (<1.3) co-occurred are not randomly distributed. All but two fall into 3 of the 22 years, 1990, 1997 and 2004, and these are represented by cases from the majority of bay regions in those years; that is, they are not associated with any particular bay region. In these 3 years, the relationship between length and weight is more variable for some beds, hence the lower regression coefficients, and is also associated with lower b values.
Table 1. Distribution of regression coefficients for the Delaware Bay dataset. Columns identify regression coefficients greater or equal to the given number and less than the number in the next column to the right.

Region, year and the interaction term (region × year) were significant (P < 0.0001). Bay-wide values of b varied between 1.7 and 2.4 over the 22 years and averaged higher in most years from 1998 to 2003 and lower in most years from 2007 to 2011 (Figure 1). A one-sample runs test was not significant (α = 0.05), so the apparent autocorrelation in the deviations is not greater than expected by chance. The 22-year median is 2.03. Thus, on the average, biomass scales as the square of the length for oyster populations in Delaware Bay.
An a posteriori least squares means test shows that the two downestuary regions, high mortality and Shell Rock, differed significantly from the two upestuary regions, medium mortality and low mortality. Median values for the scaling exponent b are, respectively, 2.14, 2.08, 1.92 and 1.87. This differential does not originate from increased variability in the datasets, as b values follow this trend regardless of the value of the regression coefficients (Table 1). Biomass scales somewhat above the square of the length downestuary and somewhat below it upestuary. The differential between the two groups of regions is maintained for most of the time series (Figure 2). However, the values of b are much more similar in the first and last 5 years of the time series than in the middle decennial, during which the upestuary pair of regions diverged from the downestuary pair significantly. Median values for the scaling exponent b during the middle decennial are, respectively from the high-mortality downestuary region to the low-mortality upestuary region: 2.23, 2.18, 1.97 and 1.79.

Fig. 2. Time series of values of the scaling exponent b for the allometric equation relating biomass B to length L (B = aLb ) for the four regions defined for the Delaware Bay survey dataset (see Figure 1 in Powell et al., Reference Powell, Ashton-Alcox, Kraeuter, Ford and Bushek2008 and discussion thereto).
A Spearman's correlation reveals that the b values for the high-mortality and medium-mortality regions are correlated over the 22-year time series (P = 0.0054; ρ = 0.57). In contrast, the time series of b values for the low-mortality region is not correlated with either of the former two regions [(high mortality: P = 0.71; ρ = 0.08) (medium mortality: P = 0.09; ρ = −0.18)]. The differential trajectories are delineated in Figure 2, which shows the b value for the low-mortality bed region persistently dropping below the others for the middle decennial of the time series.
One origin of the change in value for a length-based scaling exponent would be a change in growth form resulting in a change in the relationship of shell length and width. The Delaware Bay dataset records both shell length and width over the analysed time series. The median value of the scaling exponent b for the allometric equation W = aLb , where W is width, is 0.708. By region, the values are: high mortality, 0.732; Shell Rock, 0.709; medium mortality, 0.678; low mortality, 0.647. Thus, Delaware Bay oysters become progressively narrower for their length upestuary. ANOVA reveals that both year and region vary significantly in this time series, as does the interaction term (all P < 0.0001). An a posteriori least squares means test shows that the scaling exponent for the high-mortality bed group is significantly higher than the scaling exponent for the low-mortality and medium-mortality beds (both P < 0.0001). These latter two also differ significantly (P = 0.001), with the value for the medium-mortality region being higher. This upestuary gradient can, in part, explain the upestuary trend in the relationship between biomass and length.
Perusal of the time series of b values for the relationship of width and length for the four regions (Figure 3) shows that the difference between upestuary and downestuary regions is consistent over the first 15 years of the time series, but that, in the last 7 years, the deviation has lessened for the high-mortality and medium-mortality regions. An elucidative observation is the decline in the value of the scaling exponent for the high-mortality region relative to earlier years. The period in question has been a period of active transplanting from upestuary to downestuary (see Powell et al., Reference Powell, Klinck, Hofmann and Ford1997; Kraeuter et al., Reference Kraeuter, Ford and Canzonier2003; Ashton-Alcox et al., Reference Ashton-Alcox, Powell, Hearon, Tomlin and Babb2013, for the rationale) and active shell planting to enhance recruitment (see Abbe, Reference Abbe1988; Gunter, Reference Gunter1979; HSRL, 2012, for the rationale) which may have effected some of this change. However, Shell Rock has received a disproportionately greater impact from these two activities over the same time period (our unpublished data), and the quantity of oysters transplanted has not exceeded 1% of the stock on the receiving beds, so that the trajectories for the high-mortality and medium-mortality regions are likely not a function of stock manipulation during the last 7 years of the time series. Mortality rates have been relatively similar on the medium-mortality beds and the downestuary regions over this same time frame (our unpublished data), however, which suggests that one possible reason for increased similarity in the b value is a lessoning of the differential influence of salinity on population dynamics.

Fig. 3. Time series of values of the scaling exponent b for the allometric equation relating shell width W to length L (W = aLb ) for the four regions defined for the Delaware Bay survey dataset (see Figure 1 in Powell et al., Reference Powell, Ashton-Alcox, Kraeuter, Ford and Bushek2008 and discussion thereto).
An ANCOVA with the scaling exponent for the biomass-to-length relationship as the dependent variable and the scaling exponent for the relationship between length and width as a covariate reveals a significant interaction between the two scaling exponents, for width and for biomass, as expected (P < 0.0001), but does not account for the upestuary decline in the biomass-based b value earlier identified. Spearman's correlations reveal that both the scaling exponents for biomass with length and width with length are significantly correlated for the high-mortality region (P = 0.028, ρ = 0.47), barely so for Shell Rock (P = 0.049, ρ = 0.42), but not significant for the two upestuary regions [(medium mortality: P = 0.30; ρ = 0.23) (low mortality: P = 0.11; ρ = 0.35)]. Thus, trends in the relationship between biomass and length are explained partly by variations in shell width downestuary, but variations in shell width offer only limited explanatory value upestuary.
Virginia Chesapeake
The median value of the scaling exponent for Delaware Bay is 2.03, ranging between 1.7 and 2.4 for the bay as a whole. To evaluate the distinctiveness of this result, we examined data from the Virginia portion of the Chesapeake Bay from 2010–2012. The median value for the scaling exponent for 19 locations (Figure 4) is 2.04, effectively identical to Delaware Bay. The range is 1.61–2.75, a value that slightly exceeds that of Delaware Bay, but which encompasses the Delaware Bay range of values in their entirety. The yearly averages were 2.45 (2010), 2.12 (2011) and 2.12 (2012). The lowest regression coefficient among the 19 areas is 0.59, with all but four of the 53 datasets exceeding 0.78. Once again, the few low regression coefficients are not randomly distributed, being spatially dispersed, but temporally juxtaposed, as three of the four occur in 2012. Thus, the data do not suggest any substantive difference between the oyster populations in the two bays; rather, the allometric relationships are remarkably similar.

Fig. 4. Average values of the scaling exponent b for the allometric equation relating biomass B to length L (B = aLb ) for selected reefs in the Virginia portion of Chesapeake Bay for the period 2010–2012.
Galveston Bay
The Galveston Bay dataset constitutes a single measurement in 1992 from 42 reefs covering the range of reefs in Galveston Bay (see Powell et al., Reference Powell, Klinck, Hofmann, Wilson-Ormond and Ellis1995a). The scaling exponent relating biomass to length varies from 2.0 to 3.4 among these 42 reefs (Figure 5). The median is 2.6, considerably higher than the median of 2.0 for Delaware Bay and Chesapeake Bay. Of the 42 datasets, no regression coefficient fell below 0.8.

Fig. 5. Values of the scaling exponent b for the allometric equation relating biomass B to length L (B = aLb ) for 42 oyster reefs in Galveston Bay, Texas. The dotted line identifies the median value: 2.61.
The two sets of b values, for Delaware Bay (20 per year × 22 years) and Galveston Bay (42 in 1 year) are significantly different (P < 0.0001). However, because the Delaware Bay dataset covers 22 years, we also focused on the year with the highest median b value, 2002, with a median of 2.34. The values for b for the 20 sampled oyster beds in Delaware Bay range from 2.02 to 2.93 in the 2002 dataset. The maximal value of 2.93, for Bennies Bed (see Figure 1 in Powell et al., Reference Powell, Ashton-Alcox, Kraeuter, Ford and Bushek2008), is the highest number recorded for any bed for any year in the Delaware Bay time series. Notwithstanding the choice of the most favourable year from the Delaware Bay time series for comparison with the Galveston Bay dataset, the values for Galveston Bay remain significantly higher than the values for Delaware Bay (P = 0.0004).
Perusal of the order of the reefs by b value in Figure 5 does not reveal any obvious geographic trend (see location map in Powell et al., Reference Powell, Klinck, Hofmann, Wilson-Ormond and Ellis1995a). Values above 3 occur for reefs that are upestuary and downestuary and for reefs on the western side and the eastern side of the bay. The bay is hydrodynamically distinctive in the eastern and western regions (Powell et al., Reference Powell, Klinck, Hofmann and McManus2003). Values below 2.5 similarly occur for reefs that are upestuary and downestuary, and on the western side and eastern side of the bay. The salinity structure in Galveston Bay is pointedly more complex than Delaware Bay (see Powell et al., Reference Powell, Klinck, Hofmann, Wilson-Ormond and Ellis1995a and Klinck et al., Reference Klinck, Hofmann, Powell and Dekshenieks2002 for references), so that a simple upestuary/downestuary gradient as seen in Delaware Bay not surprisingly is not observed.
Status and Trends Mussel Watch dataset
Fifty-six ‘bays’ were sampled as defined by Kim & Powell (Reference Kim and Powell2006) and Kim et al. (Reference Kim, Powell, Wade and Presley2008) (see also Kim & Powell, Reference Kim and Powell2007). The value of the scaling exponent covers an enormously wide range: from 0.57 in the Matanzas River, Florida to 3.03 from sites in Florida Bay. The median is 2.09, a value very similar to the median for Delaware Bay, but the range is much larger (Figure 6). Of the 56 datasets, only eight had a regression coefficient below 0.5 and more than half exceeded 0.7 (Table 2). Once again, lower b values were associated on the average with lower regression coefficients; however, restricting the analysis to datasets with regression coefficients exceeding 0.6 did not change the median b value from a median of 2.09.

Fig. 6. Values of the scaling exponent b for the allometric equation relating biomass B to length L (B = aLb ) for 56 bays in the NOAA Status and Trends Mussel Watch Program. The dashed line identifies the median value: 2.09. The dotted line identifies the median of 42 reefs in Galveston Bay (Figure 5). Note that the Mussel Watch value for Galveston Bay falls nearly on the dotted line.
Table 2. Distribution of regression coefficients for the Mussel Watch dataset. Columns identify regression coefficients greater or equal to the given number and less than the number in the next column to the right.

The Mussel Watch value for Galveston Bay, 2.66, is effectively identical to the value obtained from the 1992 Galveston Bay time series. Many Mussel Watch ‘bays’ contain multiple sampling sites (e.g. Lauenstein et al., Reference Lauenstein, Cantillo, Kokkinakis, Frew, Jobling and Fay1997), so that the range of values depicted in Figure 6, for the most part, comes from multiple datasets covering a range of conditions within each bay. The Mussel Watch value for Galveston Bay is a good example as it falls near the middle of the range of values shown in Figure 5. The anticipated decline in the value of the regression coefficients from combining collections from a variety of sites within the bays materializes modestly, if at all.
With two exceptions, the bays with b values above 2.4 come from the east coast of Florida or the Gulf of Mexico (Figure 6). The two exceptions are Delaware Bay. The Delaware Bay upestuary site (Figure 6) comes from a reef near Kelly Island on the Delaware side of the bay and is not in the afore-analysed Delaware Bay dataset which comes exclusively from New Jersey waters. The Delaware Bay midestuary site is from Bennies Bed (see Figure 1 in Powell et al., Reference Powell, Ashton-Alcox, Kraeuter, Ford and Bushek2008), that also has the notable property of providing the highest b values of any bed in the Delaware Bay dataset. Moreover, the Mussel Watch dataset for this ‘bay’ is heavily weighted towards the middle of the time series when the b values were high even for Bennies (e.g. 2002; see earlier discussion and Figure 7). Thus, the Mussel Watch data for the Delaware Bay midestuary site is demonstrably an outlier, representing the normal condition neither spatially nor temporally for this region of Delaware Bay (Figure 2). Accordingly, the Mussel Watch values should not be considered blithely as representative for the entire body of water identified.
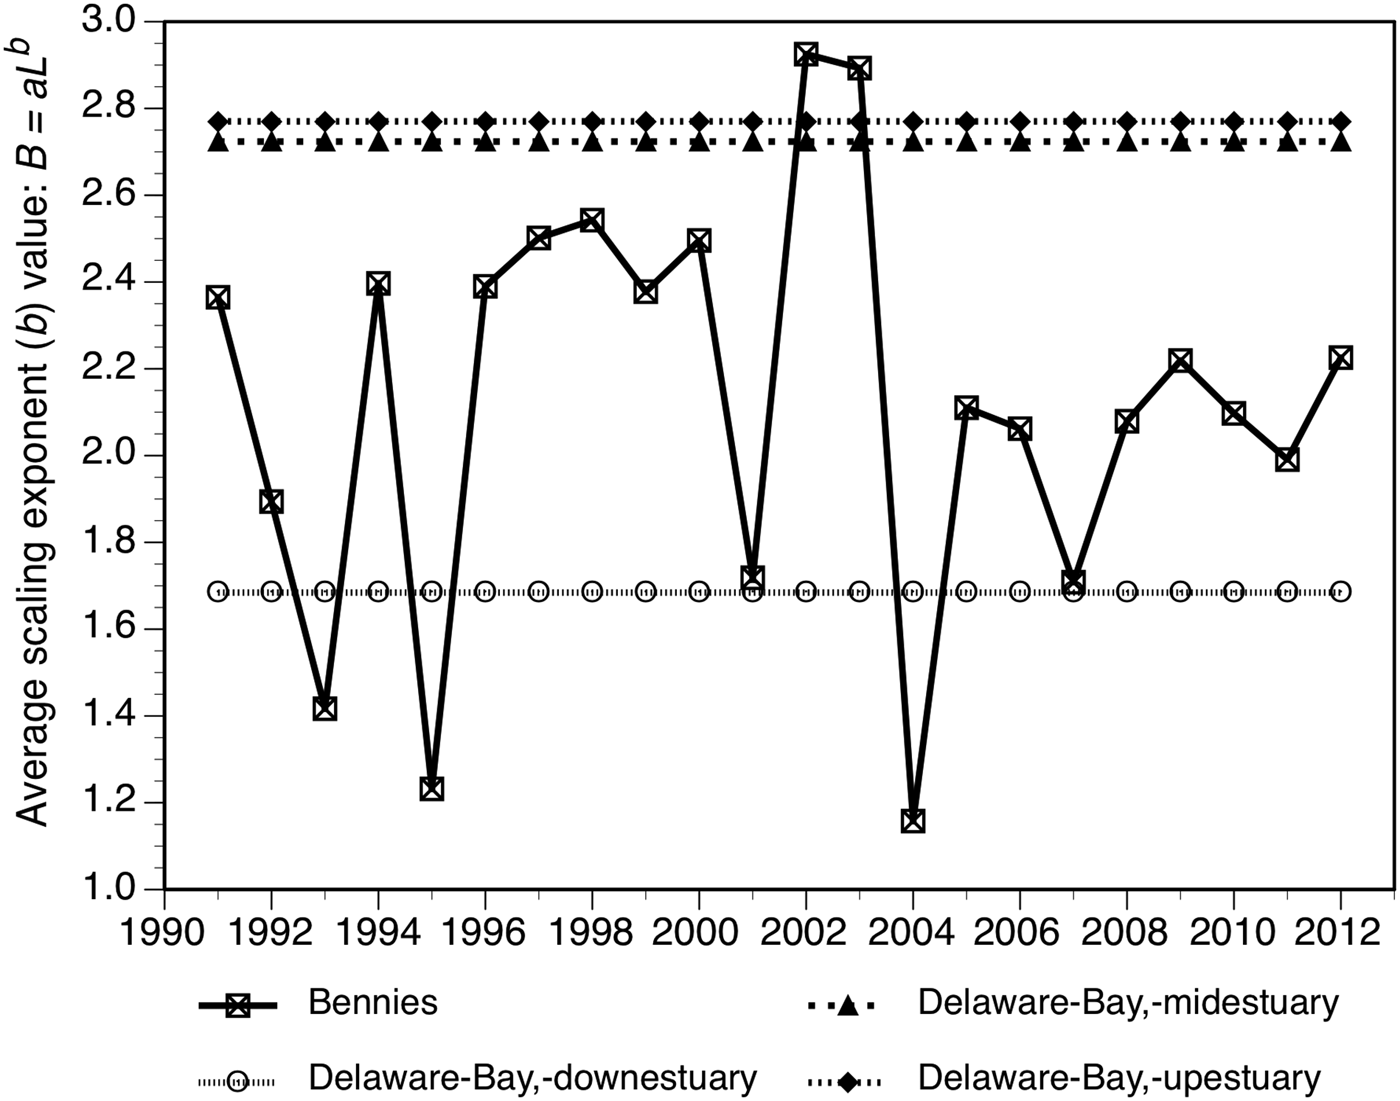
Fig. 7. Time series for Bennies Bed in Delaware Bay relative to the Mussel Watch average value from the upper, middle and lower estuary stations.
The bays with the eight lowest b values (all ≤ 1.58) also come from the south-east coast or the Gulf of Mexico, with the exception of the Port Jefferson site on Long Island. Thus, the distribution of b values among ‘bays’ in the Mussel Watch dataset is not obviously a function of geography. A latitudinal trend, for example, is not observed (Figure 8). Of interest, however, is the biased origin of the extremes, high and low; the bias being towards southern climes and disproportionately towards Gulf of Mexico sites.

Fig. 8. Values of the scaling exponent b for the allometric equation relating biomass B to length L (B = aLb ) for 56 bays in the NOAA Status and Trends Mussel Watch Program, approximately ordered from north to south on the east coast and thence from east to west along the Gulf of Mexico coast.
Also of interest, in this dataset, the relationship between the scalar parameter a and the scaling exponent b can be described by a = 0.7 b −2.88. That is, as the scaling exponent b increases, the scalar a declines by nearly the cube root (Figure 9). In this way, the weight of a 76-mm animal ranges across a factor of less than 4 rather than a factor of over 20. Presumably, much of this relationship is due to the fact that populations with higher scaling exponents are characterized by narrower shells so that the weight at length is proportionately reduced.

Fig. 9. The relationship between the scaling exponent b and the scalar a in the allometric equation relating biomass B to length L (B = aLb ) for 56 bays in the NOAA Status and Trends Mussel Watch Program.
Yearly collections at Mussel Watch sites are too meagre to compare bays between years. However, larger blocks of time can be compared. Values of the scaling exponent varied substantially between the 1994–2000 time period and the 2001–2010 time period for some bays. A general trend was not apparent, however, with b values higher in the later time period about as often as they were lower (Wilcoxon signed rank test, P > 0.10). We also divided the Mussel Watch bays into seven groups, east coast north of Cape Hatteras, Cape Hatteras to Cape Canaveral, east coast south of Cape Canaveral, and the Gulf of Mexico divided at Tampa Bay, Florida, the Mississippi River, and Aransas Bay, Texas. These are known provincial boundaries (Hutchins, Reference Hutchins1947; Hall, Reference Hall1964; Cerame-Vivas & Gray, Reference Cerame-Vivas and Gray1966; Wilson et al., Reference Wilson, Powell, Wade, Taylor, Presley and Brooks1992; Kim & Powell, Reference Kim and Powell1998). The value of the scaling exponent b did not vary significantly between these seven regions (ANOVA, P > 0.10): respectively the values were 2.0, 1.7, 1.9, 2.2, 1.8, 2.1 and 2.0.
DISCUSSION
Variation in scaling exponents in the Bivalvia: overview
The average value of the scaling exponent relating biomass to shell length for oysters in Delaware Bay is about 2. Oysters from the Virginia portion of the Chesapeake Bay have essentially an identical relationship between biomass and length. For Galveston Bay, the value of b is distinctly higher, near 2.6. Over all Mussel Watch sites, the value is again near 2. Scaling exponents below 2.5 are unusual in bivalves. Golightly & Kosinski (Reference Golightly and Kosinski1981) suggested that biomass scaled as the cube of the length in bivalves. Powell & Stanton (Reference Powell and Stanton1985) reviewed a range of molluscan taxa, gastropod and bivalve, and found that the scaling exponent did not differ substantively from the value of 3 earlier recommended by Golightly & Kosinski (Reference Golightly and Kosinski1981). Perusal of a haphazardly gathered selection of reports of allometric relationships, not intended by any means to be a thorough review, reveals that values between 2.5 and 3 are commonplace and that values below 2.5 are exceedingly rare (Table 3, Figure 10). The exponent near 3 is consistent with the three-dimensional nature of a bivalve shell. The tendency for the exponent to be modestly below 3 is consistent with the tendency for shell thickness to be modestly less than width for a given length. Presumably, a scaling exponent near 3 is a useful adaptation for a bivalve in that it permits a near-maximal amount of biomass to be retained with a minimal investment in carbonate. Very little is known about the energetic cost of shell formation (e.g. Bernard, Reference Bernard1974; Palmer, Reference Palmer1983), including the soluble and insoluble matrices and the carbonate, however. Thus, metabolic efficiency may not be the primary driver; rather, as most bivalves are mobile for much of their lives, limiting shell weight as a function of biomass may be more important.

Fig. 10. Example values for scaling exponents b (B = aLb ) for a range of bivalves. All values for Tapes/Ruditapes/Venerupis philippinarum in Table 3 are conflated under Ruditapes. Data for crassostreids are listed at the bottom of the chart. Datasets analysed in this document are included immediately above these species; all refer to Crassostrea virginica. Data references are provided in Table 3.
Table 3. Examples of the values for the scaling exponent b in the allometric equation relating biomass to length (B = aL b) for bivalves.

The bivalve shape is likely required to approximate a prolate spheroid to permit effective burrowing (Alexander & Dietl, Reference Alexander and Dietl2005). The volume of a prolate spheroid can be expressed as axby where a is 4π/3 and x and y are the major and minor axes, respectively. Given that the minor axis can be described in terms of x, y = xc , and that c will be somewhat less than 1, bivalve volume will approximate axb+c where b + c is now somewhat less than 3. Thus, one might anticipate values of the scaling exponents relating biomass to shell length to be in the range typically observed. Further, one might not expect values exceeding 3 to commonly occur. The fact that values exceeding 3 are often observed (Table 3) suggests that a comprehensive analysis of the relationship of length, width and thickness amongst bivalve species might be illuminating (e.g. Novack-Gottshall, Reference Novack-Gottshall2008).
Regardless, the scaling exponent in oysters is unusually low, averaging near 2 rather than 3 (Figure 10). These animals are sagittally compressed relative to most other bivalves. Rarely does a scaling exponent reach 3 in these species. Most values fall between 1.5 and 2.5. Analysis of Mussel Watch data suggests that an overall average of 2.0 is reasonable for Crassostrea virginica. That is, a strong tendency exists for oyster biomass to scale as the square, rather than the cube, of the length. The trend is not limited just to C. virginica, but encompasses a range of crassostreids (Table 3).
Local temporal and spatial variations in scaling exponents
Comparison of datasets encompassing a range of geographic expanses suggests that large-scale and small-scale drivers of allometry are different. Within Delaware Bay, where the dataset is extensive and readily related to the salinity gradient, that gradient exerts an important effect on oyster allometry. Shells are longer for their meat weight at lower salinities. Year-to-year variability is non-trivial and these variations are not co-occurring over the salinity range. However, for most of the time series, the upestuary-downestuary differential is maintained. Variations in width relative to length explain some portion of the spatial and temporal variability. Why width varies relative to length; that is, why shape changes over time, is unclear. However, variations in the biomass-to-length relationship are not fully explained by variations in shell width with respect to length. This suggests that the degree of sagittal compression about the minor axis (width) varies over time or that shell thickness might be an important parameter as a thicker shell would result in a smaller mantle cavity volume for a given length. Unfortunately, data on shell thickness do not exist.
Regardless of the underlying reason for changes in oyster shape, time series trends for the scaling exponent relating biomass to length diverge significantly over the salinity gradient in Delaware Bay, with upestuary populations characterized by scaling exponents interannually less stable than populations downestuary. The decennial excursion observed in the middle portion of the time series in the scaling exponent for upestuary bed regions (Figure 2) is not obviously associated with long-term salinity trends. Nor do other noteworthy population trends obviously track this phenomenon. A significant shift in the size-frequency structure of the Delaware Bay population, in which the proportion of animals <56 mm dropped precipitously ~2000 and has remained low for the remainder of the decade (HSRL, 2012), is the single largest demographic shift in the Delaware Bay time series. This demographic shift occurs about midway in the aforesaid decennial excursion. Thus, other demographic trends do not coincide noticeably with the decennial excursion in the value of b. Presumably, variations in food supply may be consequential. Unfortunately, data on food supply are only available for the late 2000s (Powell et al., Reference Powell, Kreeger, Morson, Haidvogel, Wang, Thomas and Gius2012b), a time period when the values of the scaling exponents for the four bed regions adjoined along the salinity gradient were nearly identical throughout the bay. Perhaps by coincidence, Powell et al. (Reference Powell, Kreeger, Morson, Haidvogel, Wang, Thomas and Gius2012b) also did not observe an upestuary-downestuary trend in food supply over that period.
Soniat et al. (Reference Soniat, Hofmann, Klinck and Powell2009) and Powell et al. (Reference Powell, Ashton-Alcox, Kraeuter, Ford and Bushek2008) identified an 8-year cycle in the population dynamics of Delaware Bay oysters that they inferred to be the imprint of the North Atlantic Oscillation (Hurrell et al., Reference Hurrell, Kushnir, Hersen and Visbeck2003). Bushek et al. (Reference Bushek, Ford and Burt2012) found evidence of a similar 7-year cycle. The NAO cycle is coincident with the aforementioned shifts in population dynamics, including trends in abundance and mortality (Soniat et al., Reference Soniat, Hofmann, Klinck and Powell2009). Kraeuter et al. (Reference Kraeuter, Ford and Cummings2007) estimated that oysters live 7+ years on the upestuary oyster beds. Any change in the underlying physiological processes ultimately defining the scaling exponent for a cohort would perforce impart a 7+-year signal in the population living in the low-mortality region. This time frame is consistent with the observed decennial excursion and offers a constraint on interpretation of causation as the outcome of physiological drivers, namely the biomass at length for the largest animals in the cohort, may remain some years after the physiological drivers no longer exist and the population may relax into another phase only slowly as these earlier cohorts gradually decline in their contribution to the adult population. Perhaps for this reason, failure to identify a coincident signal in other demographic and environmental parameters should not be surprising.
The Galveston Bay dataset imposes a degree of caution in the over-interpretation of the trends in Delaware Bay. The dispersion of b values among the reefs sampled does not obviously follow trends in salinity. Nor does the influence of channelization, a dominant factor in Galveston Bay hydrodynamics (Klinck et al., Reference Klinck, Hofmann, Powell and Dekshenieks2002), merit close scrutiny as high and low b values occur on both the eastern and western portions of the bay bisected by the main ship channel. The Mussel Watch dataset likewise suggests caution in over-interpreting the simple influence of salinity in determining the allometry in C. virginica, as a low-salinity bay such as Vermilion Bay has a b value much higher than a high salinity site such as the Laguna Madre, while another low salinity bay, Sabine Lake, has a still lower b value.
Variations in scaling exponents: conjectures on the how of it
The range of scaling exponents revealed by Mussel Watch data is exceedingly large. No other bivalve taxon reported demonstrates a range even close to the range revealed for C. virginica. The Mussel Watch dataset contains six cases where the exponent is below 1.5; in some cases below 1 (e.g., Figure 6). Feasible explanations include sampling of multiple cohorts over time and size-dependent trends in condition. Additionally, the Mussel Watch dataset was compiled over a long period of years, so that many cohorts contributed to it. The Delaware Bay case history suggests that one should anticipate that these sampled populations varied over that time in the value of the scaling exponent. A combination of cohorts growing under a range of conditions might result occasionally in scaling exponents averaged over the time series that take on extreme values. Unfortunately, the Mussel Watch dataset does not provide enough measurements in each year to subdivide the dataset into more than a few temporal segments.
Another possible explanation for the wide range in b values is a size-dependent trend in condition (e.g. Marsden, Reference Marsden2000). The development of an allometric relationship is premised on the tight linkage between a linear measurement and biomass. In bivalves, meat weight varies seasonally with the gametogenic cycle (Hopkins et al., Reference Hopkins, Mackin and Menzel1954; Soniat & Ray, Reference Soniat and Ray1985; Choi et al., Reference Choi, Lewis, Powell and Ray1993). In addition, meat weight may vary with other stressors including parasites, epibionts and limited food supply (Engle & Chapman, Reference Engle and Chapman1953; Mercado-Silva, Reference Mercado-Silva2005; Wright & Hetzel, Reference Wright and Hetzel1985; Rheault & Rice, Reference Rheault and Rice1996), all of which may influence larger animals differentially from smaller ones. In particular, the size of most iteroparous bivalves, being species of indeterminate growth, is determined by the interaction of the differential scaling of ingestion and respiration (+reproduction) with food supply (e.g. Powell et al., Reference Powell, Song, Ellis and Wilson-Ormond1995b; Hofmann et al., Reference Hofmann, Klinck, Kraeuter, Powell, Grizzle, Buckner and Bricelj2006; Munroe et al., Reference Munroe, Powell, Mann, Klinck and Hofmann2013). As a consequence, larger animals have lower scopes for growth. One anticipates that larger animals will receive a proportionately greater challenge by low food supply and this challenge will be manifested by a disproportionately lower condition index. While such trends are not well reported (see for example Marzec et al., Reference Marzec, Kim and Powell2010), their occurrence is assured by the basic constraints of bivalve physiology (e.g. Munroe et al., Reference Munroe, Powell, Mann, Klinck and Hofmann2013). Thus, low scaling exponents relating biomass to shell length may result from the sampling of populations aperiodically challenged by low food supply.
The tendency in all datasets for lower regression coefficients to be associated with lower b values adds additional credence to the condition hypothesis. Lower condition disproportionately directed at larger animals as anticipated by their physiological constraints would add variance to the higher end of the length versus weight curve biased towards lower weights. This would simultaneously lower the b value and also lower the regression coefficient, which is observed. The peculiarity that datasets with simultaneously low b values and regression coefficients are temporally restricted to a few years but spatially dispersed throughout Delaware Bay would suggest a regional, rather than a local genesis. The tendency in the Mussel Watch dataset for cases with low regression coefficients to be in southern climes is also suggestive, as winter temperatures are not low enough for these animals to cease filtering at these latitudes, but food supply is low (e.g. Soniat et al., Reference Soniat, Ray and Jeffrey1984, Reference Soniat, Powell, Hofmann and Klinck1998; Powell et al., Reference Powell, Kreeger, Morson, Haidvogel, Wang, Thomas and Gius2012b), so that weight loss over winter in the larger size classes is a common occurrence (see also Hofmann et al., Reference Hofmann, Powell, Klinck and Wilson1992; Soniat et al., Reference Soniat, Powell, Hofmann and Klinck1998; Honkoop & Beukema, Reference Honkoop and Beukema1997; Zarnoch & Schreibman, Reference Zarnoch and Schreibman2008). Mussel Watch samples were always taken in mid-winter.
Some Mussel Watch populations have scaling exponents exceeding 3 (Figure 6). Either these relationships are the consequence of sampling multiple cohorts over time growing at different rates or the anterior-posterior dimension as measured by Mussel Watch is not the longest axis. The latter will rarely be true, but oyster growth forms are sufficiently malleable that such may occasionally occur. In summary, the Mussel Watch dataset is a data-sparse dataset characterized by a biased size-frequency distribution, so that too much reliance on any particular bay value is discouraged. Nonetheless, taken in aggregate, these data bespeak a high degree of intraspecific variation in allometry in C. virginica (Figure 10).
Low scaling exponents in oysters: postulations on the why of it
The salient conundrum is the evolutionary basis for a scaling exponent near 2. It is unlikely that mobile bivalves could achieve such an outcome without extreme compromises in shape. Such an outcome, however, is feasible for the sessile oyster. Even so, sessility is an insufficient explanation as a number of successful sessile bivalves have very typical values near 3 for the scaling exponent relating biomass to length (e.g. Pinna bicolor, Anomia ephippium, the Mytilidae, Table 3, Figure 10). Even so, for a reef builder, a lower scaling exponent might be advantageous, as this growth form increases the shell size relative to the animal within. Put another way, such animals produce more shell for a given biomass.
Reef formation is a challenge for any reef builder. Carbonate is not a permanent resource (Conand et al., Reference Conand, Chabonet, Cuet and Letourneur1997; Boucher et al., Reference Boucher, Clavier, Hily and Gattuso1998). Taphonomic processes, both chemical (e.g. dissolution – Callender et al., Reference Callender, Powell and Staff1994; Kleeman, Reference Kleeman1996; Waldbusser et al., Reference Waldbusser, Steenson and Green2011) and biological (e.g. bioerosion – Wisshak et al., Reference Wisshak, Gektidis, Freiwald and Lundälv2005; Zuschin & Baal, Reference Zuschin and Baal2007; Carver et al., Reference Carver, Thériault and Malley2010), result in substantial carbonate losses yearly in many death assemblages (Powell et al., Reference Powell, Staff, Davies and Callender1989, Reference Powell, Kraeuter and Ashton-Alcox2006; Wright & Burgess, Reference Wright and Burgess2005; Powell & Klinck, Reference Powell and Klinck2007; Mann et al., Reference Mann, Harding and Southworth2009a). To maintain a reef framework, carbonate production must at least balance carbonate loss (Harding et al., Reference Harding, Mann, Southworth and Wesson2010, Powell et al., Reference Powell, Klinck, Ashton-Alcox, Hofmann and Morson2012a). Carbonate loss is a function of exposure, pH and crystal polymorph, all else being equal (Davies et al., Reference Davies, Powell and Stanton1989; Hover et al., Reference Hover, Walter and Peacor2001; Kosnik et al., Reference Kosnik, Hua, Kaufman and Wüst2009; Waldbusser et al., Reference Waldbusser, Steenson and Green2011; Powell et al., Reference Powell, Staff, Callender, Ashton-Alcox, Brett, Parsons-Hubbard, Walker and Raymond2011, Reference Powell, Klinck, Ashton-Alcox, Hofmann and Morson2012a). Some reef builders limit exposure by draping a layer of organic matter over the carbonate. Corals are a good example. Bivalves accomplish this with periostracum, but reef-building bivalves, namely oysters, have not invested in that option. Oyster periostracum is exceedingly thin, and readily worn away (Harper, Reference Harper1997). Almost certainly, dispensing with periostracum is a response to the role of periostracum in limiting biont attachment (Bottjer & Carter, Reference Bottjer and Carter1980; Mao Che et al., Reference Mao Che, Alsumard, Boury-Esnault, Payri, Golubic and Bézac1996; Kaehler, Reference Kaehler1999) and oysters, though they might do better without many of the biont irritants of the marine world (Warburton, Reference Warburton1958; Guida, Reference Guida1976; Grabowski et al., Reference Grabowski, Peterson, Powers, Gaskill and Summerson2004; Barnes et al., Reference Barnes, Luckenbach and Kingsley-Smith2010), do need one biont badly, small oysters (spat). In addition, production of clean shell leading to the attachment of spat supports another adaptation to sessile reef-building life, the adoption of protandry to minimize Allee effects. It furthermore supports the need to amalgamate carbonate into a robust structure by means of clump formation (Powell et al., Reference Powell, Klinck, Ashton-Alcox, Hofmann and Morson2012a) so that males and females are more likely to be in proximity (Buroker, Reference Buroker1983). Dispensing with periostracum is an important adaptation for this reef builder.
A not inconsequential outcome of an exposed shell surface is that oyster shell begins to degrade during life and then degrades rapidly after death, necessitating the continuing formation and deposition of carbonate. Oyster shell is an unusual construct. Though built of low-Mg calcite, generally viewed as the most resistant carbonate to chemical degradation (Hover et al., Reference Hover, Walter and Peacor2001; Morse et al., Reference Morse, Andersson and Mackenzie2006), oyster shell degrades more rapidly than most aragonitic shells (Powell et al., Reference Powell, Klinck, Ashton-Alcox, Hofmann and Morson2012a). In some respects, this is in keeping with the fact that taphonomic processes carry on most rapidly in regions of highest carbonate production (Powell et al., Reference Powell, Staff, Callender, Ashton-Alcox, Brett, Parsons-Hubbard, Walker and Raymond2011). However, one might speculate on the usefulness of a shell that is weak under certain mechanical stresses (Taylor & Layman, Reference Taylor and Layman1972), constructed to be less dense than most carbonates due to the presence of voids, chalky layers, and characteristics of the foliated microstructure and organic matrix (Kennedy et al., Reference Kennedy, Taylor and Hall1969; Rosenberg, Reference Rosenberg and Carter1980; Carriker et al., Reference Carriker, Palmer and Prezant1980; Hong et al., Reference Hong, Keppens, Nielsen and van Riet1995), and accordingly predisposed to break down rapidly into smaller particles. One of the important characteristics of a reef framework is its resistance to wave onslaught. Single shells, unless imbricated, are not resistant to wave onslaught (Grizzle et al., Reference Grizzle, Adams and Walters2002; Wall et al., Reference Wall, Walters, Grizzle and Sacks2005; Stiner & Walters, Reference Stiner and Walters2008). Clumped growth is an obvious adaptation. But, the framework also requires glue and a filler to fill the voids. Organic and terrigenous material are not useful fillers. Neither provides glue and the former provides acid as it decomposes to the detriment of the framework (Reaves, Reference Reaves1986; Tribble, Reference Tribble1993; Best et al., Reference Best, Ku, Kidwell and Walter2007). Carbonate is a good filler, but only if the particles are small. Hence, the oyster needs a shell that will rapidly disaggregate after death into smaller pieces that will pack between the larger valves. In fact, it is not altogether disadvantageous that the shell begins to break down while the animal is alive.
Consequently, the adaptation as a reef builder requires the formation of carbonate that rapidly breaks down. This imposes a severe challenge in that the volume of carbonate produced now must be maximized. A biomass-to-length scaling exponent of 2 provides a mechanism to maximize shell production relative to the biomass of the living animal, while at the same time providing maximum surface area for the all important settling of oyster spat to maintain the population. We note that the oyster's lifespan is likewise set to maximize shell formation (Powell & Klinck, Reference Powell and Klinck2007; see also Mann et al., Reference Mann, Harding and Southworth2009a, Reference Mann, Southworth, Harding and Wessonb for further discussion of the importance of large and old oysters in maintaining reef carbonate and Walles et al., Reference Walles, Mann, Ysebaert, Troost, Herman and Smaal2015, for a discussion of the age dependency of oyster mortality rate as a contributor to maximizing carbonate production) and that the formation of clumps, though exposing more surface area to taphonomic processes (Powell et al., Reference Powell, Klinck, Ashton-Alcox, Hofmann and Morson2012a), adds significant structural glue. We suspect that other bivalve reef builders of the past (e.g. rudists – Sanders, Reference Sanders1999; Steuber, Reference Steuber2000; Masse & Fenerci-Masse, Reference Masse and Fenerci-Masse2006) would be found to obey similar rules.
ACKNOWLEDGEMENTS
Those participating in these data collection programmes are too numerous to mention, though we appreciate all of their collective efforts.
FINANCIAL SUPPORT
Data supporting this research were provided through a series of contracts and awards from the National Oceanic and Atmospheric Administration (National Status and Trends Mussel Watch Program), the Army Corps of Engineers (Galveston Bay dataset), the State of Virginia (Chesapeake Bay dataset) and the State of New Jersey (Delaware Bay dataset).


