


1. Introduction
The Mesoproterozoic is a relatively poorly explored interval in Earth history. This is despite considerable evidence that this time witnessed dramatic plate tectonic events that may have causal links to major biological, atmospheric and ocean chemistry changes (Javaux et al. Reference Javaux, Knoll and Walter2001; Lyons et al. Reference Lyons, Reinhard and Planavsky2014; Planavsky et al. Reference Planavsky, Reinhard, Wang, Thomson, McGoldrick, Rainbird, Johnson, Fischer and Lyons2014; Sperling et al. Reference Sperling, Rooney, Hays, Sergeev, Vorob’eva, Sergeeva, Selby, Johnston and Knoll2014; Butterfield, Reference Butterfield2015; Mukherjee et al. Reference Mukherjee, Large, Corkrey and Danyushevsky2018; Tang et al. Reference Tang, Shi, Wang and Jiang2016; Zhu et al. Reference Zhu, Zhu, Knoll, Yin, Zhao, Sun, Qu, Shi and Liu2016; Zhang et al. Reference Zhang, Zhu, Wood, Shi, Gao and Poulton2018; Allen et al. Reference Allen, Thake and Martin2019). The c. 1.8–0.9 Ga greater McArthur Basin, northern Australia, is one of the largest and best-preserved global sedimentary archives of this era (Fig. 1). Sedimentary geochemical proxies from the greater McArthur successions have been used to investigate the Mesoproterozoic ocean chemistry (Shen et al. Reference Shen, Knoll and Walter2003; Cox et al. Reference Cox, Sansjofre, Blades, Farkas and Collins2019), atmospheric compositions (Reinhard et al. Reference Reinhard, Planavsky, Robbins, Partin, Gill, Lalonde, Bekker, Konhauser and Lyons2013; Mukherjee & Large, Reference Mukherjee and Large2016) and biological conditions (Mukherjee et al. Reference Mukherjee, Large, Corkrey and Danyushevsky2018, Reference Mukherjee, Large, Bull, Gregory, Stepanov, Avila, Ireland and Corkrey2019). The tectonic geography of the greater McArthur Basin, however, is still largely unknown. This is a critical gap in knowledge, because nutrient supply, from erosion of tectonically generated topography and/or volcanism, regulated local biological productivity, which subsequently influenced the basinal biochemical cycles and redox conditions (Cox et al. Reference Cox, Jarrett, Edwards, Crockford, Halverson, Collins, Poirier and Li2016; Yang et al. Reference Yang, Collins, Cox, Jarrett, Denyszyn, Blades, Farkaš and Glorie2020). It is likely that individual basins, or even parts of basins, might have different geochemical profiles due to variable productivity that would have been controlled by the flux of nutrients. To understand these feedbacks, we must understand the evolution of the tectonic geography of the basin.

Fig. 1. (a) Top-to-basement map (SEEBASE™ basement surface image after Frogtech Geoscience, 2018), showing the location of the greater McArthur Basin and the North Australian Craton (NAC). (b) Location of the Mesoproterozoic NAC within the c. 1.3 Ga Rodinia Supercontinent (modified after Kirscher et al. Reference Kirscher, Mitchell, Liu, Li, Cox, Nordsvan, Wang and Pisarevsky2018). (c) Tectonic framework of the NAC with the locations of interpreted Wilton package (shade area), orogens and sampled boreholes, modified after Munson (Reference Munson2016) and Yang et al. (Reference Yang, Smith, Collins, Munson, Schoemaker, Nicholls, Cox, Farkas and Glorie2018).
This study attempts to address the tectonic geography of the greater McArthur Basin. This will enable future studies to better place this depositional system into a wider regional and global context, to better understand whether geochemical proxies may reflect widespread basin-wide or even global effects, or whether they better represent local productivity-driven phenomena (e.g. Cox et al. Reference Cox, Jarrett, Edwards, Crockford, Halverson, Collins, Poirier and Li2016; Yang et al. Reference Yang, Collins, Cox, Jarrett, Denyszyn, Blades, Farkaš and Glorie2020). Here, we focus on the upper package of greater McArthur Basin (the Wilton package), and present data from samples that were collected from multiple basins whose sedimentary accumulations make up the Wilton package, including the Roper Group of the McArthur Basin, the Tijunna–Bullita groups of the Birrindudu Basin and the South Nicholson Group of the South Nicholson Basin (Fig. 1). New detrital zircon U–Pb and Lu–Hf data, compiled with previous published data, are used to determine the basin source regions and intra-basin correlations. From the interpreted spatial and temporal provenance evolution, we reconstruct the tectonic geography of northern Australia during the middle Mesoproterozoic.
2. Geological setting
The greater McArthur Basin is a regionally extensive depositional area in which Palaeoproterozoic to Mesoproterozoic rocks occur, and that covers a large area of northern Australia (Fig. 1; Rawlings, Reference Rawlings1999; Ahmad & Munson, Reference Ahmad and Munson2013; Close, Reference Close2014). Rocks of the basin unconformably overlie Archaean- to early Palaeoproterozoic-aged crystalline basement and are unconformably overlain by Neoproterozoic and Phanerozoic sedimentary rocks (Fig. 2). The greater McArthur Basin contains several coherent lithostratigraphic components and is subdivided into five sedimentary packages (Rawlings, Reference Rawlings1999; Ahmad & Munson, Reference Ahmad and Munson2013; Munson, Reference Munson2016; Munson et al. Reference Munson, Thompson, Zhukova, Meffre, Beyer, Woodhead and Whelan2018). The uppermost Wilton package is characterized by Mesoproterozoic siliciclastic rocks that are readily distinguished from the underlying carbonate-dominated successions of the Favenc package (Fig. 2; Rawlings, Reference Rawlings1999; Munson, Reference Munson2016; Munson et al. Reference Munson, Thompson, Zhukova, Meffre, Beyer, Woodhead and Whelan2018). The Wilton package is shown to be continuous in the subsurface, between basins, in seismic sections (Williams, Reference Williams2019) and is interpreted to be preserved in several geographically widely separated basins (Munson, Reference Munson2016; Frogtech Geoscience, 2018; Munson et al. Reference Munson, Thompson, Zhukova, Meffre, Beyer, Woodhead and Whelan2018). Rocks in these basins include the Roper Group of the McArthur Basin and the buried Beetaloo Sub-basin (Williams, Reference Williams2019), the Renner Group of the Tomkinson Province, the Tijunna Group of the Birrindudu Basin, and the South Nicholson Group of the South Nicholson Basin (Fig. 1; Rawlings, Reference Rawlings1999; Close, Reference Close2014; Munson, Reference Munson2016; Munson et al. Reference Munson, Thompson, Zhukova, Meffre, Beyer, Woodhead and Whelan2018). Sedimentary rocks of the Wilton package are dominated by alternating sandstone and mudstone units and are interpreted to have been deposited in a range of depositional environments, from shoreline to shallow-marine shelf (Rawlings, Reference Rawlings1999; Munson, Reference Munson2016; Sheridan et al. Reference Sheridan, Johns, Johnson and Menpes2018).

Fig. 2. Stratigraphic chart of the Wilton package and its potential equivalents, after Ahmad & Munson (Reference Ahmad and Munson2013), Munson (Reference Munson2016) and Munson et al. (Reference Munson, Thompson, Zhukova, Meffre, Beyer, Woodhead and Whelan2018). Diagrammatic cross-section showing the stratigraphy of the Wilton package, modified after Frogtech Geoscience (2018). Note that the top of the Wilton package has been normalized to surface. Not to scale. Gp: Group; Sub-gp: Subgroup. Dolerite baddeleyite isotope dilution thermal ionization mass spectrometry (ID-TIMS) ages are from Yang et al. (Reference Yang, Collins, Cox, Jarrett, Denyszyn, Blades, Farkaš and Glorie2020) and Bodorkos et al. (Reference Bodorkos, Crowley, Claoué-Long, Anderson and Magee2020).
2.a. Roper Group
Sedimentary rocks of the Roper Group are exposed in the McArthur Basin and in the subsurface Beetaloo Sub-basin (Fig. 1; Ahmad & Munson, Reference Ahmad and Munson2013; Munson, Reference Munson2016; Williams, Reference Williams2019). The Roper Group is interpreted to have been deposited in a stable shoreline–shelf environment and is subdivided into two subgroups: the lower Collara Subgroup and the upper Maiwok Subgroup (Fig. 2; Rawlings, Reference Rawlings1999; Abbott & Sweet, Reference Abbott and Sweet2000). The Collara Subgroup consists of eight units, dominated by sandstones, with less voluminous mudrocks. In ascending stratigraphic order, these are the Phelp Sandstone, Mantungula Formation, Limmen Sandstone, Mainoru Formation, Arnold Sandstone, Jalboi Formation and Hodgson Sandstone (Fig. 2; Jackson et al. Reference Jackson, Sweet and Powell1988; Rawlings, Reference Rawlings1999; Abbott & Sweet, Reference Abbott and Sweet2000; Abbott et al. Reference Abbott, Sweet, Plumb, Young, Cutovinos, Ferenczi and Pietsch2001; Munson, Reference Munson2016). The Maiwok Subgroup is more mudrock-rich with less abundant sandstones; finer-grained units are interpreted as having been deposited in slightly deeper shelf environments (Munson, Reference Munson2016 and references therein). Seven sedimentary units are included in this subgroup: in ascending stratigraphic order these are the Corcoran Formation, Bessie Creek Sandstone, Velkerri Formation, Moroak Sandstone, Kyalla Formation, the Bukalorkmi Sandstone and Chambers River Formation (Fig. 2; Ahmad & Munson, Reference Ahmad and Munson2013). The Chambers River Formation has an isolated distribution, north of the Beetaloo Sub-basin, and is currently under review for promotion to status as a group (TJ Munson & B Yang, pers. comm.). A sensitive high-resolution ion microprobe (SHRIMP) U–Pb zircon age of 1492 ± 4 Ma (2σ; Jackson et al. Reference Jackson, Sweet, Page and Bradshaw1999), from a tuffaceous bed within the lower Mainoru Formation, provides a maximum depositional age constraint on the Collara Subgroup (Fig. 2). The youngest single grain age of 1386 ± 13 Ma from the Bessie Creek Sandstone has been used as the maximum depositional age constraint for the Maiwok Subgroup (Yang et al. Reference Yang, Smith, Collins, Munson, Schoemaker, Nicholls, Cox, Farkas and Glorie2018). The minimum depositional age of the Roper Group is constrained by the age of the Derim Derim Dolerite that intrudes the upper part of the succession up to the Bukalorkmi Sandstone (Fig. 2). A secondary ionization mass spectrometry (SIMS) U–Pb baddeleyite age of 1324 ± 4 Ma, was reported by Abbott et al. (Reference Abbott, Sweet, Plumb, Young, Cutovinos, Ferenczi and Pietsch2001) from the Urapunga Region for the Derim Derim Dolerite. This has recently been confirmed with an isotope dilution thermal ionization mass spectrometry (ID-TIMS) age of 1327.5 ± 0.6 Ma (Bodorkos et al. Reference Bodorkos, Crowley, Claoué-Long, Anderson and Magee2020) on the same baddeleyite sample. Yang et al. (Reference Yang, Collins, Cox, Jarrett, Denyszyn, Blades, Farkaš and Glorie2020) obtained a younger ID-TIMS U–Pb baddeleyite age of 1312.9 ± 0.9 Ma from a sample of the dolerite collected from the northern Beetaloo Sub-basin c. 200 km south of the Urapunga Region.
2.b. Bullita and Tijunna groups
The Birrindudu Basin is located in the western part of the greater McArthur Basin (Figs 1, 2). The two uppermost sedimentary groups are the Bullita and Tijunna groups (Fig. 2). The Bullita Group unconformably underlies the Tijunna Group, and contains five formations: in ascending stratigraphic order, the Timber Creek Formation, Skull Creek Formation, Bynoe Formation, Weaner Sandstone and Battle Creek Formation (Fig. 2; Ahmad & Munson, Reference Ahmad and Munson2013). The three lower formations, are characterized by stromatolitic, carbonate-dominated successions, whereas the Weaner Sandstone and Battle Creek Formation contain more siliciclastics (Ahmad & Munson, Reference Ahmad and Munson2013). Collectively, this succession indicates a shoaling, shallow-marine platform depositional environment (Ahmad & Munson, Reference Ahmad and Munson2013). The correlation of the Bullita Group with the greater McArthur Basin packages (sensu Rawlings, Reference Rawlings1999) remains unclear, as the lower formations exhibit lithological similarities to the Favenc package, whereas the siliciclastic upper formations (Weaner Sandstone and Battle Creek Formation) may correlate with the lower Wilton package (Fig. 2; Munson et al. Reference Munson, Thompson, Zhukova, Meffre, Beyer, Woodhead and Whelan2018). Depositional age constraints for this group are limited. The youngest detrital zircon age from the underlying Wattie Group of 1550 ± 48 Ma (2σ; Kositcin & Carson, Reference Kositcin and Carson2017) provides a maximum depositional age constraint for the lower Bullita Group formations. The maximum depositional ages of the Weaner Sandstone and the Battle Creek Formation are constrained by the youngest single zircon analysed from the Weaner Sandstone (1550 ± 36 Ma, 2σ; Kositcin & Carson, Reference Kositcin and Carson2017).
The Tijunna Group contains siliciclastic rocks that are divided into two formations: the Wondoan Hill Formation and the Stubb Formation (Fig. 2; Ahmad & Munson, Reference Ahmad and Munson2013). The Wondoan Hill Formation comprises interbedded sandstone and mudstone with minor dolostone, whereas the Stubb Formation is a mudstone-dominated succession with minor sandstone. The youngest analysed detrital zircon in the Wondoan Hill Formation has a 207Pb/206Pb age of 1452 ± 48 Ma (Munson et al. Reference Munson, Thompson, Zhukova, Meffre, Beyer, Woodhead and Whelan2018), which provides a maximum depositional age constraint. The Tijunna Group is unconformably overlain by the Neoproterozoic Auvergne Group (Carson, Reference Carson2013; Munson et al. Reference Munson, Thompson, Zhukova, Meffre, Beyer, Woodhead and Whelan2018).
2.c. South Nicholson group
The Mesoproterozoic South Nicholson Group occurs within the South Nicholson Basin, which is located to the SE of the Beetaloo Sub-basin (Figs 1, 2). This basin unconformably overlies the Palaeoproterozoic Murphy Province, Lawn Hill Platform and Western Fold Belt of the Mount Isa Province, and is overlain by a series of Neoproterozoic to Phanerozoic successions, including Cambrian volcanic rocks of the Kalkarindji Province and the Neoproterozoic Georgina Basin (Ahmad & Munson, Reference Ahmad and Munson2013). The South Nicholson Group is dominated by quartz arenite interstratified with siltstone and shale, indicating a range of depositional environments from fluvial to shallow-marine shelf (Ahmad & Munson, Reference Ahmad and Munson2013). It is subdivided into two subgroups. The Wild Cow Subgroup, in the lower part, includes the basal Playford Sandstone and equivalent Bowgan Sandstone, overlain by the finer-grained heterolithic Crow Formation (Fig. 2). The upper, Accident Subgroup, contains the basal Constance Sandstone and equivalent Mittebah Sandstone, overlain by the dominantly fine-grained Mullera Formation (Fig. 2). Deposition of the South Nicholson Group is constrained by a weighted mean detrital zircon age of 1483 ± 12 Ma (youngest group, 95 % confidence, n = 43, MSWD = 1.38) from the Crow Formation, whilst the youngest analysed zircon grain from this formation returned a 207Pb/206Pb age of 1371 ± 94 Ma (2σ; Kositcin & Carson, Reference Kositcin and Carson2019).
3. Detrital zircon U–Pb age and Hf isotopes
3.a. Method
3.a.1. U–Pb dating
Twelve sandstones were collected from boreholes, including two from the Roper Group of the McArthur Basin, three from undifferentiated South Nicholson Group of the South Nicholson Basin, three from the Bullita Group and four from the Tijunna Group of the Birrindudu Basin. Detailed sampling information is listed in Table 1.
Table 1. Details of samples collected for this study

Gp: Group; Fm: Formation; Sst: Sandstone.
Zircon grains were separated from crushed rock using hand panning, conventional magnetic methods and heavy liquids (LST 2.85 ± 0.02 g mL−1). Individual zircon grains were handpicked and mounted in epoxy resin. Preference to grain sizes, or shapes, or colours was avoided during zircon selection. Cathodoluminescence (CL) images were obtained using a FEI Quanta 600 scanning electron microscope (SEM) with attached Gatan CL (working distance 15 mm; accelerating voltage 12 kV) at Adelaide Microscopy, The University of Adelaide, to image zircon internal structures and determine suitable domains for further analysis. Zircon U–Pb geochronological data were collected using a New Wave 213 nm Nd-YAG laser coupled with an Agilent 7900cs inductively coupled plasma – mass spectrometer (ICP-MS) at Adelaide Microscopy. A spot size of 30 µm with frequency of 5 Hz was used. Laser intensity was set to 70 %, with fluence varying from ~5 to 7 J cm−2. Mass bias and laser-induced fractionation were corrected using the GEMOC GJ-1 zircon standard with published 207Pb/206Pb age of 607.7 ± 4.3 Ma, 206Pb/238U age of 600.7 ± 1.1 Ma and 207Pb/235U age of 602.0 ± 1.0 Ma (Jackson et al. Reference Jackson, Pearson, Griffin and Belousova2004).
The Plešovice and 91500 zircon standards were analysed as unknowns to check accuracy. Analysis of the Plešovice internal standard yielded a weighted average 206Pb/238U age of 336.49 ± 0.35 Ma (95 % confidence, MSWD = 1.4, n = 133), which is consistent with the published 206Pb/238U age of 337.13 ± 0.37 Ma (Sláma et al. Reference Sláma, Kosler, Condon, Crowley, Gerdes, Hanchar, Horstwood, Morris, Nasdala, Norberg, Schaltegger, Schoene, Tubrett and Whitehouse2008). The 91500 zircon standard yielded a 206Pb/238U weighted mean age of 1063.3 ± 4.8 Ma (95 % confidence, MSWD = 1.7, n = 34) and 207Pb/206Pb weighted mean age of 1064 ± 16 Ma (95 % confidence, MSWD = 1.06, n = 34), consistent with the published 206Pb/238U and 207Pb/206Pb ages of 1062.4 ± 0.4 Ma and 1065.4 ± 0.3 Ma (Wiedenbeck et al. Reference Wiedenbeck, Alle, Corfu, Griffin, Meier, Oberli, Quadt, Roddick and Spiegel1995). Zircon U–Pb age concordance was calculated by dividing the 206Pb/238U age by the 207Pb/206Pb age and multiplying by 100. Data were reduced using Iolite (Paton et al. Reference Paton, Hellstrom, Paul, Woodhead and Hergt2011) and plotted using the IsoplotR (Vermeesch, Reference Vermeesch2018).
3.a.2. Hafnium isotope analysis
Hafnium isotopic compositions were determined at The University of Adelaide using a New Wave UP-193 ArF excimer laser attached to a Thermo-Scientific Neptune Multi-Collector ICP-MS, following the methodology of Payne et al. (Reference Payne, Pearson, Grant and Halverson2013). Zircon grains, with less than 10 % age discordance, were ablated using a spot size of 50 μm or 35 µm (depending on the grain size), frequency of 5 Hz, 4 ns pulse length and an intensity of ~4.5 J cm−2. The acquisition time of each analysis was ~70 s, including 20 s of gas background measurement. Raw data were reduced using the HfTRAX Excel macro (Payne et al. Reference Payne, Pearson, Grant and Halverson2013). Hafnium mass bias was corrected using a stable 179Hf/177Hf ratio of 0.7325 (Patchett et al. Reference Patchett, Kouvo, Hedge and Tatsumoto1982). Correction of the Yb and Lu isobaric interferences on 176Hf followed the methods of Woodhead et al. (Reference Woodhead, Hergt, Shelley, Eggins and Kemp2004). The Mudtank zircon standard was used to monitor the instrument stability and data quality. This yielded a weighted mean 176Hf/177Hf ratio of 0.282499 ± 14 (2σ, n = 10), which is in accordance with the published value of 0.282507 ± 6 (Woodhead & Hergt, Reference Woodhead and Hergt2005). A 176Lu decay constant of 1.865 × 10⁻¹¹ a−1 after Scherer et al. (Reference Scherer, Münker and Mezger2001) was used for initial 176Hf/177Hf values calculation. ε Hf(t) values were calculated using chondrite reservoir (CHUR) values of 176Hf/177Hf = 0.282785 and 176Lu/177Hf = 0.0336 after Bouvier et al. (Reference Bouvier, Vervoort and Patchett2008).
3.a.3. Multidimensional scaling
We used multidimensional scaling (MDS) in this study. MDS is a statistical technique based on the Kolgomorov–Smirnov calculation (K-S test) that quantifies and visualizes the degree of dissimilarity among geochronologic samples (Vermeesch, Reference Vermeesch2013; Sharman et al. Reference Sharman, Sharman and Sylvester2018). The degree of dissimilarity is visualized by the plotted distance between individual samples. Samples that have similar age spectra plot closer to each other than samples that have less similar spectra. Although limitations exist (e.g. Yang et al. Reference Yang, Smith, Collins, Munson, Schoemaker, Nicholls, Cox, Farkas and Glorie2018; Nordsvan et al. Reference Nordsvan, Kirscher, Kirkland, Barham and Brennan2020), the MDS plot presents a useful comparison of samples from various locations and stratigraphy, providing assessments on both spatial and temporal variation of basin provenance. In this study, the MDS plot was generated using detritalPy (Sharman et al. Reference Sharman, Sharman and Sylvester2018), with individual samples presented as pie charts for the purpose of illustrating the detrital zircon age compositions for each sample. Data from potential sourcing basements were also plotted, highlighting variations in source regions for different parts of the basin and at different times.
3.b. Results
A total of 615 detrital zircon near-concordant (≥90 % concordance) U–Pb analyses and 253 hafnium isotope analyses were collected. All U–Pb age and hafnium value data are reported at the 2σ level. The U–Pb age data are presented in Figures 3, 4 and 5, and the hafnium data are presented in Figures 6, 7 and 8. The summarized results are provided in Table 2, and detailed analysing results are listed in the Supplementary Material available online at https://doi.org/10.1017/S0016756820001223.
Table 2. Summary of results

Gp: Group; Fm: Formation; Sst: Sandstone.
Two samples from the Collara Subgroup were analysed. The Crawford Formation (Bro-06) yielded 88 near-concordant analyses (out of 142) with a dominant cluster at c. 1780 Ma (ϵ Hf(t): −2.9 to −0.4; Figs 3, 6). Fifty-three near-concordant (out of 107) analyses obtained from sample Bro-07 (Arnold Sandstone) exhibit a major peak at c. 1745 Ma (ϵ Hf(t): −4.6 to +4.4) and two minor peaks clustering at c. 1810 Ma (ϵ Hf(t): −5.6 to −0.4) and c. 1895 Ma (ϵ Hf(t): −2.6 to +0.1; Figs 3, 6).

Fig. 3. Epsilon hafnium values against 207Pb/206Pb ages plot of the measured samples from the Collara Subgroup. Zircon ϵ Hf(t) heat maps reflect the point density distribution of published magmatic zircon data from possible source regions, including (a) South Australian Craton (SAC; Nebel et al. Reference Nebel, Nebel-Jacobsen, Mezger and Berndt2007; Reid et al. Reference Reid, Hand, Jagodzinski, Kelsey and Pearson2008, Reference Reid, Jagodzinski, Armit, Dutch, Kirkland, Betts and Schaefer2014, Reference Reid, Jagodzinski, Wade, Payne and Jourdan2017, Reference Reid, Pawley, Wade, Jagodzinski, Dutch and Armstrong2020; Howard et al. Reference Howard, Hand, Barovich, Reid, Wade and Belousova2009, Reference Howard, Hand, Barovich, Payne, Cutts and Belousova2011; Kromkhun et al. Reference Kromkhun, Foden, Hore and Baines2013; Reid & Payne, Reference Reid and Payne2017), (b) Aileron Province (Hollis et al. Reference Hollis, Beyer, Whelan, Kemp, Scherstén and Greig2010; Beyer et al. Reference Beyer, Hollis, Whelan, Glass, Donnellan, Yaxley, Armstrong, Allen and Scherstén2013, Reference Beyer, Allen, Armstrong and Woodhead2015) and (c) the Kathleen Fold Belt (KFB) of Mount Isa Province (Bierlein et al. Reference Bierlein, Black, Hergt and Mark2008). Published detrital zircon data from source regions are from Eastern Fold Belt (EFB) of Mount Isa Province (Griffin et al. Reference Griffin, Belousova, Walters and O’Reilly2006), Coen and Georgetown provinces (C&G; Murgulov et al. Reference Murgulov, Beyer, Griffin, O’Reilly, Walters and Stephens2007). CHUR: chondrite reservoir. *data from Munson et al. (Reference Munson, Thompson, Zhukova, Meffre, Beyer, Woodhead and Whelan2018). Maiwok Subgroup data are from Yang et al. (Reference Yang, Collins, Blades, Capogreco, Payne, Munson, Cox and Glorie2019).

Fig. 4. Kernel distribution estimates (KDE) of detrital zircon 207Pb/206Pb age spectra of the Bullita and Tijunna Groups and potential sources. Data from this study are compiled with published 207Pb/206Pb age data from *Munson et al. (Reference Munson, Thompson, Zhukova, Meffre, Beyer, Woodhead and Whelan2018), **Carson (Reference Carson2013) and ***Kositcin & Carson (Reference Kositcin and Carson2017). Published 207Pb/206Pb ages from magmatic zircon grains are included from potential source areas, including Aileron Province (Cross et al. Reference Cross, Claoué-Long, Scrimgeour, Ahmad and Kruse2005 a, b, c; Carson et al. Reference Carson, Claoué-Long, Stern, Close, Scrimgeour and Glass2009; Beyer et al. Reference Beyer, Hollis, Whelan, Glass, Donnellan, Yaxley, Armstrong, Allen and Scherstén2013, Reference Beyer, Allen, Armstrong and Woodhead2015, Reference Beyer, Donnellan, Meffre and Thompson2016; Kositcin et al. Reference Kositcin, Beyer, Whelan, Close, Hallett and Dunkley2013 a, b, Reference Kositcin, Beyer and Whelan2014 a, b, Reference Kositcin, Reno and Whelan2015; Bodorkos et al. Reference Bodorkos, Beyer, Edgoose, Whelan, Webb, Vandenberg and Hallett2013; Worden et al. Reference Worden, Claoué-Long and Scrimgeour2006 a, b, Reference Worden, Carson, Close, Donnellan and Scrimgeour2008; Hollis et al. Reference Hollis, Beyer, Whelan, Kemp, Scherstén and Greig2010), Pine Creek Orogen (Carson et al. Reference Carson, Claoué-Long, Stern, Close, Scrimgeour and Glass2009; Kositcin et al. Reference Kositcin, Carson, Hollis, Glass, Close, Whelan, Webb and Donnellan2013 b; Beyer et al. Reference Beyer, Hollis, Whelan, Glass, Donnellan, Yaxley, Armstrong, Allen and Scherstén2013; Worden et al. Reference Worden, Claoué-Long and Scrimgeour2006 a, b, Reference Worden, Carson, Close, Donnellan and Scrimgeour2008), Halls Creek Orogen (Worden et al. Reference Worden, Carson, Close, Donnellan and Scrimgeour2008), Tanami Region (Cross et al. Reference Cross, Claoué-Long, Scrimgeour, Crispe and Donnellan2005 c; Worden et al. Reference Worden, Claoué-Long and Scrimgeour2006 a, Reference Worden, Carson, Close, Donnellan and Scrimgeour2008; Bagas et al. Reference Bagas, Bierlein, Anderson and Maas2010; Kositcin et al. Reference Kositcin, Beyer, Whelan, Close, Hallett and Dunkley2013 a; Iaccheri, Reference Iaccheri2019). Red arrows: the youngest detrital zircon 207Pb/206Pb age (with >95% concordance) for each formation. MDA: the youngest detrital zircon 207Pb/206Pb age used as maximum deposition age constraint. Red line represents the assigned maximum deposition age for each formation. Grey columns are bands of equivalent age range.
Four samples from the Bullita Group were analysed. A total of 48 (out of 98) near-concordant analyses from the Bynoe Formation sample (D02) exhibit a major peak at c. 1835 Ma (ε Hf(t): −8.7 to +0.2) and two minor peaks at c. 1920 Ma (ε Hf(t): −4.8 to +0.2) and 1780 Ma (ε Hf(t): −6.8 to −5.2; Figs 4, 7). Samples D24 and MS-09 are both from the Weaner Sandstone. A total of 23 near-concordant analyses (out of 109) from sample D24 show a major age peak at c. 1830 Ma (ϵ Hf(t): −9.0 to +3.2) and two minor peaks at c. 1940 Ma (ε Hf(t): −6.1 to +1.7) and c. 1730 Ma (ε Hf(t): −3.7 to −0.7; Figs 4, 7). Sample MS-09 yielded 44 near-concordant analyses (out of 102) with a main and a minor peaks at c. 1830 Ma (ε Hf(t): −4.4 to +2.6) and c. 1910 Ma (ϵ Hf(t): −13.0 to −3.2), respectively (Figs 4, 7). The Battle Creek sample (MS-06) gave 41 near-concordant analyses (out of 124) that form an age spectrum with a dominant age cluster at c. 1810 Ma (ε Hf(t): −6.1 to +2.1; Figs 4, 7).

Fig. 5. Kernel distribution estimates (KDE) of detrital zircon 207Pb/206Pb age spectra of the South Nicholson Group, possible Wilton package equivalents and potential sources. Data used for comparison are from this study and from *Nordsvan et al. (Reference Nordsvan, Collins, Li, Spencer, Pourteau, Withnall, Betts and Volante2018), **Neumann & Kositcin (Reference Neumann and Kositcin2011), ***Kositcin & Carson (Reference Kositcin and Carson2019) and ****Anderson et al. (Reference Anderson, Lewis, Jarrett, Carr, Henson, Carson, Southby and Munson2019). Published 207Pb/206Pb ages from both magmatic and detrital zircon grains are included from potential source areas, including Aileron Province (Cross et al. Reference Cross, Claoué-Long, Scrimgeour, Ahmad and Kruse2005 a, b, c; Worden et al. Reference Worden, Claoué-Long and Scrimgeour2006 a, b, Reference Worden, Carson, Close, Donnellan and Scrimgeour2008; Carson et al. Reference Carson, Claoué-Long, Stern, Close, Scrimgeour and Glass2009; Hollis et al. Reference Hollis, Beyer, Whelan, Kemp, Scherstén and Greig2010; Beyer et al. Reference Beyer, Hollis, Whelan, Glass, Donnellan, Yaxley, Armstrong, Allen and Scherstén2013, Reference Beyer, Allen, Armstrong and Woodhead2015, Reference Beyer, Donnellan, Meffre and Thompson2016; Bodorkos et al. Reference Bodorkos, Beyer, Edgoose, Whelan, Webb, Vandenberg and Hallett2013; Kositcin et al. Reference Kositcin, Beyer, Whelan, Close, Hallett and Dunkley2013 a, b, Reference Kositcin, Beyer and Whelan2014 a, b, Reference Kositcin, Reno and Whelan2015), Western Fold Belt & Kathleen Fold Belt (WFB&KFB) of Mount Isa Province (Neumann et al. Reference Neumann, Southgate, Gibson and McIntyre2006, Reference Neumann, Gibson and Southgate2009; Cross et al. Reference Cross, Purdy, Bultitude, Brown and Carr2015), Eastern Fold Belt (EFB) of Mount Isa Province (Griffin et al. Reference Griffin, Belousova, Walters and O’Reilly2006), South Australian Craton (SAC; Nebel et al. Reference Nebel, Nebel-Jacobsen, Mezger and Berndt2007; Reid et al. Reference Reid, Hand, Jagodzinski, Kelsey and Pearson2008, Reference Reid, Jagodzinski, Armit, Dutch, Kirkland, Betts and Schaefer2014, Reference Reid, Jagodzinski, Wade, Payne and Jourdan2017, Reference Reid, Pawley, Wade, Jagodzinski, Dutch and Armstrong2020; Howard et al. Reference Howard, Hand, Barovich, Reid, Wade and Belousova2009, Reference Howard, Hand, Barovich, Payne, Cutts and Belousova2011; Wade et al. Reference Wade, Reid, Wingate, Jagodzinski and Barovich2012; Kromkhun et al. Reference Kromkhun, Foden, Hore and Baines2013; Reid & Payne, Reference Reid and Payne2017; Morrissey et al. Reference Morrissey, Barovich, Hand, Howard and Payne2019), Coen and Georgetown provinces (C&G; Blewett et al. Reference Blewett, Black, Sun, Knutson, Hutton and Bain1998; Hoskin & Black, Reference Hoskin and Black2000; Kositcin et al. Reference Kositcin, Champion and Huston2009; Neumann & Kositcin, Reference Neumann and Kositcin2011). Red arrows: the youngest detrital zircon 207Pb/206Pb age (with >95 % concordance) for each formation. MDA: the youngest detrital zircon 207Pb/206Pb age used as maximum deposition age constraint. Red line represents the assigned maximum deposition age for each formation. Grey columns are bands of equivalent age range.

Fig. 6. Epsilon hafnium values against 207Pb/206Pb ages plot of the measured samples from the Collera Subgroup. Zircon ϵ Hf(t) heat maps reflect the point density distribution of published magmatic zircon data from possible source regions, including (a) South Australian Craton (SAC; Nebel et al. Reference Nebel, Nebel-Jacobsen, Mezger and Berndt2007; Reid et al. Reference Reid, Hand, Jagodzinski, Kelsey and Pearson2008, Reference Reid, Jagodzinski, Armit, Dutch, Kirkland, Betts and Schaefer2014, Reference Reid, Jagodzinski, Wade, Payne and Jourdan2017, Reference Reid, Pawley, Wade, Jagodzinski, Dutch and Armstrong2020; Howard et al. Reference Howard, Hand, Barovich, Reid, Wade and Belousova2009, Reference Howard, Hand, Barovich, Payne, Cutts and Belousova2011; Kromkhun et al. Reference Kromkhun, Foden, Hore and Baines2013; Reid & Payne, Reference Reid and Payne2017), (b) Aileron Province (Hollis et al. Reference Hollis, Beyer, Whelan, Kemp, Scherstén and Greig2010; Beyer et al. Reference Beyer, Hollis, Whelan, Glass, Donnellan, Yaxley, Armstrong, Allen and Scherstén2013, Reference Beyer, Allen, Armstrong and Woodhead2015) and (c) the Kathleen Fold Belt (KFB) of Mount Isa Province (Bierlein et al. Reference Bierlein, Black, Hergt and Mark2008). Published detrital zircon data from source regions are from the Eastern Fold Belt (EFB) of Mount Isa Province (Griffin et al. Reference Griffin, Belousova, Walters and O’Reilly2006), the Coen and Georgetown provinces (C&G; Murgulov et al. Reference Murgulov, Beyer, Griffin, O’Reilly, Walters and Stephens2007). CHUR: chondrite reservoir. *data from Munson et al. (Reference Munson, Thompson, Zhukova, Meffre, Beyer, Woodhead and Whelan2018). Maiwok Subgroup data are from Yang et al. (Reference Yang, Collins, Blades, Capogreco, Payne, Munson, Cox and Glorie2019).
Three samples from the Tijunna Group were analysed, including two from the Wondoan Hill Formation (D57 and MS-05) and one from the Stubb Formation (MS-03). Sample D57 gave 46 near-concordant analyses out of 109. These analyses exhibit a major age peak at c. 1795 Ma and a smaller one at c. 1840 Ma with ε Hf(t) values ranging from −4.1 to +2.6 and −3.8 to +2.5, respectively (Figs 4, 7). Sample MS-05 yielded 53 near-concordant analyses (out of 118) with a dominant age cluster at c. 1795 Ma (ε Hf(t): −6.8 to −0.2; Figs 4, 7). Forty-nine near-concordant analyses (out of 133) obtained from the Stubb Formation sample (MS-03) form a major cluster at c. 1810 Ma (ε Hf(t): −4.3 to +1.7; Figs 4, 7).
Samples AY-01, SOU-01 and JR-01 are all from the undifferentiated South Nicholson Group. Sample AY-01 gave 73 near-concordant analyses (out of 122) with a major peak at c. 1715 Ma (ε Hf(t): −5.3 to −2.2) and a minor peak at c. 1810 Ma (ε Hf(t): −6.1 to −0.5; Figs 5, 8). A total of 53 near-concordant analyses (out of 86) obtained from sample SOU-01 show one major peak and one minor peak at c. 1760 Ma (ε Hf(t): −6.9 to −1.3) and c. 1600 Ma (ε Hf(t): 463.0 to +0.5), respectively (Figs 5, 8). Sample JR-01 yielded 46 near-concordant analyses (out of 121) that form an age spectrum with a dominant peak at c. 1770 Ma (ε Hf(t): −6.3 to −2.7; Figs 5, 8).

Fig. 7. Epsilon hafnium values against 207Pb/206Pb ages plot of the measured samples from the Bullita Group and the Tijunna Group. Zircon ϵ Hf(t) heat maps reflect the point density distribution of published magmatic zircon data from possible source regions, including (a) Aileron Province (Hollis et al. Reference Hollis, Beyer, Whelan, Kemp, Scherstén and Greig2010; Beyer et al. Reference Beyer, Hollis, Whelan, Glass, Donnellan, Yaxley, Armstrong, Allen and Scherstén2013, Reference Beyer, Allen, Armstrong and Woodhead2015), (b) Tanami Region (Iaccheri, Reference Iaccheri2019) and (c) Pine Creek Orogen (Beyer et al. Reference Beyer, Hollis, Whelan, Glass, Donnellan, Yaxley, Armstrong, Allen and Scherstén2013). Published detrital zircon data from source regions are from Halls Creek Orogen (Hollis et al. Reference Hollis, Kemp, Tyler, Kirkland, Wingate, Phillips, Sheppard, Belousova and Gréau2014; Iaccheri & Kemp, Reference Iaccheri and Kemp2018). CHUR: chondrite reservoir. *data from Munson et al. (Reference Munson, Thompson, Zhukova, Meffre, Beyer, Woodhead and Whelan2018).
4. Provenance analysis
The Wilton package was deposited in a stable shelf environment. It is surrounded by exposed basement that may have provided detritus to the basin at different times. In this study, coupled detrital zircon U–Pb and Hf data from the Wilton package are compared with data from the exposed orogens/basements, in order to identify the possible source regions. We recognize that none of samples here have the number of near-concordant U–Pb analyses (>117) that is needed to record ages from all significant source regions (Vermeesch, Reference Vermeesch2004). We also recognize that sediment transport and mineral separation is not a random process. Both these caveats mean that caution is needed when interpreting gaps in data. Because of this, we have concentrated on interpreted data trends, which we argue are robust in this type of analysis. Provenance interpretations are based on the compiled new and published dataset, in order to minimize any possible statistical inaccuracy. In the kernel density plots (Figs 3, 4, 5), individual samples from the same formation are plotted separately, so that a comparison between samples can be made. Overlapping dominant age peaks from multiple samples represent the most significant age sources for each formation.

Fig. 8. Epsilon hafnium values against 207Pb/206Pb ages plot of the measured samples from the South Nicholson Group. Zircon ϵ Hf(t) heat maps reflect the point density distribution of published magmatic zircon data from possible source regions, including (a) South Australian Craton (SAC; Nebel et al. Reference Nebel, Nebel-Jacobsen, Mezger and Berndt2007; Reid et al. Reference Reid, Hand, Jagodzinski, Kelsey and Pearson2008, Reference Reid, Jagodzinski, Armit, Dutch, Kirkland, Betts and Schaefer2014, Reference Reid, Jagodzinski, Wade, Payne and Jourdan2017, Reference Reid, Pawley, Wade, Jagodzinski, Dutch and Armstrong2020; Howard et al. Reference Howard, Hand, Barovich, Reid, Wade and Belousova2009, Reference Howard, Hand, Barovich, Payne, Cutts and Belousova2011; Kromkhun et al. Reference Kromkhun, Foden, Hore and Baines2013; Reid & Payne, Reference Reid and Payne2017), (b) Aileron Province (Hollis et al. Reference Hollis, Beyer, Whelan, Kemp, Scherstén and Greig2010; Beyer et al. Reference Beyer, Hollis, Whelan, Glass, Donnellan, Yaxley, Armstrong, Allen and Scherstén2013, Reference Beyer, Allen, Armstrong and Woodhead2015), (c) the Kathleen Fold Belt (KFB) of Mount Isa Province (Bierlein et al. Reference Bierlein, Black, Hergt and Mark2008). Published detrital zircon data from source regions are from the Eastern Fold Belt (EFB) of Mount Isa Province (Griffin et al. Reference Griffin, Belousova, Walters and O’Reilly2006), the Coen-Georgetown provinces (C&G; Murgulov et al. Reference Murgulov, Beyer, Griffin, O’Reilly, Walters and Stephens2007). CHUR: chondrite reservoir. *data from Munson et al. (Reference Munson, Thompson, Zhukova, Meffre, Beyer, Woodhead and Whelan2018). Maiwok Subgroup data are from Yang et al. (Reference Yang, Collins, Blades, Capogreco, Payne, Munson, Cox and Glorie2019).
4.a. Collara Subgroup of McArthur Basin
Detrital zircon data from the sandstones in the upper part of the Collara Subgroup were derived from two core samples (Bro-06 and Bro-07; Table 1) and three outcrop samples studied by Munson et al. (Reference Munson, Thompson, Zhukova, Meffre, Beyer, Woodhead and Whelan2018); this includes sample UR14TJM0013 from the Crawford Formation, UR14TJM0015 from the Arnold Sandstone and UR14TJM0035 from the Hodgson Sandstone (Fig. 3).
The two detrital zircon spectra from the Crawford Formation, samples Bro-06 and UR14TJM0013, are unimodal, with overlapping major peaks at c. 1780 Ma (Fig. 3). The Arnold Sandstone spectra (Bro-07 and UR14TJM0035) are dominated by zircons with 207Pb/206Pb ages between c. 1800 and 1720 Ma. Major peaks are at c. 1780 Ma and c. 1745 Ma (Fig. 3). The Hodgson Sandstone sample has a unimodal spectrum with the centroid at c. 1760 Ma, consistent with the spectra from older sandstone units within the Collara Subgroup (Fig. 3; Munson et al. Reference Munson, Thompson, Zhukova, Meffre, Beyer, Woodhead and Whelan2018). Although these samples all have limited concordant analyses, the similarity of these spectra to one another indicates that the sediments of these three Collara Subgroup formations were derived from similar-aged source areas. Zircon grains that form the dominant peaks at c. 1780 to 1740 Ma are interpreted to be sourced from c. 1790 to 1720 Ma magmatic rocks found in both the Mount Isa and Aileron provinces (Fig. 3). This conclusion is supported by the hafnium isotope data, which show that ε Hf(t) values of the Collara Subgroup overlap with those of both the Mount Isa and Aileron provinces (Fig. 6); the similarities with the Aileron Province data are particularly striking. Sample Bro-07 also has a large portion of detrital zircon grains with ages ranging between c. 2150 and c. 1810 Ma (Fig. 3); metasedimentary rocks in Mount Isa include zircons of these ages (Fig. 6c) with similar ε Hf(t) values, although an additional source for these grains cannot be discounted.
4.b. Bullita and Tijunna groups of Birrindudu Basin
4.b.1. Bullita group
Detrital zircon data from three formations of the Bullita Group (Bynoe Formation, Weaner Sandstone and Battle Creek Sandstone) were derived from four new core samples (D02, D24, MS-09 and MS-06; Table 1), one core sample (GA 1957143) of the Weaner Sandstone from Carson (Reference Carson2013) and one outcrop sample (GA 1956897) of the Weaner Sandstone from Kositcin & Carson (Reference Kositcin and Carson2017).
Only one sample (D02) was obtained from the Bynoe Formation. The age spectrum of this sample exhibits a spread of zircon ages from c. 2960 Ma to c. 1500 Ma, with a dominant age peak at 1830 Ma and minor peaks at c. 1920 Ma and 1780 Ma (Fig. 4). Zircon forming the prominent age peak at c. 1830 Ma might have been sourced from the Halls Creek and Pine Creek orogens in the northwest and north of the basin, where voluminous c. 1850–1820 Ma magmatic rocks occur (Fig. 4). The minor c. 1920 Ma age peak also matches a similar minor peak in the Halls Creek Orogen spectrum (Fig. 4).
Age spectra from the four Weaner Sandstone samples all have primary peaks at c. 1830 Ma, but their secondary age populations differ (Fig. 4). These minor peaks are at c. 1735 Ma (sample D24), c. 1780 Ma (sample 1957143) and c. 1905 Ma (sample MS-09; Fig. 4). The differences in the minor peaks between samples may represent differences in spatial provenance, or simply reflect the fact that not enough zircons were analysed. Despite this, the overlapping primary c. 1830 Ma age peaks suggest a dominant source area, most likely the Halls Creek and Pine Creek orogens, similar to the source of the underlying Bynoe Formation. The ϵ Hf(t) data show that these c. 1830 Ma zircon grains have ε Hf(t) values (−9 to +3) consistent with this proposed Halls Creek/Pine Creek orogen source (Fig. 7). The c. 1905 Ma zircon age population is also replicated in detrital zircons from magmatic rocks in the Halls Creek / Pine Creek Orogen, but younger zircons (<c. 1780 Ma) were more likely sourced from the other regions, such as the Aileron Province in the south or other unexposed sources.
Detrital zircon grains obtained from the Battle Creek Formation sample (MS-06) yielded an age spectrum with a major peak at c. 1810 Ma (Fig. 4). The Halls Creek and Pine Creek orogens to the north and northwest are again potential source regions for these zircons. However, there are also c. 1810 Ma magmatic rocks in the Tanami Region to the south of the basin. In the ϵ Hf(t) vs age plot (Fig. 7c), the Battle Creek Formation analyses overlap with data from all three possible source areas. The lack of comparison with the other Battle Creek sample makes the identification of potential source terrane(s) ambiguous.
4.b.2. Tijunna group
Detrital zircon data from the Tijunna Group were derived from three core samples (D57, MS-05 and MS-03; Table 1), one published drill core sample (1957137) of the Stubb Formation from Carson (Reference Carson2013) and one published outcrop sample (VR14TJM0003) of the Wondoan Hill Formation from Munson et al. (Reference Munson, Thompson, Zhukova, Meffre, Beyer, Woodhead and Whelan2018).
Detrital zircon age spectra of the three Wondoan Hill Formation samples all have major peaks at c. 1800 Ma (Fig. 4). The prominent c. 1830 Ma ages seen in the Bullita Group are not so apparent in the Wondoan Hill Formation spectra (Fig. 4). This leads us to suggest that the Halls Creek and Pine Creek orogens were no longer the dominant source areas for the basin at the time of deposition of the Wondoan Hill Formation. Instead, the younger c. 1800 Ma zircons were mostly likely to be sourced from the Tanami Region, to the south of the basin, where c. 1810 Ma to 1790 Ma magmatic rocks are exposed (Fig. 4). This is supported by Hf isotope data, which have overlapping ϵ Hf(t) values for c. 1800 Ma zircons for the Wondoan Hill Formation and the Tanami Region (Fig. 7b). The transition from the Bullita Group to the Wondoan Hill Formation is therefore interpreted to reflect a shift of basin provenance, from dominant northwesterly and northerly sources (e.g. Halls Creek and Pine Creek orogens) to southerly sources (e.g. Tanami Region and Aileron Province).
The two Stubb Formation samples show different zircon age spectra with differing age maxima (Fig. 4). Sample 1957131 is characterized by a major peak at c. 1780 Ma and two minor peaks at c. 1615 Ma and c. 1870 Ma, whereas sample MS-03 is dominated by zircon grains dated between c. 1830 and 1800 Ma. Potential original sources for sample 1957131 are theAileron Province where c. 1790 to 1770 Ma magmatic rocks are plentiful (Fig. 4). However, sample MS-03 has a zircon age spectrum that may reflect a mix of the Halls Creek / Pine Creek orogens as well as the Tanami Region (Fig. 4). These data suggest significant lateral or stratigraphic variation within this formation.
4.c. South Nicholson Group of the South Nicholson Basin
Detrital zircon data from the three undifferentiated South Nicholson Group samples (AY-01, SOU-01 and JR-01) were compared with the published data from Kositcin & Carson (Reference Kositcin and Carson2019) and Anderson et al. (Reference Anderson, Lewis, Jarrett, Carr, Henson, Carson, Southby and Munson2019).
The detrital zircon age spectra of the three undifferentiated South Nicholson Group samples, along with the published data from the Crow Formation and the Constance Sandstone, are all dominated by c. 1790 to 1700 Ma zircon grains (Fig. 5). These age spectra are comparable to the ages of rocks found in the Mount Isa and Aileron provinces (Fig. 5). The slightly evolved hafnium isotope signatures (ϵ Hf(t): −7 to +3) of those c. 1790–1700 Ma zircon grains are also consistent with these areas being sources (Fig. 8). In addition, the three undifferentiated samples, more or less, all preserve zircon grains with ages between c. 1600 and 1550 Ma. These zircon grains, together, yield a spread of ε Hf(t) values that form a vertical array (ranging from −9.5 to +2.8), which is comparable to zircon hafnium isotopic ranges from the eastern Mount Isa Province, Georgetown Province and South Australian Craton (SAC; Fig. 8a). We suggest that the samples from the South Nicholson Group mainly received detritus from Mount Isa Province, with possible contributions from the Aileron Province. Some detritus might also have been derived from the Coen–Georgetown regions in the northeastern NAC and SAC, which are interpreted to have been adjacent to one another during the Mesoproterozoic from palinspastic reconstructions (e.g. Li & Evans, Reference Li and Evans2011; Nordsvan et al. Reference Nordsvan, Collins, Li, Spencer, Pourteau, Withnall, Betts and Volante2018; Fig. 9).
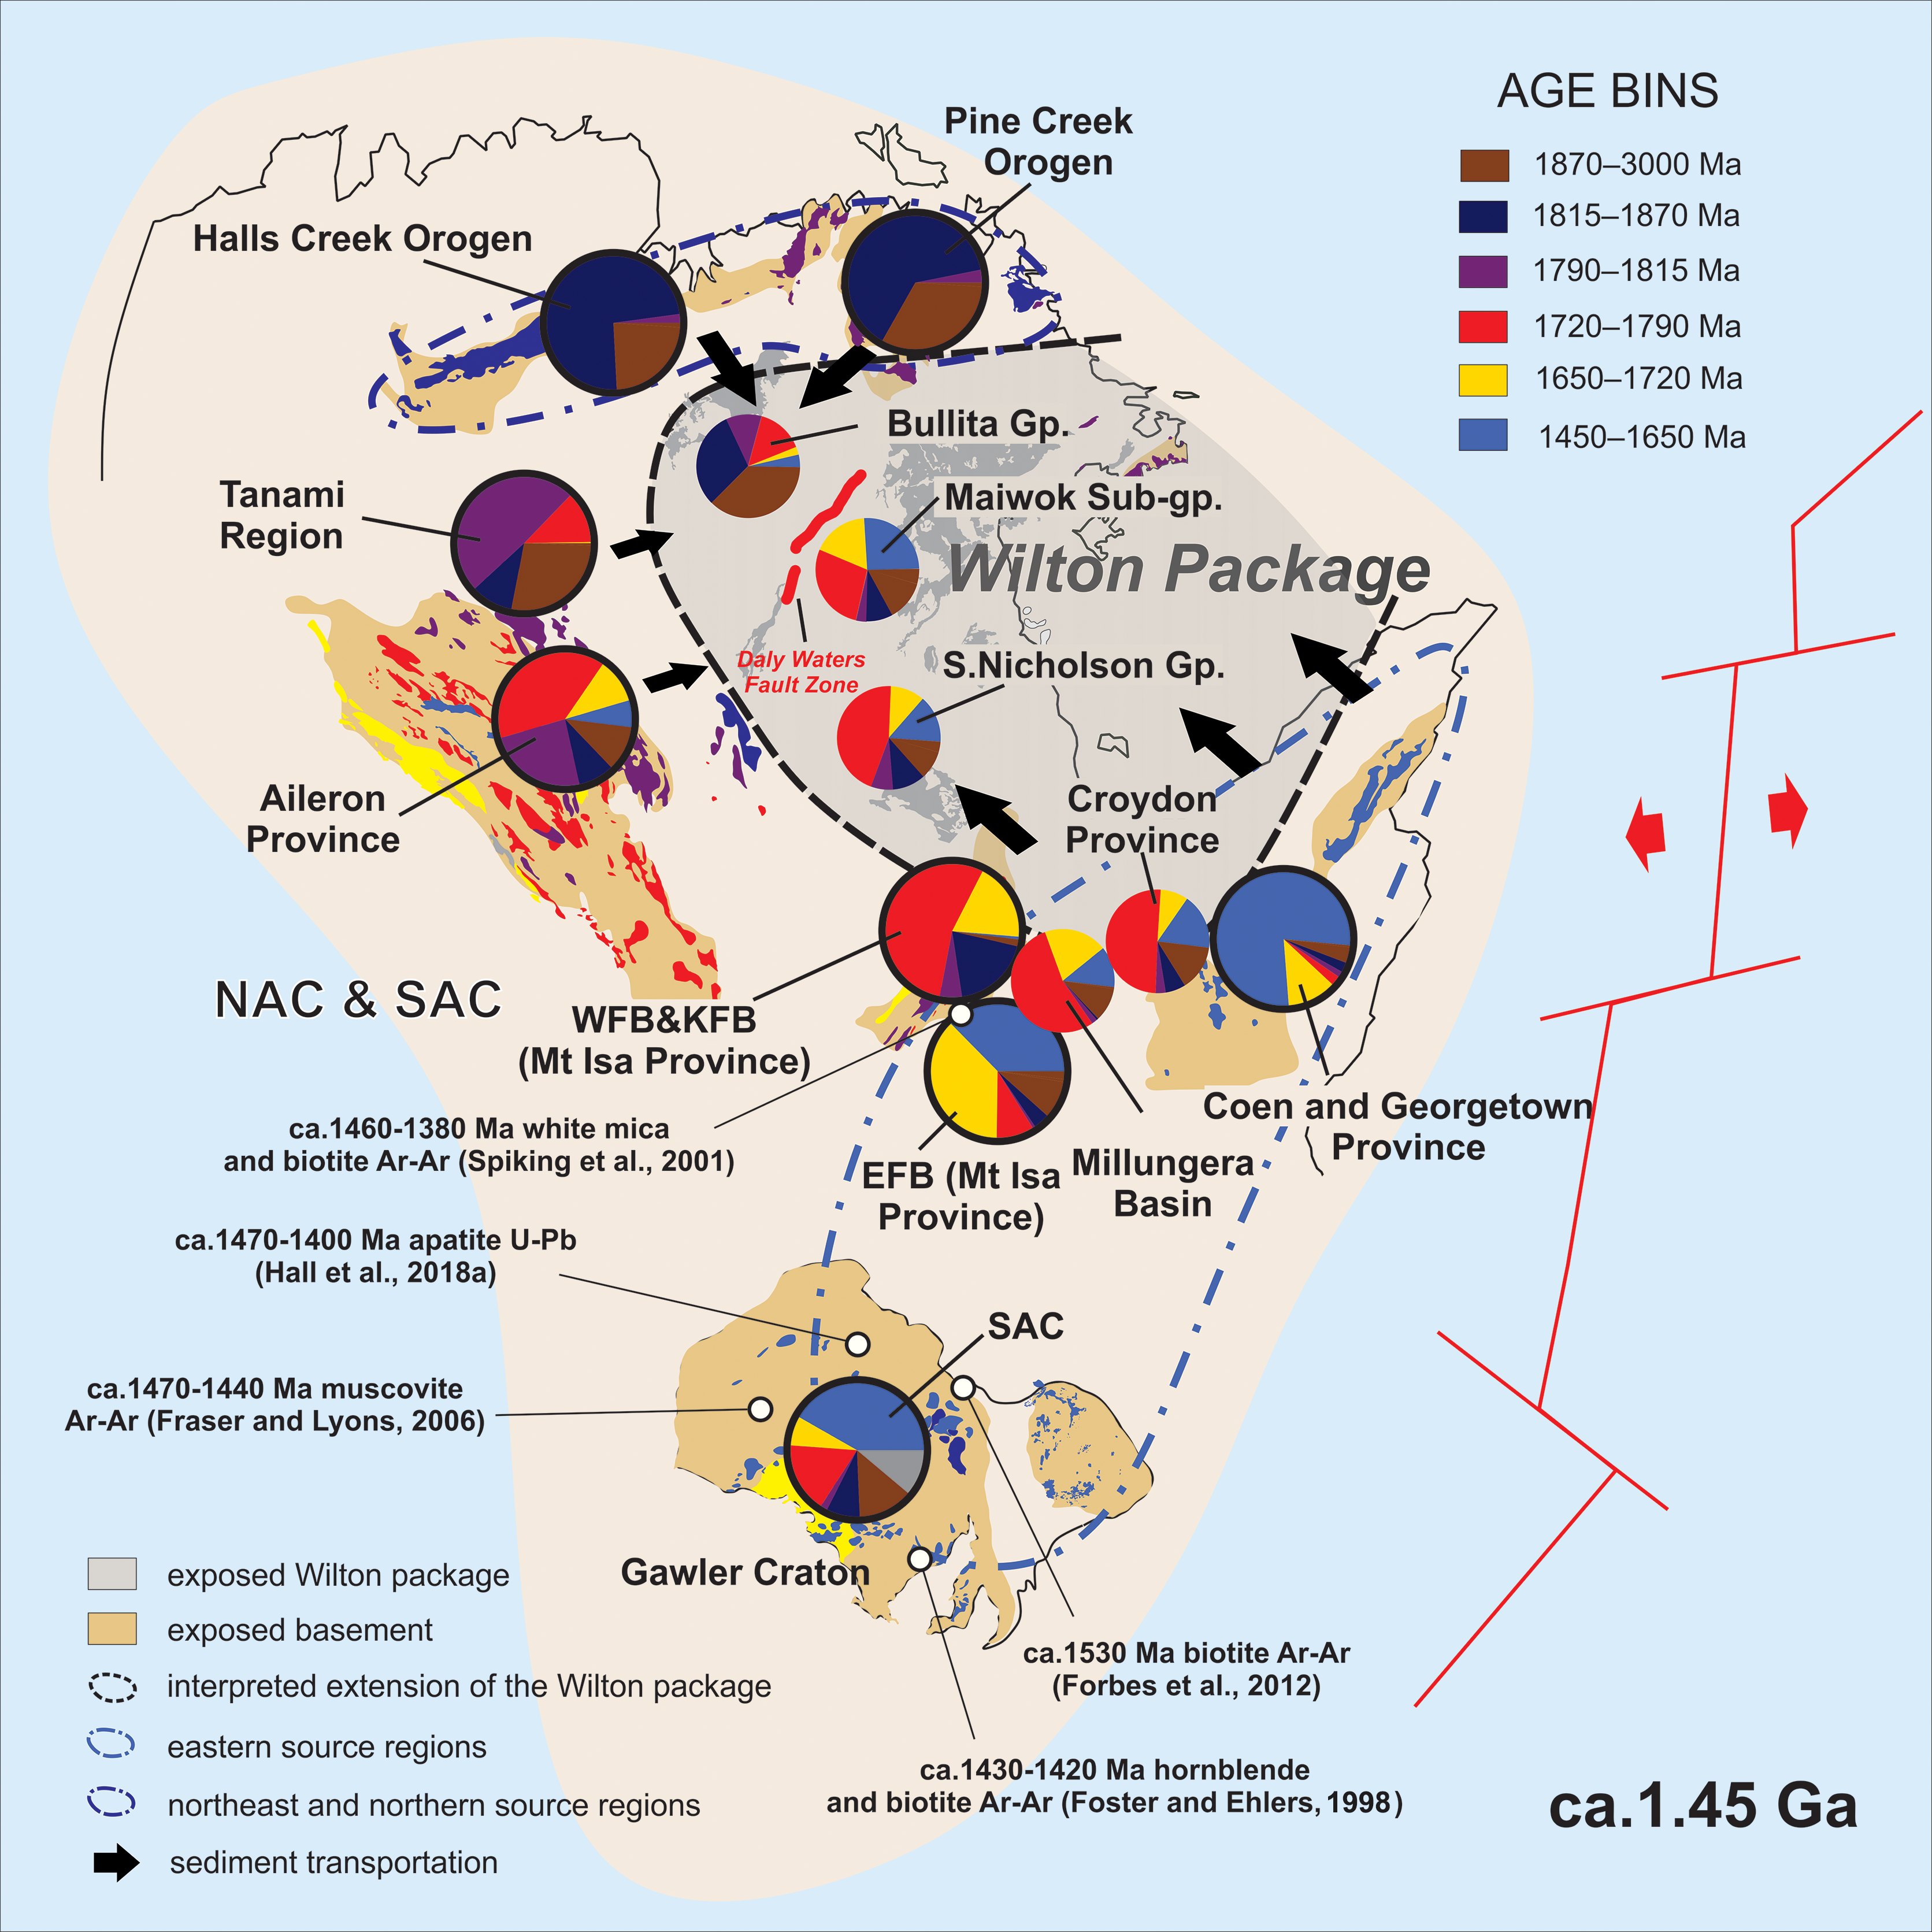
Fig. 9. Reconstruction of the Mesoproterozoic North Australian Craton (NAC) and South Australian Craton (SAC) at c. 1.45 Ga, modified after Yang et al (Reference Yang, Smith, Collins, Munson, Schoemaker, Nicholls, Cox, Farkas and Glorie2018, Reference Yang, Collins, Blades, Capogreco, Payne, Munson, Cox and Glorie2019). The proposed exhumation of eastern source regions during the separation between the NAC–SAC and Laurentia is shown. Compiled zircon age distributions from sedimentary units and potential sources plotted as pie diagrams, following the method proposed by Sharman et al. (Reference Sharman, Sharman and Sylvester2018). Large pie charts with black outlines are possible source regions; smaller pie charts with no outline are sediment age distributions in the Wilton package and coeval sedimentary sequences. Colours of pie charts and igneous units refer to age bins in the legend (see Fig. 10).
5. Discussion
5.a. Tectonic geography of the Roper Group
Detrital zircon U–Pb and hafnium isotope data suggest that the three sampled formations of the Collara Subgroup (Crawford Formation, Arnold Sandstone and Hodgson Sandstone; Figs. 3, 6) were predominantly sourced from the Mount Isa Province to the southeast and Aileron Province to the south. Their consistent zircon age spectra indicate little variation of provenance through time. However, the upward transition into the Maiwok Subgroup is marked by a distinct provenance variation, shown by an increase in c. 1.6–1.5 Ga zircon grains (Fig. 3). Yang et al. (Reference Yang, Smith, Collins, Munson, Schoemaker, Nicholls, Cox, Farkas and Glorie2018, Reference Yang, Collins, Blades, Capogreco, Payne, Munson, Cox and Glorie2019) interpreted these zircons to be sourced from the Eastern Fold Belt (EFB) of Mount Isa, or even more distal sources in the Coen–Georgetown region and the South Australian Craton (SAC). In the MDS plot (Fig. 10), the Collara Subgroup formations plot close to the Mount Isa (WFB&KFB) and Aileron provinces, whereas the Maiwok Subgroup samples, with more c. 1.6 Ga ages, are closer to the EFB of Mount Isa, Coen–Georgetown region and SAC. Cawood & Korsch (Reference Cawood and Korsch2008) and Payne et al. (Reference Payne, Hand, Barovich, Reid and Evans2009) suggest that the North and South Australia cratons, as well as the bulk of the Mawson continent, were joined at least until the early Mesoproterozoic, forming what is called the Diamantina Craton. Proterozoic plate reconstructions (Li & Evans, Reference Li and Evans2011; Nordsvan et al. Reference Nordsvan, Collins, Li, Spencer, Pourteau, Withnall, Betts and Volante2018) suggest that the Mount Isa, Coen–Georgetown and SAC regions lined the eastern margin of this Diamantina Craton in Mesoproterozoic times (Fig. 9). A few c. 1.6–1.5 Ga zircon grains occur in the Collara Subgroup, but a relative increase in the number of these grains within the Maiwok Subgroup samples suggests that easterly source terranes were more tectonically active at this time and were being exhumed and eroded. This exhumation is recorded by a series of low-temperature mineral cooling ages in the proposed source areas that are coeval with deposition of the Maiwok Subgroup. They include white mica and biotite 40Ar–39Ar ages of c. 1.46–1.38 Ga from the Eastern Fold Belt (Spikings et al. Reference Spikings, Foster, Kohn and O’Sullivan2001), apatite U–Pb ages of c. 1.47–1.40 Ga from the northern SAC (Hall et al. Reference Hall, Glorie, Reid, Collins, Jourdan, Danisik and Evans2018 a), apatite U–Pb ages of c. 1.66–1.54 Ga from the northeast SAC (Hall et al. Reference Hall, Glorie, Reid, Boone, Collins and Gleadow2018 b), biotite 40Ar–39Ar ages of c. 1.53 Ga from the NE Gawler Craton (Forbes et al. Reference Forbes, Giles, Jourdan, Sato, Omori and Bunch2012), and hornblende and biotite 40Ar–39Ar ages of c. 1.43–1.42 Ga from the SE Gawler Craton (Foster & Ehlers, Reference Foster and Ehlers1998; Fig. 9). Yang et al. (Reference Yang, Smith, Collins, Munson, Schoemaker, Nicholls, Cox, Farkas and Glorie2018, Reference Yang, Collins, Blades, Capogreco, Payne, Munson, Cox and Glorie2019) suggested that this exhumation may have been the result of rifting between the NAC–SAC terranes and Laurentia at c. 1.45 Ga. Relative uplift of the rift shoulders resulted in the eastern source areas becoming topographic highs; this modified the ancient geography and basin drainage system, so as to deliver considerably more detritus from these areas (highlighted by the c. 1.6–1.5 Ga zircon grains) to the Maiwok Subgroup.

Fig. 10. Joint non-parametric multidimensional scaling (MDS) plot (after Vermeesch, Reference Vermeesch2013) showing the relationships amongst analysed formations. Compiled zircon age distributions from sedimentary units and potential sources plotted as pie diagrams, following the method proposed by Sharman et al. (Reference Sharman, Sharman and Sylvester2018). The larger pie charts with black outlines are the potential source areas. Detrital zircon 207Pb/206Pb age data included in this study are from *Yang et al. (Reference Yang, Smith, Collins, Munson, Schoemaker, Nicholls, Cox, Farkas and Glorie2018, Reference Yang, Collins, Blades, Capogreco, Payne, Munson, Cox and Glorie2019), **Munson et al. (Reference Munson, Thompson, Zhukova, Meffre, Beyer, Woodhead and Whelan2018), ***Carson (Reference Carson2013), ****Kositcin & Carson (Reference Kositcin and Carson2017), #Nordsvan et al. (Reference Nordsvan, Collins, Li, Spencer, Pourteau, Withnall, Betts and Volante2018), ##Neumann & Kositcin (Reference Neumann and Kositcin2011), ###Anderson et al. (Reference Anderson, Lewis, Jarrett, Carr, Henson, Carson, Southby and Munson2019) and ####Kositcin & Carson (Reference Kositcin and Carson2019). SAC: South Australian Craton; WFB: Western Fold Belt (Mount Isa Province); KFB: Kathleen Fold Belt (Mount Isa Province); EFB: Eastern Fold Belt (Mount Isa Province); Fm: Formation; Sst: Sandstone; Gp: Group. Pie chart colours refer to age bins defined on the KDE plot of all near-concordant U–Pb age detrital age data (top).
5.b. Tectonic geography of Bullita and Tijunna groups
Provenance analysis suggests that the Bullita Group was mainly sourced from northerly and northwesterly sources (e.g. Pine Creek and Halls Creek orogens), whereas the Tijunna Group received detritus from source regions to the south of the basin (e.g. Tanami Region and Aileron Province; Fig. 1c). This provenance evolution is well reflected in a graph probability distribution plot (Fig. 11) following Eglington (Reference Eglington2018), which shows that the late Palaeoproterozoic age maxima for the younger formations gradually changes from c. 1.83 Ga to c. 1.80 Ga. This switch in provenance is demonstrated in an MDS plot (Fig. 10), in which the Bullita Group samples plot close to the Halls Creek and Pine Creek orogens, whereas the younger Tijunna Group samples, with higher proportions of c. 1.80 Ga zircon analyses, plot closer to the Tanami Region. This stratigraphic change in provenance is particularly evident when samples from individual drill cores are examined, which removes any possible spatial variation in source. Samples D02, D24, 1957143, D57 and 1957137 all came from core 99VRNTGSDD2, whereas samples MS-09, MS-06, MS-05 and MS-03 all came from core MSFD001 (Table 1). These two cores exhibit similar up-section trends from older samples derived from the Halls Creek and Pine Creek orogens to younger samples with closer affinities to the Tanami Region (Fig. 10). Further, in the MDS plot (Fig. 10), the Wondoan Hill Formation samples are relatively more clustered, compared to the underlying Bullita samples. This might highlight a consistent detrital input into the Wondoan Hill system and suggests that the deposition of this formation was laterally homogeneous and continuous. We interpret this homogeneity to represent uplift and erosion of the Tanami Region, swamping the basin with southerly-sourced sediments. Detrital zircon age spectra from the overlying Stubb Formation show a return to local heterogeneity, which may reflect the waning influence of southern sources, or perhaps the recycling of older sedimentary rocks (e.g. Bullita Group) during source area uplift.

Fig. 11. Graph probability distribution plot comparing the composed detrital zircon age spectra of formations from the Bullita and Tijunna groups. The plot was generated using the FitPDF program (Eglington, Reference Eglington2018). Probabilities are illustrated by the colour density. MDA: maximum deposition age; Gp: Group; Fm: Formation. Red line represents assigned maximum deposition age for each formation. Grey line represents the stratigraphic shifting of the dominant age peaks.
A similar stratigraphic southward shift in provenance is evident in the Maiwok Subgroup (Roper Group) samples from the Beetaloo Sub-basin. Yang et al. (Reference Yang, Smith, Collins, Munson, Schoemaker, Nicholls, Cox, Farkas and Glorie2018, Reference Yang, Collins, Blades, Capogreco, Payne, Munson, Cox and Glorie2019) used detrital zircon U–Pb and Hf data to suggest that formations in the lower parts of the subgroup (e.g. Bessie Creek Sandstone, Velkerri Formation and Moroak Sandstone) were sourced from southeasterly and easterly sources (e.g. Mount Isa Region, Coen–Georgetown region and SAC), whereas the Kyalla Formation at the top of the Maiwok Subgroup received detritus from the Aileron Province to the south of the basin (Figs 9, 12). Yang et al. (Reference Yang, Smith, Collins, Munson, Schoemaker, Nicholls, Cox, Farkas and Glorie2018, Reference Yang, Collins, Blades, Capogreco, Payne, Munson, Cox and Glorie2019) suggested that this shift to southern sources may be related to a closure of the ocean that separated the combined NAC–SAC from the West Australian Craton (WAC) (named the Mirning Ocean; Fig. 12; Kirkland et al. Reference Kirkland, Smithies and Spaggiari2015). We hypothesize that during its closure, the present-day southern margin of the NAC was uplifted and eroded. These regions became the southern sources (e.g. Aileron Province and Tanami Region), which fed sediment into the greater McArthur Basin through a north-flowing drainage system (Fig. 12). The closure of this ocean is marked by c. 1.40 to 1.20 Ga subduction-related magmatism (Kirkland et al. Reference Kirkland, Smithies and Spaggiari2015; Spaggiari et al. Reference Spaggiari, Kirkland, Smithies, Wingate and Belousova2015; Morrissey et al. Reference Morrissey, Payne, Hand, Clark, Taylor, Kirkland and Kylander-Clark2017), orogenesis (Johnson et al. 2013; Howard et al. Reference Howard, Smithies, Kirkland, Kelsey, Aitken, Wingate, de Gromard, Spaggiari and Maier2015) and metamorphism (Anderson, Reference Anderson2015; Morrissey et al. Reference Morrissey, Payne, Hand, Clark, Taylor, Kirkland and Kylander-Clark2017) that occurred along the boundary between the WAC and the NAC–SAC (Fig. 12).

Fig. 12. Reconstruction of Australia at c. 1.32 Ga. The reconstruction shows the uplift and exposure of southern sources (e.g. the Aileron Province and Tanami Region) during the amalgamation of the West Australian Craton (WAC) with the North and South Australian cratons (NAC–SAC). This allowed them to become sources for the upper Maiwok Subgroup and the Tijunna Group (modified after Yang et al. Reference Yang, Collins, Blades, Capogreco, Payne, Munson, Cox and Glorie2019). Compiled zircon age distributions from sedimentary units and potential sources plotted as pie diagrams, following the method proposed by Sharman et al. (Reference Sharman, Sharman and Sylvester2018). Large pie charts with black outlines are possible source regions; smaller pie charts with no outline are sediment age distributions in the Wilton package and coeval sedimentary sequences. Colours of pie charts and igneous units refer to age bins in the legend (see Fig. 10).
The c. 1.40 to 1.35 Ga ocean closure/subduction related arc-volcanism (Kirkland et al. Reference Kirkland, Smithies and Spaggiari2015) is temporally consistent with the juvenile neodymium isotopic compositions in the middle Velkerri Formation (Cox et al. Reference Cox, Jarrett, Edwards, Crockford, Halverson, Collins, Poirier and Li2016, Reference Cox, Sansjofre, Blades, Farkas and Collins2019). This is argued to represent the erosional products of the arc volcanic rocks, while the basin provenance shifted from predominately eastern sources to southern sources. The delivery of the arc volcanic detritus is suggested to have resulted in high nutrient supply to the basin, enhancing the biological primary productivity, and subsequent high organic carbon burial within the middle Velkerri Formation (Cox et al. Reference Cox, Jarrett, Edwards, Crockford, Halverson, Collins, Poirier and Li2016, Reference Cox, Sansjofre, Blades, Farkas and Collins2019).
5.c. Basin correlations within the Wilton package
The youngest detrital zircon grains from the undifferentiated South Nicholson Group samples have 207Pb/206Pb dates of 1519 ± 51 Ma (sample JR-01), 1550 ± 51 Ma (sample SOU-01) and 1542 ± 69 Ma (sample AY-01). This constrains the depositional ages of the sampled units to be later than c. 1550 Ma, which is consistent with interpreted maximum depositional ages determined for the Playford Sandstone and Crow Formation (1600 ± 20 Ma and 1483 ± 12 Ma respectively; Kositcin & Carson, Reference Kositcin and Carson2019), and suggests that the undifferentiated units might represent subsurface extensions of these formations. These age constraints for the South Nicholson Group are also comparable to those for the Collara Subgroup, which was deposited after c. 1.5 Ga (Jackson et al. Reference Jackson, Sweet, Page and Bradshaw1999; Munson, Reference Munson2016).
In the MDS plot (Fig. 10), the Collara Subgroup, Maiwok Subgroup and the South Nicholson Group samples form a tight group that is distinct from the Birrindudu Basin formations. They are more similar to the Mount Isa Province and the Aileron Province. In the ϵ Hf(t) vs age plots (Figs 6, 8), the South Nicholson Group and Roper Group data (including the Collara and Maiwok subgroups) overlap with each other. These similarities in age and isotope geochemistry strongly support a correlation between the Roper and South Nicholson groups and suggest that there was a sedimentary pathway connection between the McArthur–Beetaloo basins and the South Nicholson Basin at the time of deposition of these groups.
The Inorunie Group of the Croydon Province (Fig. 1), to the east of the Mount Isa Province, is a c. 1500 Ma siliciclastic succession that is remarkably similar to the Wilton package. Sandstones from this group are interpreted to have been sourced from the Mount Isa Province (Figs 1, 10; Budd et al. Reference Budd, Wyborn and Bastrakova2002; Withnall & Hutton, Reference Withnall, Hutton and Jell2013; Nordsvan et al. Reference Nordsvan, Collins, Li, Spencer, Pourteau, Withnall, Betts and Volante2018) and were deposited in a basin that may be coeval to, and in a similar tectonic setting to, the Roper and South Nicholson basins (Fig. 10). The poorly known Millungera Basin (Fig. 1) may also be an extension of this depositional system, on the basis of detrital zircon chronology (Fig 10). In the probability distribution plot (Fig. 13), the sedimentary rocks from the Inorunie Group of the Croydon Province and the Millungera Basin exhibit significant consistency with the samples from the Roper and South Nicholson groups.
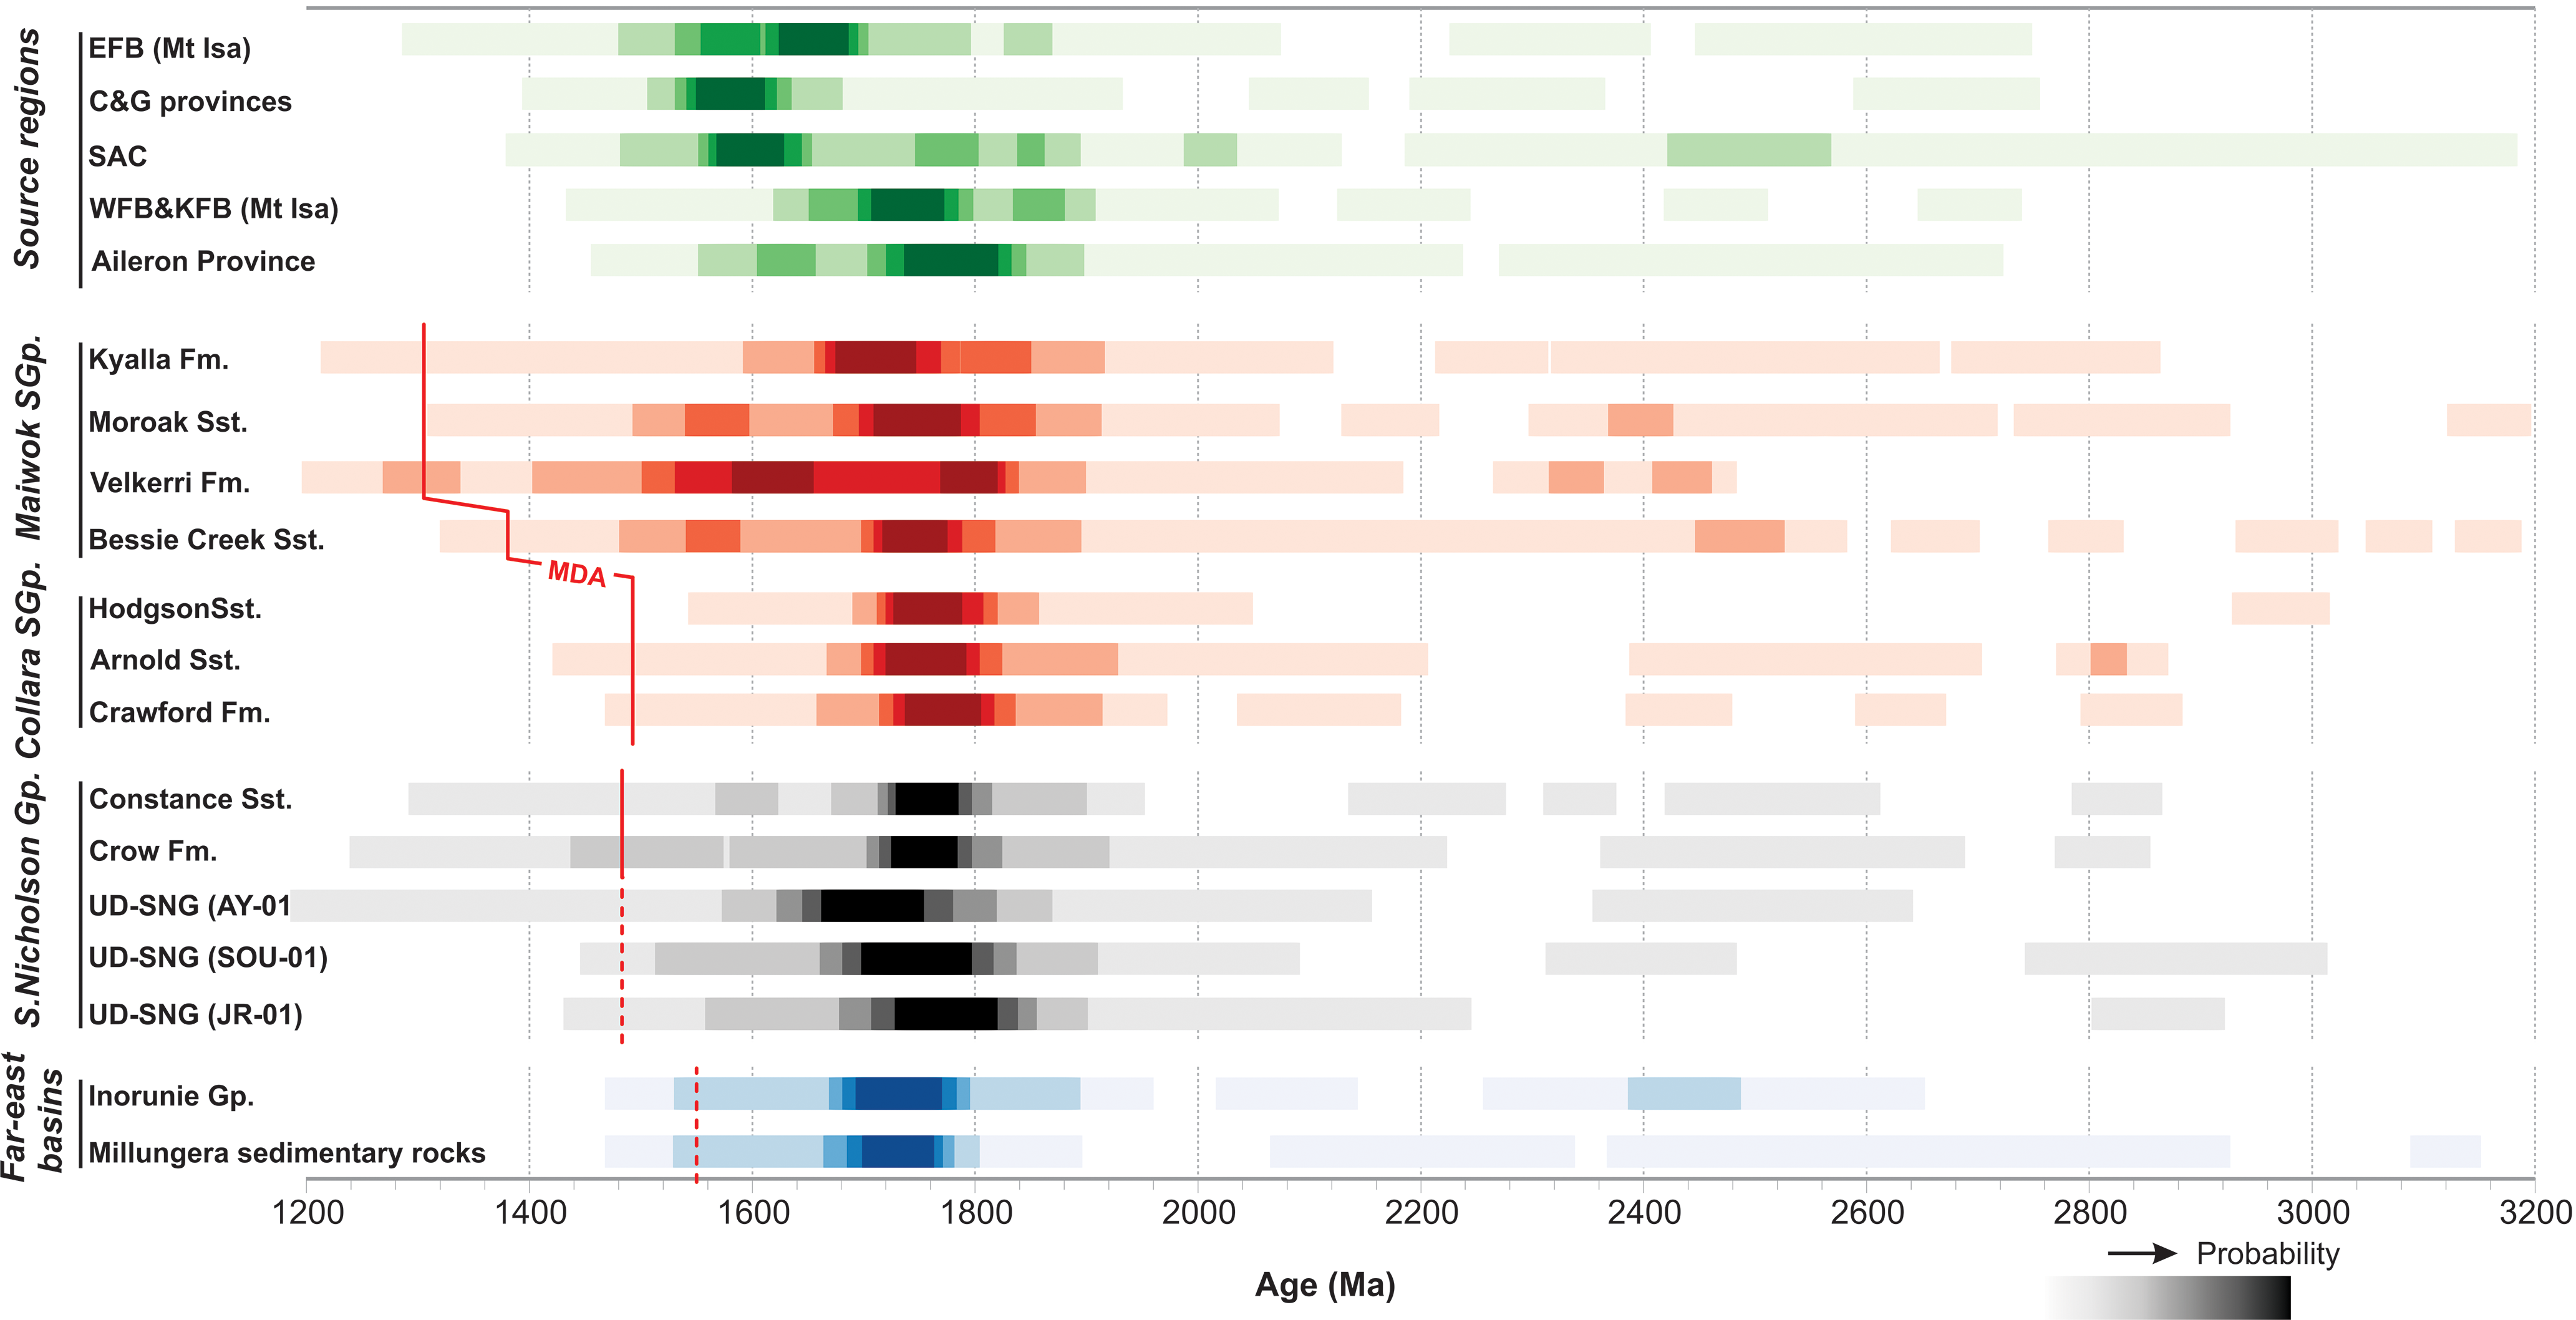
Fig. 13. Graph probability distribution plot of the composite detrital zircon age spectra of formations from the Maiwok Subgroup, Collara Subgroup, South Nicholson Group, Inorunie Group and sedimentary rocks from the Millungera Basin (Fig. 1), illustrating the provenance similarity between these basins. The plot was generated using the FitPDF program (Eglington, Reference Eglington2018). Probabilities are illustrated by the colour density. MDA: maximum deposition age; Gp: group; Fm: formation. Red lines represent assigned maximum deposition age for each formation. Red dashed lines represent possible maximum deposition age constraint.
The provenance of the Roper and South Nicholson groups (Beetaloo Sub-basin and South Nicholson Basin) are quite different to those of the coeval Bullita and Tijunna groups (Birrindudu Basin). The Birrindudu Basin rocks were sourced from the Halls Creek – Pine Creek orogens and Tanami–Aileron regions, whereas the eastern sedimentary formations were sourced from the Mount Isa, Coen–Georgetown, SAC and Aileron regions (to the east and southeast). The MDS plot clearly shows this dissimilarity (Fig. 10). We suggest that the ancestral Daly Waters Fault Zone was a palaeo-bathymetric high at the time and divided the two parts of the greater McArthur Basin (Figs 1 and 2). This interpretation is supported by seismic data that shows considerable thickness and geometric differences between the Wilton package west and east of the Daly Waters Fault Zone (Williams, Reference Williams2019; Figs 1, 2). This bathymetric high restricted sediment mixing across it, isolating the Birrindudu Basin in the west from the eastern Beetaloo Sub-basin and South Nicholson Basin.
6. Conclusions
Coupled detrital zircon U–Pb age and Lu–Hf isotope data presented in this study of the North Australian Craton from c. 1.55 to 1.31 Ga provide new constraints on inter-basinal and intra-basinal correlations and sedimentary provenance. This study illustrates the dynamic interactions between sedimentary and tectonic processes, and enhances palaeogeographic reconstructions.
We suggest that the Collara Subgroup (lower Roper Group) was sourced from the Mount Isa Province and Aileron Province. Rifting between the NAC–SAC and Laurentia, after the deposition of the Collara Subgroup, caused uplift in the east (e.g. the Eastern Fold Belt (EFB) of the Mount Isa Province, and the Coen–Georgetown region and palinspastically adjacent South Australian Craton), which shed detritus west into the lower Maiwok Subgroup depositional system.
Provenance consistency between the South Nicholson Group and the Roper Group (of the South Nicholson Basin and Beetaloo Sub-basin, respectively) indicates that they were sourced from similar areas and are likely part of the same depositional system (linked basins). We note that the c. 1.5 Ga Inorunie Group of the Croydon Province, and the Millungera Basin succession are possible correlatives of the Wilton package and have similar-aged detritus, suggesting they may form an analogous coeval depositional system in a comparable tectonic setting, but to the east of the then uplifted Mount Isa Province.
The Bullita and Tijunna groups of the Birrindudu Basin have a different provenance than the Roper and South Nicholson groups. Provenance analysis shows that the Bullita Group was sourced from northeastern and northern sources (Halls Creek Orogen and Pine Creek Orogen), whereas the Tijunna Group received more detritus from southern sources (Tanami Region and Aileron Province). Provenance differences between the Birrindudu Basin and eastern Beetaloo Sub-basin support interpretations that the intervening meridional Daly Waters Fault Zone was a significant positive bathymetric feature at the time (Williams, Reference Williams2019).
Despite this largely independent early depositional history, stratigraphically higher formations within both the Beetaloo Sub-basin and Birrindudu Basin record southward shifts in sediment source areas. We suggest that both areas were buried by sediment eroded from the south during the amalgamation of the NAC–SAC and the WAC at c. 1.35 to 1.28 Ga. This resulted in uplift of the southern margin of the NAC and modification of the basin geography and drainage system. It is likely that the subduction and closure of the Mirning Ocean is responsible for uplift and erosion along the southern part of the NAC. This engendered northern-flowing river systems that transported sediment eroded from this region into both the Birrundudu Basin and the Beetaloo Sub-basin.
Acknowledgements
This research was funded by an Australian Research Council Linkage Project LP160101353, which is partnered by the Northern Territory Geological Survey, SANTOS Ltd, Origin Energy and Imperial Oil and Gas. This contribution also forms MinEX CRC output 2020/60. It is a contribution to IGCP Projects 628 (Gondwana Map) and #648 (Supercontinent Cycles and Global Geodynamics). ME Bickford and an unnamed reviewer are acknowledged and thanked for their constructive comments, which greatly improved the paper.
Conflict of interest
None.
Supplementary material
To view supplementary material for this article, please visit https://doi.org/10.1017/S0016756820001223


