


Introduction
It is predicted that the atmospheric CO2 concentration will increase to 550–700 ppm by the mid of this century and 650–1200 ppm by the end of this century (Higgins et al., Reference Higgins, Kurbatov, Spaulding, Brook, Introne, Chimiak, Yan, Mayewski and Bender2015). A rise in atmospheric greenhouse gases (GHGs) concentration will increase the mean global temperature by 2.5°C during 2050 and 6.4°C during the end of this century (IPCC, 2007). A rise in atmospheric CO2 and temperature will increase the water retention potential of atmosphere and humidity (Marvel et al., Reference Marvel, Biasutti, Bonfils, Taylor, Kushnir and Cook2017). Climate change negatively influences the soil biological function affecting agriculture and environment. Climate change affects soil biodiversity and enhances C loss and GHG emission. To mitigate climate change, agricultural practices are now emphasized on conservation agriculture and organic fertilizer input. For example, conventional agricultural practices such as intensive chemical fertilizer lead to biodiversity loss, soil organic matter loss, soil erosion and soil physical degradation (Thierfelder et al., Reference Thierfelder, Mwila and Rusinamhodzi2013). Organic fertilizer is recommended for sustainable agriculture (Mäder et al., Reference Mäder, Fliessbach, Dubois, Gunst, Fried and Niggli2002). Organic fertilizer enhances soil fertility and microbial diversity at all levels and makes soils less susceptible to degradation (McDaniel et al., Reference McDaniel, Tiemann and Grandy2014). Thus, organic input improves soil health (the ability of soil to function) and productivity (ecosystem services) by increasing the soil organic matter (carbon, nitrogen, humus and other nutrients) levels (Bennett and Cattle, Reference Bennett and Cattle2013; Vieweger and Döring, Reference Vieweger and Döring2014).
It is also likely that climate change may affect soil biological function relevant to pesticide biodegradation, an important function of soil for environmental sustainability. Due to intensive agriculture to meet the global food demand, the use of insecticide is increasing alarmingly. Among various insecticide, chlorpyrifos (O, O-diethyl O-3,5,6-trichloro-2-pyridyl phosphorothioate) is widely used since 1965 for the treatments of crops, lawns and ornamental plants (Gomez, Reference Gomez2009). This broad-spectrum insecticide is effective against mosquitoes (larvae and adults), flies and ecto-parasite of cattle and sheep (Liu et al., Reference Liu, Xu, Zhang and Liu2005). The insecticide is neurotoxic as it suppresses acetylcholinesterase (Eissa et al., Reference Eissa, Mahmoud, Massoud, Ghanem and Gomaa2014). Exposure to chlorpyrifos may lead to clinical effects including runny nose, tears, drooling, sweating, headache, nausea, dizziness and neurological problems in human beings (Guodong et al., Reference Guodong, Pei, Ying, Jun, Yu, Xiaojin, Rong, Guoquan and Xiaoming2012). Chlorpyrifos inhibits plant growth-promoting microorganisms, those producing growth hormone (indole acetic acid) and solubilize phosphorous (Akbar and Sultan, Reference Akbar and Sultan2016). Intensive use of chlorpyrifos in the agriculture leads to the contamination of soil, air and water resources (both ground and surface) (Yu et al., Reference Yu, Fang, Wang, Wu, Shan and Yu2006). In natural environment, chlorpyrifos is biodegraded by microorganisms including heterotrophic bacteria and actinomycetes. The biodegradation products are diethylthiophosphoric acid and 3,5,6-trichloro-2-pyridinol (Rayu et al., Reference Rayu, Nielsen, Nazaries and Singh2017). The half-life of chlorpyrifos generally ranges between 10 and 120 days in soil but can be up to 1 year depending on abiotic factors such as temperature, moisture, pH, etc. (Singh and Walker, Reference Singh and Walker2006).
Climate change influences soil ecosystem by impacting the microbial biomass, diversity and their metabolic activities (Romero-Olivares et al., Reference Romero-Olivares, Allison and Treseder2017). Fertilizer regimes also shape soil biological attributes. Hence, the soil functions such as pesticide degradation potential under the interactive influence of climate and fertilizer need to be revisited. Information is limited on the persistence of chlorpyrifos under the influence of climate factors and fertilizer regime. The current experiment aims to unravel the interactive effect of climate factors and fertilizer regime on chlorpyrifos biodegradation in a tropical vertisol. Soil microbial groups belonging to bacteria and actinomycetes are relevant to pesticide biodegradation. It is hypothesized that adverse climate factors and inorganic fertilizer affect the biodegradation of chlorpyrifos and the abundance of microbial groups, while organic fertilizer may alleviate the climate impact. To examine hypotheses, the biodegradation of chlorpyrifos and the abundance of bacteria and actinomycetes were evaluated in response to climate factors and fertilizer regimes, in a tropical soil (vertisol) ecosystem.
Materials and methods
Study area
The experiment was undertaken at the experimental fields of national network project on organic farming at the Indian Institute of Soil Science, Bhopal, Madhya Pradesh, India (23.30N, 77.40E). The location has a humid subtropical climate, with a hot summer and a humid monsoon season. It experiences southwestern monsoon rain in July–September. During the course of the study, the mean annual temperature was about 25°C with the highest about 44°C during the mid of May and the lowest about 3°C in January. The average precipitation was about 1200 mm, and humidity 55–60%.
Experimental design, cultivation practice and fertilizer application
The field experiment was carried out in a randomized block design with three replicates and four treatments. Treatments were (1) un-amended control, (2) inorganic (chemical source), (3) integrated (both inorganic and organic) and (4) organic. The inorganic sources of N, P and K were urea (NH2)2CO, single super phosphate Ca (H2OP4)2.H2O and muriate of potash KCl, respectively. Organic fertilizer was a mix consisting of cow dung manure (CDM), vermi compost (VC) and poultry manure (PM). The fertilizer mixture was prepared on the basis of N equivalent, 33.33% N from CDM, VC and PM. Cow dung manure, VC and PM had 0.84, 0.97 and 1.97% N, respectively, of their dry weight biomass. Control treatments received no fertilizer. The inorganic treatment received urea (80 kg N/ha), single super phosphate (17.5 kg P/ha) and muriate of potash (33.2 kg K/ha). Integrated treatment was amended with inorganic fertilizers (40 kg urea N/ha + 8.5 kg single super phosphate as P/ha + 16.6 kg muriate of potash as K/ha) + organic fertilizers (4762 kg CDM/ha + 4123 kg VC/ha + 2030 kg PM/ha). The organic fertilizers were applied at 40 kg N/ha based on their N content. The organic fertilizer treatment received only organic fertilizers (9524 kg CDM/ha + 8247 kg VC/ha + 4060 kg PM/ha). Organic fertilizers were applied at 80 kg N/ha based on their N content. Fertilizers were amended as a single application at the date of sowing. Soybean (Glycine max L.) and wheat (Triticum aestivum L.) were grown in summer and winter, respectively. Wheat variety HI 8498 and soybean variety JS 335 were planted in a spacing (cm) of 22.5 × 5 and 45 × 5 with seed rate 100 and 80 kg/ha, respectively. Fields were managed the same way since 2004.
Sampling and preparation of soil
Randomly, three soil cores (two from corners and one from the centre of the field) were collected from the topsoil (0–15 cm) of soybean fields during vegetative phase (60 days after sowing). Each soil core was of 5 cm in diameter and 15 cm in depth. Soil cores were collected close to the root (within 3–5 cm) of the plant. Three soil cores were mixed completely to get a composite fresh sample of each plot. After removing plant roots and large stones followed by sieving with 2 mm mesh, soil samples were used in the experiment within 48 h of sampling. Sub-samples for each soil sample was separated to measure gravimetrical water content and soil chemical properties.
Soil properties
Soil samples from the four treatments comprising none, inorganic, integrated and organic were estimated. The texture of soil was clayey and classified as Typic Haplustert with sand 15.2%, silt 30.3%, clay 54.5% irrespective of treatments. Soil pH of the four treatments was 8.4, 7.89, 8.0 and 8.09, respectively. Electrical conductivity (EC) was measured in a 1:2.5 soil water suspension. The EC of the four treatments was 0.22, 0.26, 0.22 and 0.20, respectively. Organic carbon (Org C) was determined by wet digestion method (Walkley and Black, Reference Walkley and Black1934). Organic C (%) was 0.55, 0.58, 0.70 and 0.93, respectively. Available N (Avl N) was determined by the Kjeldahl method. Available N (kg/ha) of the treatments was 186, 228, 226 and 280, respectively. Bulk density (BD) (g/cm3) was estimated by weighing soil samples of specific volume from the fields (VandenBygaart et al., Reference VandenBygaart, Bremer, McConkey, Janzen, Angers, Carter, Drury, Lafond and McKenzie2011). The BD of soil samples were 1.33, 1.36, 1.28 and 1.20, respectively. Water-stable aggregates (WSAs) of soil samples were determined by using a wet sieving method using Yoder apparatus (Yoder, Reference Yoder1936). The WSA values (%) of the inorganic, integrated and organic amended soils were 53.77, 69.70 and 71.90, respectively. The mean weight diameter (MWD) of the aggregates in the soil samples was determined following the protocol as described elsewhere (Van Bavel, Reference Van Bavel1949). The MWD (mm) of inorganic was 0.43, integrated 0.66 and organic 0.74.
Microcosms set up to study chlorpyrifos degradation
The experiment used a factorial design with four factors. These factors were CO2 concentration, temperature, soil moisture-holding capacity (MHC) and fertilizers. The concentration of CO2 was 400 or 800 ppm. The temperature was 25 or 45°C. Fertilizer regimes were none, inorganic, integrated or organic. Soil MHC was 60% MHC or 100% MHC. Moisture-holding capacity of the soil was determined by standard gravimetrical procedure. Soil MHC was attained by adding the required amount of double-distilled water. Each factorial combination (2 CO2 concentration × 2 temperature × 2 MHC × 4 fertilizer regimes) was replicated three times with a total of 96 experimental units (microcosms).
Microcosms were prepared following the protocol as described elsewhere (Kollah et al., Reference Kollah, Dubey, Parasai, Saha, Gangil and Mohanty2015). Each microcosm was constituted of 130 ml vial with 20 g soil treated with chlorpyrifos as described below. A 1000 ppm stock solution of chlorpyrifos (Sigma Aldrich, St. Louis, MO, USA) was prepared using HPLC grade acetonitrile (Sigma Aldrich). The chlorpyrifos stock of 0.2 ml was added to 130 ml pre-sterilized serum vials. These vials represented the treatments of 10 ppm (w/w) chlorpyrifos. Similarly, the vials added with 0.2 ml pure acetonitrile served as the treatment of 0 ppm chlorpyrifos. To nullify the effect of solvent on microbial activity, vials were kept open overnight to evaporate acetonitrile completely. To each vial, 20 g portion of the soil was placed. The soils were moistened with sterile distilled water to provide 60 and 100% MHC and allowed to equilibrate with the ambient air for 3 days in the dark in an incubator at 30 ± 2°C. The contents of the vials were mixed thoroughly, capped with rubber septa and sealed using aluminium crimp seal.
Vials were incubated at two different temperatures of 25 and 45°C in separate biological oxygen demand incubators (Metrex scientific instruments pvt ltd, N Delhi, India). CO2 evolution was monitored by a gas chromatograph (GC 2010 CIC, Baroda) for 3–4 days till CO2 evolution was stabilized. Headspace of the vials was maintained with a CO2 concentration of ambient (400 ± 10) and 800 ± 20 μmol/mol (ppm) by replacing the appropriate amount of air in the headspace with an equivalent quantity of 0.2% CO2 in the air. Headspace CO2 concentration was monitored every alternative day and maintained at a specified concentration for a period of 1 month. Vials were shaken at 100 rpm (rotation per minute) for 8 h per day.
Chlorpyrifos extraction and analysis
Soil samples of about 5 g were taken out from the vials at different incubation period (0, 15, 30 days). Chlorpyrifos was extracted following a protocol as described earlier (Mallick et al., Reference Mallick, Bharati, Banerji, Shakil and Sethunathan1999). The soil samples were transferred to a 250 ml volumetric flask and 25 ml of distilled water was added to soils maintained at 60% MHC. Acetone (50 ml) was added and flasks were shaken for 1 h in an orbital shaker. In case of soil samples maintained at 100% MHC, the extraction procedure was similar as described above except that distilled water was not added. After 1 h of equilibration with acetone, 20 ml of hexane was added to these flasks and the contents were again shaken for 1 h. To the flasks, sodium sulphate (2% of the total) was added and the volume made up to 250 ml with distilled water. Upper layer (~5 ml) of hexane was taken out into a sterile glass vial and the vials were kept open overnight to evaporate at room temperature. The residue was dissolved in 1 ml acetonitrile and used for analysis. Chlorpyrifos was analysed in an HPLC (High Performance Liquid Chromatography) with recovery rate ≥95% and repeatability of better than 0.5%. The analysis was performed at a wavelength of 325 nm using the mixture of acetonitrile and 0.1% of aqueous ortho-Phosphoric acid at a ratio of 75:25 as the mobile phase with a flow rate of 1 ml/min. The HPLC system used was a Varian Prostar instrument equipped with degasser, quaternary pump, UV detector connected to a Rheodyne injection system (20 μl loop). The stationary phase was comprised of Lichrospher on C-18-packed stainless steel column (250 mm × 4 mm i.d). Degradation rate was estimated from the slope of the first-order curve, plotted chlorpyrifos concentration and incubation period.
DNA extraction
DNA was extracted from 0.5 g field soil samples using the ultraclean DNA extraction kit (MoBio, USA) according to the manufacturer's instructions. The DNA concentrations were determined in a biophotometer (Eppendorf, Germany) by measuring absorbance at 260 nm (A260), assuming that 1 A260 unit corresponds to 50 ng of DNA per μl. DNA extraction was further confirmed by electrophoresis on a 1% agarose gel. The extracted DNA was dissolved in 50 μl TE buffer and stored at −20°C until further analysis.
Real-time PCR quantification of eubacteria and actinomycetes
Real-time PCR was performed on a Step one plus real time PCR (ABI, USA) to quantify the representative microbial species. Reaction mixture was prepared with 2 μl of DNA template, 10 μl of 2X SYBR green master mix (Affymetrix, USA), 200 nM of primer (GCC Biotech, N Delhi, India). Final volume of the PCR reaction mixture was made to 20 μl with PCR grade water (MP Bio, USA). Primers targeting 16S rRNA gene of eubacteria and 16S rRNA gene of actinomycetes were used to quantify the microbial abundance. The primers (5′–3′) for eubacteria were 1F (CCT ACG GGA GGC AGC AG) and 518R (ATT ACC GCG GCT GCT GG) (Baek et al., Reference Baek, Park, Oh, Yoon and Kim2010); actinomycetes Act235 F (CGC GGC CTA TCA GCT TGT TG) and Act878R (CCG TAC TCC CCA GGC GGG G) (Jafari et al., Reference Jafari, Behroozi, Farajzadeh, Farsi and Akbari-Noghabi2014). Quantification of microbial genes was carried out by real-time PCR approach targeting the functional groups. Thermal cycling was carried out by an initial denaturizing step at 94°C for 4 min, 40 cycles of 94°C for 1 min, target-specific annealing temperature for 30 s, 72°C for 45 s; final extension carried out at 72°C for 5 min. Annealing temperature for 16S rRNA of bacteria was 50°C, and for 16S rRNA of actinomycetes was 52°C. Fluorescence was measured during the elongation step. Data analysis was carried out with Step one plus software (ABI) as described in the user's manual. The cycle at which the fluorescence of the target molecule number exceeded the background fluorescence (threshold cycle [C T]) was determined from the dilution series of target DNA with defined target molecule amounts. C T was proportional to the logarithm of the target molecule number. The quality of PCR amplification products was determined by melting curve analysis with a temperature increase of 0.3°C per cycle. Standards for the 16S rRNA of bacteria and actinomycetes were made from the series of tenfold dilutions of purified amplified products and data presented as the number of gene copies cells per gram of soil.
Statistical analysis
All statistical analyses were carried out using the ‘agricolae’ and ‘vegan’ packages of the statistical software R (2.15.1) (Ihaka and Gentleman, Reference Ihaka and Gentleman1996). The result of the experiments was presented as arithmetic means of triplicate samples. Significance difference among the treatments was tested by Tukey HSD at α = 0.05. Values proceeded with similar letters were not significantly different. The effect of different factors on chlorpyrifos degradation and the abundance of the microbial population in soil was tested by ANOVA using aov command. Low P value indicated a significant impact of the factors on the variables. Pearson product moment correlation between the soil parameters and the degradation rate and microbial abundance was estimated and presented with the level of significance. Pearson coefficient correlations were estimated using the cor.test (x,y) command. Linear regression model was used to analyse the relationship between chlorpyrifos degradation rate and microbial abundance. Regression analysis was carried out using the lm (x~y) command of the R console. Principal component analysis (PCA) was presented as a two-dimensional ordination biplot. The biplot exhibits the relative significance of the vectors (factors) and variables. Principal component analysis was computed by prin.comp command of the ANOVA data. Isolates were clustered on the basis of their carbohydrate metabolism pattern.
Results
Soil physico-chemical properties
Physical and chemical properties of the soil samples varied with different fertilizer treatments. Soil pH varied from 7.93 to 8.20, while EC remained between 0.20 and 0.26 dS/m. Soil Org C content was 0.54% in un-amended control soil, while in the organic amended field, it was 0.93%. Similarly, Avl N in un-amended control was 184 kg/ha, and 280 kg/ha in the organic amended field. Soil BD of soil samples varied widely among the different treatments. Soil BD was 1.36 g/cm3 in inorganic fertilized soil and 1.20 g/cm3 in the organic amended field. Variation in WSA and soil MWD indicated the impact of fertilizers and crop on the soil physical properties. Soil MWD was 0.74 mm in organic followed by integrated (0.66 mm) and inorganic soil (0.43 mm). Similarly, WSA remained in the range of 53.77–71.90%, with a minimum in inorganic and highest in the organic field.
Chlorpyrifos degradation
Temporal variation in the chlorpyrifos degradation in different treatments is shown in Fig. 1. In general, a major portion of chlorpyrifos was degraded in 15 days irrespective of treatments. The degradation of chlorpyrifos slowed down after 15 days. During the first 15 days, about 71–88% of chlorpyrifos was degraded at 25°C. Similarly, at 45°C, about 41–81% of chlorpyrifos was degraded. In general, elevated CO2 and temperature inhibited the degradation of chlorpyrifos irrespective of treatments. Degradation rate was influenced by the fertilizer regime. Complete chlorpyrifos degradation was observed in organic amended soils at 25°C. However, it degraded about 85–99% at 45°C in organic amended fields. The lowest degradation rate was observed in control soil under 60% MHC 800 ppm CO2 (0.28 ± 0.01 μg/g soil/d) and the highest rate was in the organic amended soil under 100% MHC 400 ppm CO2 (0.65 ± 0.02 μg/g soil/d) (Table 1). Elevated CO2 inhibited chlorpyrifos degradation rate by 5.18%. The inhibiting effect of CO2 was high in unfertilized (control) soil compared to fertilizer amended soils. The negative effect of CO2 on chlorpyrifos degradation was least in the organic amended fields.

Fig. 1. Colour online. Degradation of chlorpyrifos in soil (vertisol) under different CO2 concentration, moisture-holding capacity (MHC), temperature and fertilizer management. Soils were incubated at CO2 concentration of 400 and 800 ppm, temperature of 25 and 45°C, moisture-holding capacity of 60 and 100%. Soils were collected from the experimental fields amended with none (control), inorganic fertilizers, integrated (both inorganic and organic) and organic fertilizers. X-axis represents incubation period (in day) and Y-axis represents chlorpyrifos concentration in (μg/g soil). Each data point represents arithmetic mean of three replicated observations with error bar as standard deviation.
Table 1. Effect of climate factors on chlorpyrifos degradation in vertisol under different fertilizer management

The climate factors were CO2 concentration (400, 800 ppm), moisture content (60, 100%) and temperature (25 and 45°C). Soils were collected from experimental fields amended with none (control), inorganic fertilizer, integrated (both inorganic and organic) and organic fertilizers. Values are presented as arithmetic mean ± standard deviation of three replicated observations. Each data with similar letter are not statistically significant at P < 0.05.
Real-time PCR quantification of 16s rRNA genes
The abundance of aerobic bacteria and actinomycetes was quantified after chlorpyrifos degradation (Table 2). Overall, these microbial groups were affected by chlorpyrifos amendment. Organic fertilizer increased microbial abundance, while no fertilizer and inorganic fertilizers decreased their abundance. Eubacterials abundance was comparatively higher than actinomycetes irrespective of the treatments. Microbial abundance followed the trend of organic > integrated > inorganic > control. Elevated CO2 and temperature negatively impacted the microbial abundance. At 25°C, the lowest eubacterial population was 7.00 ± 1.413×10⁶/g soil in the treatment of control 60% MHC 800 ppm CO2 and highest (72.00 ± 4.369×10⁶/g soil) in the treatment of organic 100% MHC 400 ppm CO2. Similarly, at 45°C, the lowest eubacterial population was 2.50 ± 0.60×10⁶/g soil in the treatment of control 60% MHC 800 ppm CO2 and highest (13.00 ± 1.42 × 10⁶/g soil) in the treatment of organic 100% MHC 400 ppm CO2. Actinomycetes abundance varied in the range of 17.00 ± 1.411 × 10⁴ to 62.50 ± 4.987 × 10⁴/g soil at 25°C. The lowest actinomycetes were in the treatment of control 100% MHC 800 ppm CO2 and the highest actinomycetes were in the treatment of organic 100% MHC 400 ppm CO2. Actinomycetes abundance also varied similarly at 45°C.
Table 2. Microbial abundance in vertisol amended with chlorpyrifos under different fertilizer management and climate factors

The climate factors were CO2 concentration (400, 800 ppm), moisture content (60, 100%) and temperature (25 and 45°C). Soils were collected from experimental fields amended with none (control), inorganic fertilizer, integrated (both inorganic and organic) and organic fertilizers. Chlorpyrifos was amended at 10 ppm level. Microbial abundance estimated after the end of incubation period (30 days). Values are presented as arithmetic mean ± standard deviation of three replicated observations. Each data with similar letter are not statistically significant at P < 0.05.
Statistical analysis
One-way ANOVA analysis indicated that, chlorpyrifos degradation and microbial abundance were significantly (α = 0.01) influenced by the factors (CO2 concentration, temperature, fertilizers and soil moisture regime) (Table 3). Interaction of CO2 with temperature (CO2 × temperature) significantly influenced chlorpyrifos degradation rate and eubacterial abundance. Temperature × fertilizer influenced all parameters at P < 0.01. The interaction among temperature, fertilizer and moisture significantly influenced chlorpyrifos degradation rate and eubacterial abundance. The relation between chlorpyrifos degradation rate and microbial abundance was evaluated by linear regression models (Fig. 2). Both the microbial groups (eubacteria and actinomycetes) significantly correlated at 25°C (P < 0.05). A significant relation between the degradation rate and actinomycetes was observed at 45°C (P < 0.05). Correlation between the chlorpyrifos degradation rate and soil parameters (pH, EC, Org C, Avl N, BD, MWD and WSAs) was evaluated (Table 4). Most of the parameters significantly correlated with the chlorpyrifos degradation rate (P > 0.05). Principal component analysis revealed that there was a significant association among the variables (Fig. 3). Based on the Eigen values scree plot of PCA, factors were ranked from the levelling-off point(s) (Cattell, Reference Cattell1966). The most important principal component accounted for approximately 65% of the total variance. The second and third components accounted for approximately 13 and 10% of the variance, respectively (Fig. 3). Other components contributed non-significantly with a total of about 12% variance. The ordination biplot (Fig. 3) categorized the fertilizer, elevated CO2 and temperature as an important regulating factor for chlorpyrifos biodegradation. The vector of temperature and CO2 was oppositely placed with moisture and microbial abundance. This suggested a negative impact of CO2 and temperature on chlorpyrifos biodegradation and soil microorganisms. Vectors of chlorpyrifos biodegradation rate, heterotrophic eubacteria and actinomycetes were closely placed. This relation suggested that chlorpyrifos biodegradation was mediated by these three microbial groups.

Fig. 2. Colour online. Linear regression model of chlorpyrifos degradation rate and microbial abundance. Chlorpyrifos degradation potential rate is estimated as μg chlorpyrifos degraded per gram soil per day. Microbial abundance constituted of the number of 16S rRNA copies representing eubacteria and actinomycetes.

Fig. 3. Colour online. Ordination biplot of principal component analysis (PCA) with component 1 and 2. Vectors of variables and factors were fertilizers, temperature, CO2 concentration, soil moisture-holding capacity (MHC). Principal components (PC) 1 represent 65% variation and PC2 represent (13%). The variables were chlorpyrifos degradation rate (Chlorpyrifos, abundance of heterotrophic eubacterial 16S rRNA gene copies and abundance of 16S rRNA gene copies of actinomycetes. In PCA, arrows with narrow angles are strongly correlated, arrows that are perpendicular show no correlation and arrows in opposite directions indicate negative correlation. The treatments representing 1–32 (4 fertilizers × 2 MHC × 2 CO2 × 2 temperatures) are as mentioned in Table 1. Numbers within the plot represent treatments. 1: 25°C-control-60% MHC-400 ppm CO2; 2: 25°C-control-60% MHC-800 ppm CO2; 3:25°C-control-100% MHC-400 ppm CO2; 4:25°C-control-100% MHC-800 ppm CO2 and likewise 32: 45°C-control-60% MHC-400 ppm CO2.
Table 3. Interactive effect of different factors including CO2, temperature, moisture-holding capacity (MHC) and fertilizers on chlorpyrifos degradation rate, abundance of 16S rRNA gene copies of eubacteria and actinomycetes

Analysis of variance (ANOVA) with low P value indicates significant level of impact. For all samples n = 3.
Table 4. Correlation between chlorpyrifos degradation rate and soil parameters under different CO2 and soil moisture levels
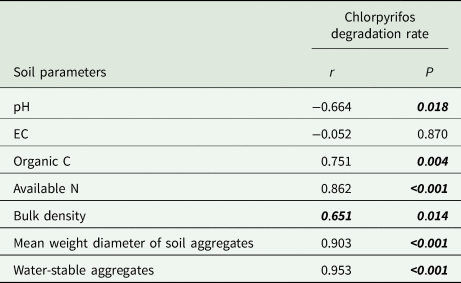
Concentration of CO2 was 400 or 800 ppm, moisture-holding capacity was 60 or 100%. The soil parameters were soil pH, electrical conductivity (EC), organic C, available N, bulk density, soil mean weight diameter of soil aggregates, water-stable aggregates fractions. Low P values (italics and bold) represent significant correlation.
Discussion
Fertilizer source influenced the soil physico-chemical properties. Soil Org C and Avl N were high in the organic amended field, due to the use of organic fertilizers (CDM, VC and PM). Soil Org C (labile) supports the soil to retain N (Miralles et al., Reference Miralles, Trasar-Cepeda, Leirós and Gil-Sotres2013; Coleman et al., Reference Coleman, Zhang, Fu, Dighton and Krumins2014; Videla et al., Reference Videla, Trivelin, Studdert and Bendasolli2014). Therefore, the soils with high Org C had high Avl N. Bulk density in the organic fertilizer amended field was low compared to the inorganic treatment. Amendment of organic fertilizers reduces BD of soil by enhancing the soil porosity, and macro-aggregate formation (Abdollahi et al., Reference Abdollahi, Schjønning, Elmholt and Munkholm2014). Soil aggregates characteristics including the MWD and WSA scored high under organic amendment, while it was low in inorganic amendment. This was due to the organic fertilizers which might have enhanced microbial activities resulting in increased aggregate size and stability. Similar results have been found earlier and confirmed that these soil properties (MWD, WSA) are improved by organic fertilizer and declined by inorganic fertilizer application (Devine et al., Reference Devine, Markewitz, Hendrix and Coleman2014).
Chlorpyrifos degradation was estimated under the influence of different climate factors. Elevated CO2 and temperature primarily drive climate change. Elevated CO2 inhibited chlorpyrifos degradation irrespective of treatment. In a rice field, soil chlorpyrifos degradation was inhibited under elevated CO2 (Adak et al., Reference Adak, Munda, Kumar, Berliner, Pokhare, Jambhulkar and Jena2016). Probably, the aerobic microbial groups involved in the degradation of chlorpyrifos were inhibited at elevated CO2. The microbial abundance was low in the soil incubated under elevated CO2. This justified why the degradation was low under elevated CO2.
High temperature (45°C) inhibited chlorpyrifos degradation as the soil microbial abundance declined at 45°C. This study compared chlorpyrifos degradation under 60 and 100% MHC. Interestingly, soil moisture favoured chlorpyrifos degradation. Generally, at low or 60% MHC, the diffusion of gas phase into solid phase (soil) is higher than 100% MHC. However, vertisol is clayey in nature. This type of soil under dry condition expands and constricts upon addition of water (Virmani et al., Reference Virmani, Rao, Srivastava, Burford and Sahrawat1989). At 60% MHC, sticky soil clods of un-uniform sizes were observed. These soil aggregates or clods might have restricted uniform gas diffusion into the soil pores unlike other textured arable soils, limiting aerobic microbial biodegradation of chlorpyrifos. Contrastingly, under flooded condition, slurry had a uniform texture possibly, facilitated higher gas diffusion and chlorpyrifos degradation.
Chlorpyrifos degrading bacteria have been isolated from agricultural soils (Singh et al., Reference Singh, Walker, Morgan and Wright2003; Hindumathy and Gayathri, Reference Hindumathy and Gayathri2013; Akbar and Sultan, Reference Akbar and Sultan2016). But there is less information on the actinomycetes population associated with chlorpyrifos biodegradation (Briceno et al., Reference Briceno, Fuentes, Palma, Jorquera, Amoroso and Diez2012; Eissa et al., Reference Eissa, Mahmoud, Massoud, Ghanem and Gomaa2014). Actinomycetes abundance significantly correlated (r 2 0.751) with chlorpyrifos degradation under 45°C. Contrastingly, the correlation between the abundance of bacterial 16S rRNA gene and chlorpyrifos degradation rate (first order) was weak (r 2 0.390). This signified that the actinomycetes were more involved in the degradation of chlorpyrifos under high temperature and CO2 condition (LeBlanc et al., Reference LeBlanc, Gonçalves and Mohn2008, p. 1).
Climate factors significantly influenced the chlorpyrifos degradation rate (P < 0.05) at the individual scale. However, their interaction had an insignificant effect on the parameters. This was due to the negative effect of CO2 and temperature and positive effect of the soil MHC on the parameters. Principal component analysis revealed that actinomycetes are more influenced by temperature and CO2 compared to bacteria. Contrastingly, bacteria are more closely associated with the fertilizer application. This was due to high nutrient requirement by bacteria than actinomycetes. Secondly, the relation was reflective in fertilized soils only.
Chlorpyrifos degradation rate was increased due to N fertilizer application. Nitrogen fertilizers regulate chlorpyrifos degradation by shaping the microbial abundance or activity at the cellular level, and community level At the cellular level, high soil N enables microorganisms to assimilate more C and P from the chlorpyrifos, thus there was high degradation rate in the fertilized soils. For the assimilation of 0.25 moles of N, 1 mole of carbon has to be taken up (Anthony, Reference Anthony1982). At the community level, high N probably stimulated N cycling microbes which in turn stimulated the degradation of chlorpyrifos.
Organic fertilizer stimulated chlorpyrifos degradation compared to integrated and inorganic fertilizers. Organic fertilizer stimulated chlorpyrifos degradation by stimulating the abundance of eubacteria and actinomycetes. Presumably, the organic fertilizer also enhanced certain soil properties that favoured chlorpyrifos degradation. Three conceptual mechanisms proposed to explain the role of organic matter on chlorpyrifos degradation. (1) Organic matter alters soil physical and chemical structure. (2) Organic matter acts as an intermediate electron carrier during the chlorpyrifos degradation. (3) Organic fertilizers act as the source of microorganisms for enhanced degradation. The first mechanism is justified on the basis that, organic fertilizers applied increase soil macroaggregate fractions (Celik et al., Reference Celik, Ortas and Kilic2004; Rabbi et al., Reference Rabbi, Tighe, Cowie, Wilson, Schwenke, Mcleod, Badgery and Baldock2014). Contrastingly, inorganic fertilizer inhibited macroaggregate formation (Kumar et al., Reference Kumar, Rawat, Singh, Singh and Rai2013; Nichols and Halvorson, Reference Nichols and Halvorson2013).
To reveal the role of organic fertilizers on soil aggregate formation and its consequence on chlorpyrifos degradation, the physical properties of soil such as BD, WSA and MWD were evaluated. Bulk density of the soil indicates the level of porosity. This is essential for gaseous and water exchange for better microbial activity (Soane and van Ouwerkerk, Reference Soane and van Ouwerkerk2013; Bruns, Reference Bruns, Ricroch, Chopra and Fleischer2014). Water-stable aggregates and MWD of the soil aggregates were higher in the organic treatments followed by integrated and inorganic treatments. Mean weight diameter varies with the soil management practices. It is a good indicator of soil physical quality (Barzegar et al., Reference Barzegar, Yousefi and Daryashenas2002). Aggregate stability depends on the organic matter content and biological activities. Soil Org C, aggregate stability and their mean size diameter significantly correlated (P < 0.05) with chlorpyrifos degradation rate. Stable aggregates provide a large range of pore space, including small pores within and large pores between aggregates (Ananyeva et al., Reference Ananyeva, Wang, Smucker, Rivers and Kravchenko2013; Clarkson et al., Reference Clarkson, Solano, Bustin, Bustin, Chalmers, He, Melnichenko, Radlinski and Blach2013). These pore spaces are active sites for high microbial activity leading to chlorpyrifos degradation.
Organic matter in the soil can act as an intermediate electron carrier. However, such an activity has been noted in the anaerobic ecosystem. Humic substances act as an electron shuttling agent in metal transformation process under anoxic environment (Coates et al., Reference Coates, Cole, Chakraborty, O'Connor and Achenbach2002). However, the role of humics in the electron transport process under aerobic environment is not clearly known. Therefore, this study seeks further research on this aspect. Organic matter may get adsorb chlorpyrifos on its surface. Thus, the adsorption of chlorpyrifos probably reduced the chlorpyrifos concentration in soil.
Third mechanism emphasizes that the organic fertilizers act as a source of microbial species. Organic sources such as farm yard manure are loaded with many heterotrophic bacteria. Under favourable conditions, organic material stimulated the less chlorpyrifos degrading heterotrophic bacterial population. Aerated soils are not fully toxic and there are aggregates which provide habitat for anaerobes. This can be enhanced and triggered by organic fertilizers. Therefore, the organic fertilizers possibly acted as an inoculum for chlorpyrifos degrading microbes.
Conclusion
The current study exhibited the impact of climate factors on chlorpyrifos degradation under different fertilizer regimes. The climate factors were elevated CO2, temperature, soil MHC. Fertilizer regimes were no fertilizer, inorganic, organic and integrated. Climate factors (elevated CO2 and temperature) inhibited chlorpyrifos degradation, while the soil moisture stimulated the degradation process. Chlorpyrifos degradation followed in the trend of organic > integrated > inorganic > control. Elevated CO2 and temperature inhibited chlorpyrifos degradation by declining bacterial and actinomycetes abundance. The abundance of actinomycetes significantly correlated with the degradation rate. This indicated that actinomycetes participate in the degradation of chlorpyrifos. Organic fertilizer stimulated chlorpyrifos degradation because of the improvement in soil physico-chemical properties. The study concludes that rising atmospheric CO2 and temperature will affect chlorpyrifos biodegradation; however, its persistence and adverse effects can be minimized by organic fertilizers.
Financial support
This research was made possible by financial support from the Department of Biotechnology (DBT) Govt of India for the project ‘Biodegradation of pesticides under changing climate and metagenomic profiling of functional microbes (Bio CARe/06/175/2011-12)’.
Conflict of interest
Authors declare no conflict of interest of any type.
Ethical standards
Not applicable.


