


Introduction
The Antarctic has the most extreme environment for terrestrial plants with 86% of the earth’s ice (Alberdi et al. Reference Alberdi, Bravo, Guitiérrez, Gidekel and Corcuera2002). In the maritime Antarctic the climate is less severe than on the continent. Summer air temperatures typically vary over 25°C, with daily means between -1.9°C and 2.3°C whilst summer precipitation is 42 mm in November to 68 mm in March (Rakusa-Suszczewski Reference Rakusa-Suszczewski1993) for King George Island. Deschampsia antarctica Desv., the Antarctic hairgrass, is the only native grass species growing in the maritime Antarctic (Edwards & Smith Reference Edwards and Smith1988). Since D. antarctica in King George Island usually grows along the seashore, it is confronted by frequent flooding with fresh (from a melting glacier) and salty water (during storms). Due to its habitat and environmental factors in the Antarctic, D. antarctica is usually exposed to cold, salt, and desiccant winds, and it might be an ideal model to study adaptation and response of plants to various abiotic stresses.
Transcriptome studies are widely used to understand the molecular mechanism for plant stress responses and to discover novel stress-responsive genes. To accomplish these purposes, sensitive, precise, and reproducible methods are essential to quantify specific mRNA sequences. Among several techniques, qPCR (quantitative real time PCR) is the most sensitive method for the detection of low abundance mRNAs (Gachon et al. Reference Gachon, Mingam and Charrier2004). It has been widely used for different applications in plant biology, such as expression profiling in developmental processes and under stress conditions (Song et al. Reference Song, Wang and Xiong2009), detecting GMOs in foods (Marmiroli et al. Reference Marmiroli, Maestri, Gullì, Malcevschi, Peano, Bordoni and De Bellis2008), determining copy number and zygosity in transgenic plants (Bubner & Baldwin Reference Bubner and Baldwin2004), and plant pathogen genotyping (Abd-Elsalam Reference Abd-Elsalam2003).
The most important element for qPCR analysis is the selection of proper reference genes to avoid bias. Ideally, the conditions of the experiment should not influence the expression of the reference gene (Schmittgen & Zakrajsek Reference Schmittgen and Zakrajsek2000). However, many previous studies have shown that reference genes widely used for the quantification of mRNA expression, could vary with the experimental conditions (Thellin et al. Reference Thellin, Zorzi, Lakaye, De Borman, Coumans, Hennen, Grisar, Igout and Heinen1999, Stürzenbaum & Kille Reference Stürzenbaum and Kille2001, Radonic et al. Reference Radonic, Thulke, Mackay, Landt, Siegert and Nitsche2004). According to Thellin et al. (Reference Thellin, Zorzi, Lakaye, De Borman, Coumans, Hennen, Grisar, Igout and Heinen1999) and Vandesompele et al. (Reference Vandesompele, De Preter, Pattyn, Poppe, van Roy, De Paepe and Speleman2002), at least two or three reference genes should be used as internal standards because the use of a single gene for normalization could lead to relatively large errors. Currently, some reference genes have been well described for the normalization of expression signals. The most common genes are actin, tubulin, and elongation factor 1α (Gutierrez et al. Reference Gutierrez, Mauriat, Guénin, Pelloux, Lefebvre, Louvet, Rusterucci, Moritz, Guerineau, Bellini and van Wuytswinkel2008). Ribosomal RNA, cyclophilin, and ubiquitin may also be used (Thomas et al. Reference Thomas, Meyer, Wolff, Himber, Alioua and Steinmetz2003, Nakashima et al. Reference Nakashima, Chen, Phuong Thao, Fujiwara, Wong, Kuwano, Umemura, Shirasu, Kawasaki and Shimamoto2008, Gutjahr et al. Reference Gutjahr, Banba, Croset, An, Miyao, An, Hirochika, Imaizumi-Anraku and Paszkowski2008).
Recently, a growing number of studies have focussed on the importance of reference genes and the need for their validation for each particular experimental system. Although most studies deal with human or animal tissues, a few have concerned model plants or crop species, for example, wheat (Paolacci et al. Reference Paolacci, Tanzarella, Porceddu and Ciaffi2009), barley (Burton et al. Reference Burton, Shirley, King, Harvey and Fincher2004), rice (Kim et al. Reference Kim, Nam, Kim, Kim and Chang2003), poplar (Brunner et al. Reference Brunner, Yakovlev and Strauss2004), potato (Nicot et al. Reference Nicot, Hausman, Hoffmann and Evers2005), grape (Reid et al. Reference Reid, Olsson, Schlosser, Peng and Lund2006), peach (Tong et al. Reference Tong, Gao, Wang, Zhou and Zhang2009), Arabidopsis (Czechowski et al. Reference Czechowski, Stitt, Altmann, Udvardi and Scheible2005), and tobacco (Volkov et al. Reference Volkov, Panchuk and Schöffl2003). To our knowledge, no reports have so far described the suitability of reference genes for qPCR studies of differential expression of genes from plants in extreme environmental conditions, even though they could be the best targets for studying stress responsive gene expression. In the present work, the expression variability of nine genes is reported in order to assess their value as reference genes in gene expression studies on abiotic stresses from cold, salt, and PEG treatment.
Materials and methods
Plant materials and stress treatments
Deschampsia antarctica Desv. (Poaceae) plants were collected close to the Korean King Sejong Antarctic Station (62°14′29′′S, 58°44′18′′W), on the Barton Peninsula of King George Island, during two Antarctic summers (January 2006 and 2007). Plants were placed in plastic containers and transported to Korea, where they were cultivated in a growing chamber in clay sand with 16h/8h of day/night cycles at 15°C. Cold treatment of plants was performed at 4°C with regard to the control at 15°C. For salt and PEG treatments, plants were treated with 250 mM NaCl and 40% PEG6000 respectively, whereas the control was treated with water. Plant leaves and roots were sampled at indicated time points to determine the results of stress conditions.
Total RNA extraction
Total RNA extraction was performed for three biological replicates by the RNeasy plant mini kit (Qiagen, Leusden, The Netherlands) according to the manufacturer’s instructions. The quantity and quality of total RNA was determined by spectroscopic measurements at 230, 260 and 280 nm using ND-1000 spectrophotometer (NanoDrop Technologies, USA), and the integrity was checked by electrophoresis in 1% agarose gel.
Primer design
Specific primers were designed for reference genes with the PrimerQuestSM software in IDT homepage (http://eu.idtdna.com/scitools/applications/primerquest/default.aspx, accessed March 2009). Each primer sequence was chosen because it had no similarity with any gene sequence in Arabidopsis and rice databases available in NCBI with 170 bp maximum length, optimal Tm at 60°C, GC% between 40% and 60% (Table I).
Table I Primer sequences for internal genes used in this study.

Reverse transcription and qPCR
Two micrograms of each RNA sample was reverse transcribed to cDNA with MMLV reverse transcriptase (Enzynomics, Korea) using random hexamers after treatment with RNase-free DNase (Promega, USA). Oligo primer molecules and dNTPs were eliminated by using PCR purification kit according to the manufacturer’s instructions (Intron biotech, Korea). The cDNA concentration was checked using ND-1000 spectrophotometer (NanoDrop Technologies, USA). PCR was performed using SYBR Green I technology on Rotor-Gene 6000 Real-time PCR cycler (Corbett, Australia). A master mix for each PCR run was prepared with SYBR Premix Ex Taq II (TaKaRa, Japan). Two ng of cDNA were added for 10 ul reaction. 300 nM each for specific sense and anti-sense primers were used. PCR cycling with an annealing temperature of 55°C were performed in four replicates from the same RNA preparation and the mean value was considered. The real-time PCR efficiency was determined for each gene and each stress with the slope of a linear regression model (Pfaffl Reference Pfaffl2001). For each gene, PCR efficiency was determined by measuring the Cq to a specific threshold (Walker Reference Walker2002). For this process, each of the cDNA samples were mixed and then used as PCR templates in a range of 20, 10, 5, 2, 1, 0.5, 0.2 and 0.1 ng. The standard curve, Cq value and PCR efficiency for each gene were acquired automatically using Rotor-Gene 6000 Series Software ver. 1.7.40. All PCRs displayed efficiencies between 1.9 and 2.1. PCR product sizes were checked on a 3% agarose gel. All corresponded to the expected size. Melting curves showed a single amplified product. In order to verify the amplification products, their sequences were determined using amplicon specific primers, and analysed with BLAST 2 sequences software (http://www.ncbi.nlm.nih.gov/blast/bl2seq/bl2.html, accessed June 2009). All amplified sequences had 100% identities with sequences in database.
Gene expression analysis
Expression levels were determined as the number of cycles needed for the amplification to reach a threshold fixed in the exponential phase of PCR reaction (Cq). The Cq were transformed into quantity using PCR efficiency according to Vandesompele et al. (Reference Vandesompele, De Preter, Pattyn, Poppe, van Roy, De Paepe and Speleman2002). Average expression stability values and the optimal number of control genes for normalization were calculated by using geNorm software (http://allserv.ugent.be/jvdesomp/genorm/index.html, accessed June 2009). The TACR7 expression levels were normalized using the geometric mean of selected reference gene quantities and SD values were calculated with the mean values of three biological replicates in Microsoft Excel following the guidelines described in the geNorm manual (http://medgen.ugent.be/~jvdesomp/genorm/geNorm_manual.pdf, accessed June 2009).
Results
Variations of reference gene expression
In this study, the expression levels of nine genes were assessed in six types of D. antarctica samples representing different tissues under various abiotic stresses. These genes, selected because of their common use as references in qPCR analysis, were ACT1, ACT2, aTUB, bTUB, CYP, EF1a1, EF1a2, UBQ1, and UBQ2 (Table I). Each primer sequence was designed from 3′ UTR with no homology to any sequence in NCBI database to avoid non-specific amplification.
To evaluate the stability of expression of the nine reference genes, RNA transcription levels for all samples were measured for each stress (Fig. 1). One of elongation factor 1α, EF1a2, showed the highest expression level (low Cq value) and aTUB showed the lowest expression in all conditions tested. Values are represented as mean of Cq from 12 experiments comprised of three biological replications and four technical replications. Variation of experiments was assessed as SD for each reference gene. As a result of calculation with Cq in all the experiments for leaves and roots under various stresses, CYP showed the lowest SD value of 0.47, while aTUB showed the highest value of 0.73, and others were between 0.48 and 0.58. In order to validate and select the best reference genes, two parameters of M (average expression stability) and V (pairwise variation) were used to quantify the reference gene stability. A low M value is indicative of a more stable expression, hence, increasing the suitability of a particular gene as a control gene. Based on a cut-off value of 0.15 for the pairwise variation below which the inclusion of an additional control gene is not required, we found that the most stable reference genes differed depending on the stress condition and the tissue of D. antarctica (Fig. 2).

Fig. 1 RNA transcription levels of reference genes tested, presented as mean of Cq value in the different D. antarctica samples. a.–c. Leaves exposed to cold, salt, and PEG treatment for indicated time, and their corresponding controls. d.–f. Roots exposed to cold, salt, and PEG treatment for indicated time, and their corresponding controls. Cq values are mean of three replicates.
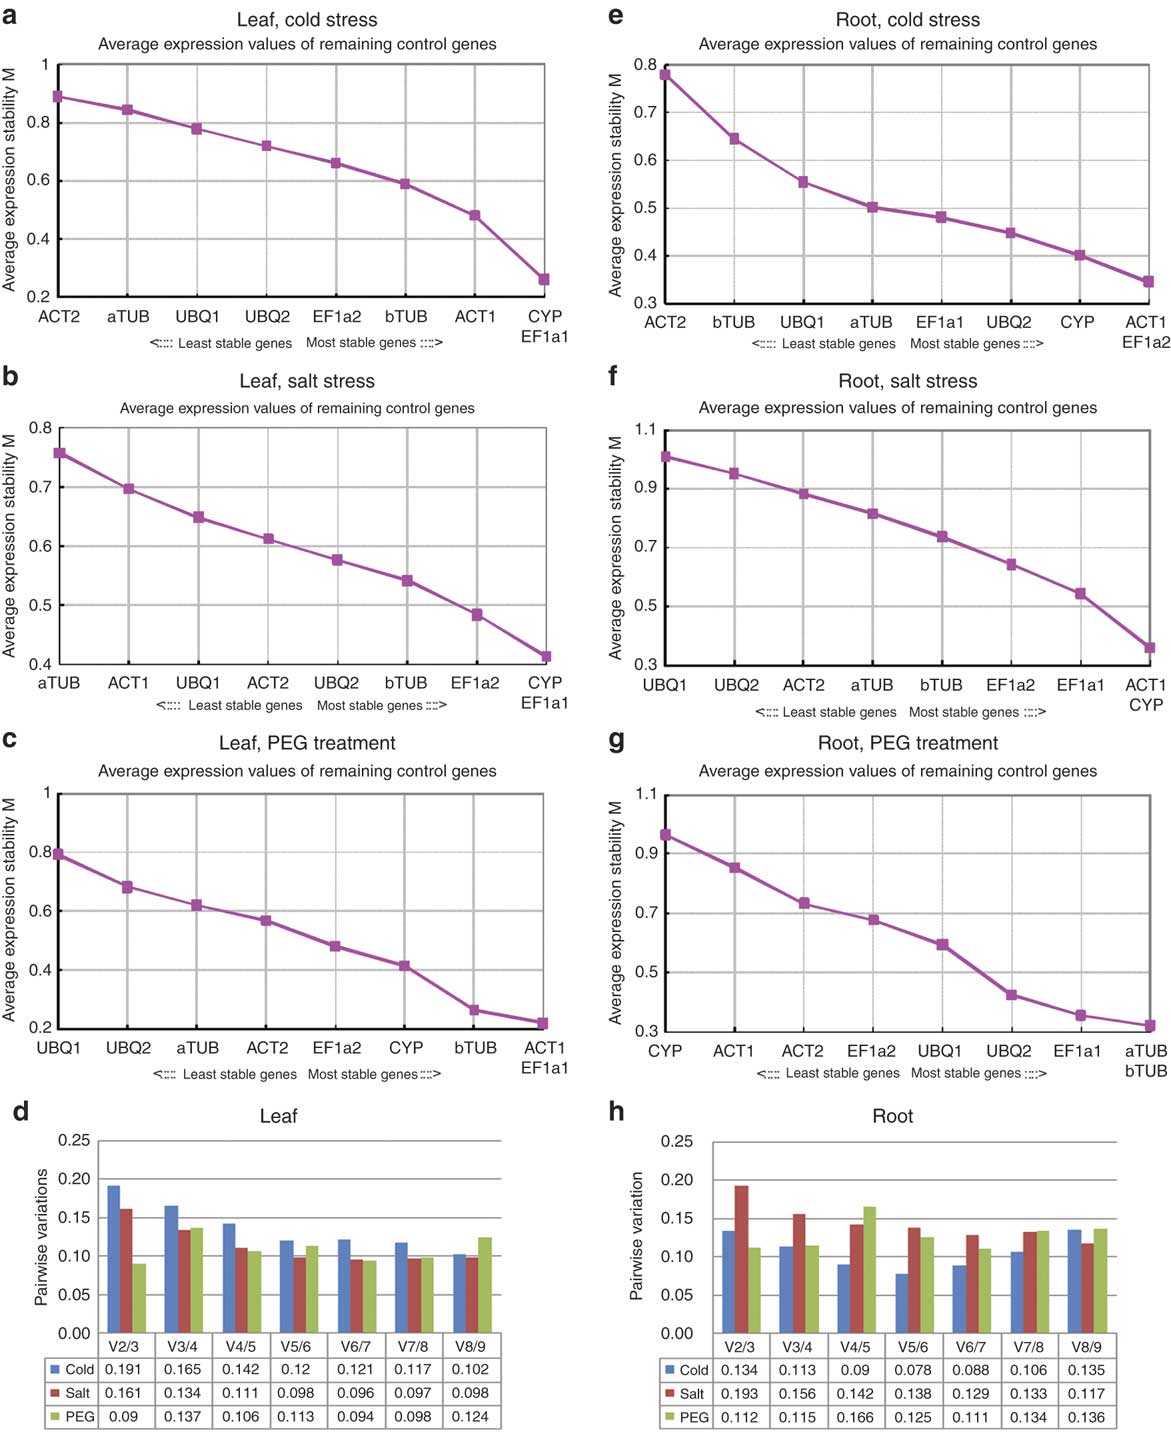
Fig. 2 Average expression stability values of control genes by geNorm analysis. M values for each reference gene in the leaf and the root under a. & e. cold, b. & f. salt, and c. & g. PEG treatment, respectively. d. & h. Determination of the optimal number of control genes for normalization by geNorm analysis in the leaf and the root.
In the cold stress in leaves, the most stable genes were CYP and EF1a1 (Fig. 2a). The M value obtained for these two genes was 0.26. Since the pairwise variation was higher than 0.15 (0.191) (Fig. 2d), two additional genes should be added to get V value below the cut-off. The two most stable genes in leaves for the salt stress were also CYP and EF1a1 with M value of 0.414 (Fig. 2b). For the PEG treatment in leaves, ACT1 and EF1a1 were the two most stable genes with M value of 0.22 (Fig. 2c). In salt conditions, a third gene should be added to make pairwise variation below 0.15, and in PEG treatment, two genes would be sufficient (Fig. 2d). EF1a1 showed the most stable expression in all three conditions. The least stable genes in leaves during cold, salt, and PEG treatments were ACT2, aTUB, and UBQ1 (Fig. 2a–c).
In the root tissues, the stability of reference genes varied depending on the stress. For the salt stress, the most stable genes were ACT1 and CYP with the M value of 0.36 (Fig. 2f). Since the pairwise variation was higher than 0.15 (0.193) (Fig. 2h), two more genes are needed to make V value below the cut-off. The two most stable genes for cold stress were ACT1 and EF1a2 (Fig. 2e), with aTUB and bTUB for PEG treatment (Fig. 2g). The M values were 0.346 and 0.321 for cold and PEG treatment, respectively (Fig. 2h). These two conditions had pairwise variations below the cut-off (0.134 and 0.112), thus only two genes would be sufficient as the reference.
TACR7 gene expression
The expression level for TACR7 as the gene of interest was quantified. Its expression was greatly increased by the cold stress. The gene expression level was the highest in leaves after 6 hr of treatment and had increased over 100-fold compared with the control (Fig. 3a). After 12 hr of treatment, the level decreased but was still 50-fold higher compared with the control. Though the levels were much lower than those from leaves were, the gene expression in roots increased approximately 12-fold compared with the control (Fig. 3d). For the other treatments of salt and PEG, the level of TACR7 expression remained constant or showed a slight fluctuation independent of the length of treatment (Fig. 3b, c, e, & f).

Fig. 3 Relative quantification of D. antarctica TACR7 gene expression using various combinations of reference genes as the internal control. a. & d. During cold stress, b. & e. During salt stress, c. & f. During PEG treatment from leaves and roots, respectively.
CYP and ACT1 were the most stable reference genes for most stresses in this study. To investigate the difference between single and multiple genes used as reference, the expression level of the TACR7 gene was quantified with CYP or ACT1 singly, and with multiple reference genes. As a result, differences in quantification were detected according to the combination of reference genes used (Fig. 3). Compared with the use of a unique internal control, using multiple reference genes as the internal control did not significantly change the quantification or the pattern of the expression level of TACR7 (Fig. 3). However, when CYP was used as single reference gene, the quantification of the gene expression was slightly overestimated for cold and salt stresses in the leaf tissues (Fig. 3a & b).
Discussion
The reliability of qPCR data would be greatly improved by inclusion of a reference gene whose transcription level is invariable in the different experimental conditions. Expression stability analyses showed that the most stable reference gene identified by geNorm software was not the same for the six datasets analysed (Fig. 2). As shown in previous reports, it is not possible to find an ideal reference gene for all purposes (Reid et al. Reference Reid, Olsson, Schlosser, Peng and Lund2006, Paolacci et al. Reference Paolacci, Tanzarella, Porceddu and Ciaffi2009, Tong et al. Reference Tong, Gao, Wang, Zhou and Zhang2009). Instead, Gutierrez et al. (Reference Gutierrez, Mauriat, Guénin, Pelloux, Lefebvre, Louvet, Rusterucci, Moritz, Guerineau, Bellini and van Wuytswinkel2008) highlighted the importance of pilot studies to select the most suitable reference gene for specific experimental conditions.
When the six datasets originating from the combination of three treatments and two plant tissues were analysed, geNorm identified EF1a1 and ACT1 as the most stable gene in leaves under various abiotic stresses (Fig. 2a & b). Besides ACT1, bTUB and EF1a2 were ranked in the five most stable genes in all three different stresses to leaves. However, in roots, EF1a1 was the only gene ranked in the five most stable genes in all three different stresses (Fig. 2e–g). For the cold and the salt stress for roots, ACT1 and CYP belonged to the three most stable genes (Fig. 2e & f). However, they are not suitable as control genes for analysing the samples that were subjected to PEG treatment because they were the two least stable genes, wherein aTUB and bTUB performed much better (Fig. 2g). Comparing expression stabilities in different tissues for the same stress, CYP and ACT1, showed high stabilities in the cold, CYP and EF1a1 for the salt stress, and bTUB for the PEG treatment (Fig. 2).
For the TACR gene, relative quantification varied depending on the reference gene used (Fig. 3). When compared with the use of a unique internal control, the use of multiple reference genes as the internal control did not change significantly the quantification or the pattern of the expression level of TACR7. Accordingly, the use of single gene as the internal standard could be a valuable alternative to quantify a gene of interest, keeping in mind that it could overestimate the variations of expression in the cold stress or the salt stress.
TACR7 was originally isolated as a gene designated as Triticum aestivum cold regulated 7 from hard red winter wheat where its expression increased in freeze-resistant plants relative to freeze-susceptible plants (Gana et al. Reference Gana, Sutton and Kenefick1997). Its expression was not induced by ABA or stresses such as salt, dehydration, and heat, so the gene was grouped as low-temperature specific. In addition, the TACR7-homologous gene of D. antarctica, has shown a 60-fold increase of transcription level in plants from an Antarctic environment compared to plants grown in 15°C (Lee et al. Reference Lee, Cho, Kim, Yim, Lee and Lee2008). In this study TACR7 homologue of D. antarctica was implicated in cold stress with a maximum of expression at 6 hr after treatment and its expression level was highly maintained 12 hr after treatment in the leaf tissue (Fig. 3a). Expression level in the root increased almost ten times from 1 hr to 12 hr after cold stress (Fig. 3d). The results of cold stress were similar to those shown by Gana et al. (Reference Gana, Sutton and Kenefick1997), where the gene transcripts accumulated during cold exposure in a freeze resistant wheat species. This suggests that the gene product is probably functional in the process of cold adaptation. Furthermore, TACR7 expression remained constant in the leaf under PEG treatment, or showed a small range of fluctuation in the leaf under salt stress, in roots under salt stress and PEG treatment. Thus, this study indicated that TACR7 in D. antarctica might be implicated in the cold adaptation and should be designated as low-temperature-specific gene.
Although in some of our experimental conditions a single reference gene was adequate to normalize the qPCR data, the use of multiple reference genes should be considered in future studies to improve the accuracy and reliability of gene expression analysis. The specific primer set of qPCR developed in this study for the stable reference genes for each stress conditions and plant tissue types, would enable us to perform more accurate normalization and quantification of gene expression in D. antarctica.
Acknowledgements
We thank the referees whose comments helped improve this manuscript. This work was supported by a grant PE09050 from the Korea Polar Research Institute.


