


INTRODUCTION
Leishmaniasis is an infectious disease caused by parasitic protozoa of the genus Leishmania, widely distributed throughout 98 different countries. Around 12 million people are currently infected and 2 million new cases are reported every year (Alvar et al. Reference Alvar, Velez, Bern, Herrero, Desjeux, Cano, Jannin and den Boer2012). These parasites infect mononuclear phagocytes and are transmitted to the vertebrate host by phlebotomine sand flies (McMahon-Pratt and Alexander, Reference McMahon-Pratt and Alexander2004). Depending on the parasite species and on the host immune response, infection can lead to localized or diffuse cutaneous, to mucocutaneous or to visceral leishmaniasis (Gontijo and de CarvalhoMde, Reference Gontijo and de CarvalhoMde2003; McGwire and Satoskar, Reference McGwire and Satoskar2013). Among the species responsible for the cutaneous forms in Brazil, the more prevalent are Leishmania (V.) braziliensis, Leishmania (L.) amazonensis and Leishmania (V.) guyanensis (Brasil, 2010). Leishmania (L.) amazonensis symptomatic infections usually lead to a few localized lesions, but in some patients cause diffuse cutaneous leishmaniasis, an aggressive pathology characterized by nodules throughout the body, anergy to parasite antigens and poor therapeutic response (Balestieri et al. Reference Balestieri, Queiroz, Scavone, Costa, Barral-Netto and Abrahamsohn Ide2002; Silveira et al. Reference Silveira, Lainson, De Castro Gomes, Laurenti and Corbett2009). The discrepancy of these clinical manifestations draws attention to the need for studies of the pathophysiology of infection by this species. These studies should focus on the immune response of the host and its relation to clinical and histopathological changes, and also on the characterization of the parasites associated to the two clinical forms.
Some aspects of human infection with Leishmania can be reproduced in murine experimental infection models. The most widely used models are BALB/c and C57BL/6 mice infected with L. (L.) major, which represent polar profiles of susceptibility and resistance to infection, respectively (Heinzel et al. Reference Heinzel, Sadick, Holaday, Coffman and Locksley1989; Ji et al. Reference Ji, Sun, Qi and Soong2002; Pereira and Alves, Reference Pereira and Alves2008). The immune response in resistant lineages is predominantly Th1 and involves Interferon (IFN)-γ and nitric oxide (NO) (Ji et al. Reference Ji, Sun, Qi and Soong2002), while susceptible animals display a predominant Th2 immune profile, with abundant release of interleukin (IL)-4 (Heinzel et al. Reference Heinzel, Sadick, Holaday, Coffman and Locksley1989). Contrarily to L. (L.) major, most mouse lineages are susceptible to L. (L.) amazonensis (McMahon-Pratt and Alexander, Reference McMahon-Pratt and Alexander2004; Pereira and Alves, Reference Pereira and Alves2008) and develop a mixed Th1–Th2 response (Afonso and Scott, Reference Afonso and Scott1993; Jones et al. Reference Jones, Buxbaum and Scott2000; Ji et al. Reference Ji, Sun, Qi and Soong2002), although there are differences among mouse strains (Qi et al. Reference Qi, Popov and Soong2001; Cupolilo et al. Reference Cupolilo, Souza, Abreu-Silva, Calabrese and Goncalves da Costa2003; de Oliveira Cardoso et al. Reference de Oliveira Cardoso, de Souza Cda, Mendes, Abreu-Silva, Goncalves da Costa and Calabrese2010). In fact, humans and mice infected with L. (L.) amazonensis usually show low cellular activation and a mixed response (Silveira et al. Reference Silveira, Lainson, De Castro Gomes, Laurenti and Corbett2009; Soong, Reference Soong2012). In addition, infection in immunodeficient SCID mice leads to lesions similar to patients co-infected with HIV (Terabe et al. Reference Terabe, Kuramochi, Hatabu, Ito, Ueyama, Katakura, Kawazu, Onodera and Matsumoto1999).
Lesion sizes, parasite burden and histology have been studied in C57BL/10, DBA/2, CBA and C3H mice infected with L. (L.) amazonensis, and C3H and DBA/2 showed decrease in parasites after 120 days (de Oliveira Cardoso et al. Reference de Oliveira Cardoso, de Souza Cda, Mendes, Abreu-Silva, Goncalves da Costa and Calabrese2010). C57BL/6 is considered susceptible (Soong et al. Reference Soong, Chang, Sun, Longley, Ruddle, Flavell and McMahon-Pratt1997; Cupollilo et al. Reference Cupolilo, Souza, Abreu-Silva, Calabrese and Goncalves da Costa2003), or partially resistant (Felizardo et al. Reference Felizardo, Toma, Borges, Lima and Abrahamsohn2007) to this species. C57BL/6 lymph node cells produce high IFN-γ and very low IL-4 and IL-10 levels 8 weeks after infection, while BALB/c mice cells produce low IFN-γ and higher IL-4 and IL-10 (Felizardo et al. Reference Felizardo, Toma, Borges, Lima and Abrahamsohn2007), but the precise role of IFN-γ in L. amazonensis control is controversial. In fact, depending on the presence of other proinflammatory molecules, it may either facilitate parasite replication or promote its killing (Qi et al. Reference Qi, Ji, Wanasen and Soong2004; Ji et al. Reference Ji, Masterson, Sun and Soong2005; Soong, Reference Soong2012). Besides, its role may vary in different moments of the infection:IFN-γ was not critical for the initial control in C57BL/6 mice, but was essential for the development of a protective Th1 response in the later stages (Pinheiro and Rossi-Bergman, Reference Pinheiro and Rossi-Bergmann2007).
In this study, we analysed the course of the infection with L. (L.) amazonensis in BALB/c, athymic BALB/c nude animals (Flanagan, Reference Flanagan1966) and C57BL/6 mice by continuously evaluating lesion development and parasite burden, and comparing lesion infiltrates and cell populations in lymph nodes in two moments of infection. Our results on BALB/c and C57BL/6 bring new data to literature by showing real-time monitoring of parasite loads using a luciferase expressing L. (L.) amazonensis and characterization of cell types in lesions, lymph nodes and spleens in the same study. The BALB/c nude mice have low number of mature T lymphocytes and defective T CD4 and CD8 dependent responses (Wortis, Reference Wortis1971; Shultz and Sidman, Reference Shultz and Sidman1987) and were used to illustrate the role of T cell dependent responses in the control of Leishmania infection. Previous data showed that athymic C57BL/6 animals infected with L. (L.) amazonensis did not develop lesions and had a reduced influx of T cells and monocytes to the site of infection (Soong et al. Reference Soong, Chang, Sun, Longley, Ruddle, Flavell and McMahon-Pratt1997), but no similar analysis was ever performed in nude mice from BALB/c background.
MATERIAL AND METHODS
Leishmania (L.) amazonensis promastigotes
Promastigotes of Leishmania (L.) amazonensis LV79 strain (MPRO/BR/72/M 1841) were cultured at 24 °C in M199 medium supplemented with 10% foetal calf serum (FCS). Promastigotes of the luciferase expressing line La-LUC, obtained from the L. (L.) amazonensis MHOM/BR/1973/M2269 wild type strain (Reimao et al. Reference Reimao, Trinconi, Yokoyama-Yasunaka, Miguel, Kalil and Uliana2013), were cultured in 199 medium with 10% FCS and 32 µg mL−1 of Geneticin (G418, Sigma-Aldrich). Parasites were sub-cultured every 7 days at an initial inoculum of 2 × 10⁶ mL−1.
Ethics statement
All animals were used according to the Brazilian College of Animal Experimentation (CONEP) guidelines, and the protocols were approved by the Institutional Animal Care and Use Committee (CEUA) of the University of São Paulo (protocol number 001/2009).
Mice infection and histopathological analysis
Four to 8-week-old BALB/c, BALB/c nude and C57BL/6 female mice maintained in our facilities were infected in the left hind footpads with 2 × 10⁶ promastigotes of L. (L.) amazonensis LV79 or La-LUC in the beginning of stationary-phase (day 4) in a final volume of 20 µL. Footpad thickness was measured weekly using a caliper (Mitutoyo Corporation, Japan).
For histological analysis, we employed five animals for each strain and condition: uninfected, 6 and 13 weeks of infection. Animals were euthanized, infected paws were removed from mice infected with promastigotes and control footpads were removed from uninfected mice with similar ages. Fragments of these tissues were fixed in 10% buffered formalin for 18 h and after washing and dehydration in graded concentrations of ethanol, diaphanized and embedded in paraffin. The 4 µm paraffin sections were stained with haematoxylin and eosin and submitted to semi-quantitative analysis of cell populations and tissue structure. Nine slides were analysed for each tissue sample, and for each parameter analysed relative scores from 0 (absent) to 3 were attributed.
Parasite burden quantification by limiting dilution
Thirteen weeks after infection with LV79 strain animals were euthanized and infected paws and lymph nodes were removed for parasite quantification by limiting dilution (Lima et al. Reference Lima, Bleyenberg and Titus1997). Briefly, lesions were minced using scalpel blades and homogenized in 5 mL of phosphate-buffered saline (PBS) using a tissue grinder (Thomas Scientific). After centrifugation at 50 g for 10 min at 4 °C, the supernatant was recovered and centrifuged at 1450 g for 17 min at 4 °C. Supernatant was discarded and the pellet was washed three times with PBS followed by centrifugations at 1450 g for 17 min at 4 °C. The pellet was then resuspended in Warren medium supplemented with 10% FCS, dispensed in a 96 well plate using 1:10 dilutions between adjacent wells and cultured at 24 °C for ten days for promastigote differentiation. The plate was analysed under microscope to determine the last dilution in which promastigotes are found and the raw data was analysed using ELIDA program.
Analysis of parasite burden in footpads by in vivo imaging
Parasite burden in mice infected with La-LUC was quantified by in vivo imaging as described previously (Reimao et al. Reference Reimao, Trinconi, Yokoyama-Yasunaka, Miguel, Kalil and Uliana2013). Briefly, analysis was performed weekly in BALB/c, BALB/c nude and C57BL/6 female mice infected as described above in an in vivo image system (IVIS Spectrum, Caliper Life Sciences). Animals received 75 mg kg−1 VivoGlo™ Luciferin (Promega Corporation) (i.p.) and, after 15 min, were anesthetized in 2·5% isoflurane atmosphere (Cristália). Mice were then transferred to the chamber and kept in 1·5% isoflurane atmosphere. The images were acquired 21 min after luciferin injection and emitted photons were collected using the high resolution (medium binning) mode. Total photon emission from a defined region of interest (ROI) corresponding to the footpad lesion and from a non-infected footpad were quantified with Living Image software version 4.3.1 (Caliper Life Sciences). The difference between photon emissions in lesion – non-infected footpad was calculated and expressed as photons/s/cm2/sr. The same ROI was applied to all animals.
Flow cytometry
Surface markers: cells were isolated from spleens and popliteal lymph nodes from infected (6 and 13 weeks) and uninfected (controls with similar ages) animals. A total of 106 cells were washed and resuspended in 25 µL of PBS pH 7·4 containing 2% FCS and 0·1% sodium azide and a combination of the following antibodies: anti-CD4 (PacBlue or Alexa 488); anti-CD8 (PerCP); anti-CD11b (FITC, APC or PE); anti-CD49b (FITC) (BD Pharmingen). The samples were incubated for 30 min at 4 °C, washed with PBS and centrifuged at 450 g for 5 min at 4 °C. The supernatant was discarded and the cells resuspended in 400 µL of 1% formaldehyde for analysis in the flow cytometer FACSAccuri (BD Pharmingen). For intracellular labelling of IL-4, IFN-γ, IL-10 and IL-12 we cultured the cells with no stimulation or with phorbol myristate acetate (PMA) (50 ng mL−1) and Ionomycin (1 µg mL−1) (Sigma-Aldrich), in the presence of Brefeldin A (1 µg mL−1) (BD Biosciences) for 3–5 h. Further, cells were washed and surface staining was performed as described. For intracellular staining, we employed the permeabilization kit Cytofix/Cytoperm (BD Pharmingen) according to manufacturer's instructions. Briefly, cells were incubated with 50 µL of Cytofix/Cytoperm for 20 min at 4 °C, and subsequently washed with permwash and centrifuged at 450 g for 5 min. The supernatant was discarded and the cells resuspended in 25 µL of permwash containing the antibodies: anti-IL-4 (PE), anti-IL-10 (APC), anti-IL-12 (PE) and anti-IFN-γ(APC) (Biolegend), and incubated for 20 min at 4 °C. After incubation the cells were washed in permwash and resuspended in 200 µL of paraformaldehyde 1%. 5·000 gated events were acquired using the flow cytometer FACSAccuriC6 (BD Pharmingen®). All data acquisition was performed using the following gate strategies: gate 1: doublets exclusion (FSC-H × FSC-A), gate 2: FSC × SSC; gate 3: CD11b × SSC for macrophages; gate 4: CD4 × SSC; gate 5: CD8 × SSC and gate 6: CD49b × SSC.
Macrophage infections
Resident macrophages were collected from the peritoneal cavity of BALB/c, BALB/c nude and C57BL/6 mice with similar ages. Animals were euthanized in CO2 chamber and washed with 70% ethanol. The peritoneal cavity was exposed and 5 mL of cold PBS were injected into the cavity. The aspirate was recovered after massaging and centrifuged at 3000 g for 10 min at 4 °C. A total of 8 × 10⁵ cells in Roswell Park Memorial Institute (RPMI) 1640 pH 7·2 were transferred to each well of 24 well plates laid with 13 mm circular coverslips. After 2 h of incubation at 37 °C in 5% CO2, medium was changed to RPMI 1640 pH 7·2 with 10% SFB and cells were incubated until the next day. Infection was performed with promastigotes in the beginning of stationary phase (day four) using a multiplicity of infection of 5:1 for 24 h. Macrophages were fixed with methanol, stained with Giemsa and fixed with Entellan (Merck). One hundred macrophages were analysed per glass slide to determine the proportion of infected cells (IM), total number of amastigotes (AMA), amastigotes/infected macrophage and infection index (II = IM × AMA).
Statistical analysis
Statistical analyses were done using one or two-way ANOVA followed by Tukey's multiple comparison test or Bonferroni, respectively.
RESULTS
Lesion development and parasite loads differ in BALB/c, BALB/c nude and C57BL/6 mice infected with L. (L.) amazonensis
Mice were infected with promastigotes in the left hind footpads and lesion development was evaluated through the measurement of lesion size. As shown in Fig. 1A, lesions in C57BL/6 and BALB/c increased earlier than in BALB/c nude mice. From week 7 onwards, lesions in C57BL/6 mice were reduced in size and progressed to complete healing. Lesions in BALB/c and in BALB/c nude continued to increase in size until 13 weeks after infection, when the animals were euthanized. When the lesion development curves of the three groups were compared (comparison of the area under the curve, inset in Fig. 1A), all were significantly different (BALB/c > BALB/c nude > C57BL/6).

Fig. 1. Lesion size and parasite burden in BALB/c, BALB/c nude and C57BL/6 mice infected with L. (L.) amazonensis LV79 strain. (A) Footpad lesion size (difference between infected and non-infected footpads) in BALB/c, BALB/c nude C57BL/6 (5 animals of each) along 13 weeks of infection with LV79 strain. Inset graph shows area under the curve (AUC) of lesion size. (B) Limiting dilution quantification of parasites in footpads 13 weeks after infection (5 animals of each). Statistical analyses for lesion size by two-way ANOVA and for AUC and parasite burden by ANOVA. BALB/c × C57BL/6: *; BALB/c nude × C57BL/6: # and BALB/c × BALB/c nude: ξ; *P < 0·05
Parasite loads in lesions determined 13 weeks after infection by limiting dilution assays indicated similar parasite numbers in BALB/c and BALB/c nude (Fig. 1B). In spite of the clinical healing in C57Bl/6 mice, parasites were still detected, although in significantly smaller numbers than in BALB/c nude mice.
To evaluate the parasite burden according with the evolution of disease we made use of infections with a luciferase expressing line of L. (L.) amazonensis. This strain has been previously shown to produce clinical lesions that are indistinguishable from the wild type parasites (Reimao et al. Reference Reimao, Trinconi, Yokoyama-Yasunaka, Miguel, Kalil and Uliana2013). Furthermore, in the three strains of mice tested here, the behaviour of La-LUC and LV79 were comparable (Fig. 1 and Supplementary Fig. S1).
When La-LUC was used to infect BALB/c, BALB/c nude and C57BL/6 mice, parasites were detected at the site of parasite inoculation from week 1 post-infection in all groups, and increased in C57BL/6 after the first week (Fig. 2A). Luminescence levels remained rather low and stable in BALB/c and BALB/c nude lesions until week 3, when curves sloped upwards. At week 7, parasite numbers in C57BL/6 mice reached the peak and then started to decrease. Parasite burden continued to increase in BALB/c and BALB/c nude footpads until 13 weeks after infection, when BALB/c nude mice displayed significantly higher luminescence than the other two strains (Fig. 2A), in agreement with the higher parasite burden in these athymic animals by limiting dilution (Fig. 1B). When the curves of luminescence were compared (area under the curve, Fig. 2B), no significant differences were observed, indicating that the overall parasite density was not different throughout the analysis, but only in the latter times of infection. Luminescence was not detected at sites other than the footpads in any of the mice strains. Figure 2C shows representative images of infected animals after 6 and 13 weeks of infection.
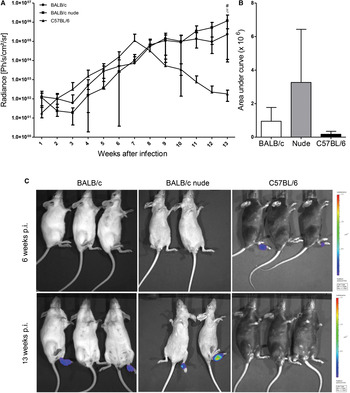
Fig. 2. Parasite burden estimated by luminescence in BALB/c, BALB/c nude and C57BL/6 mice (4 animals of each) infected with La-LUC. (A) Graphs showing luminescence along 13 weeks of infection and (B) area under the curve of luminescence over time. (C) Representative images captured by IVIS 6 (upper images) and 13 (lower images) weeks after infection. Statistical analyses for (A) by two-way ANOVA, for (B) by ANOVA. BALB/c × C57BL/6: *; BALB/c nude × C57BL/6: # and BALB/c × BALB/c nude: ξ. *P < 0·05. Bars indicate standard deviation (s.d.).
Based on lesion development and parasite burden profiles, we defined two time points to be further investigated: 6 weeks after infection, the peak for C57BL/6 lesions (with high parasite burden) and time when nude lesions started to increase exponentially, and 13 weeks after infection, time when C57BL/6 lesions were healed while BALB/c and BALB/c nude lesions were still growing.
Tissue integrity and cell composition differ in infected footpads of BALB/c, BALB/c nude and C57BL/6 mice
To better understand the alterations caused by infection in the different mouse strains we analysed fibrosis, necrosis, ulcers and oedema in lesions after 6 and 13 weeks of infection, compared with non-infected tissues.
As shown in Fig. 3B, necrosis was evident 6 weeks after infection in BALB/c and C57BL/6, and was present in the three mouse strains 13 weeks after infection, although in a significantly smaller extent in C57BL/6 mice. Fibrosis was significantly more frequent in C57BL/6 6 weeks after infection, and was observed in some BALB/c nude and C57BL/6 mice, but not in BALB/c after 13 weeks. Ulcers were present only in BALB/c lesions after 6 weeks of infection and increased at 13 weeks, and oedemas were present only in this mouse strain after 13 weeks (data not shown). We show representative images of fibrosis in BALB/c and C57BL/6 footpad sections 6 weeks after infection (Fig. 3A II and VI) and of necrosis in the lesions of the three strains 13 weeks after infection (Fig. 3A VII, VIII and IX). Images VII, VIII and IX also illustrate the higher parasite burden in BALB/c and BALB/c nude lesions, and the few infected cells in C57BL/6 footpads 13 weeks after infection.

Fig. 3. Tissue damage in infected footpads of BALB/c (B), BALB/c nude (N) and C57BL/6 (C) mice 6 and 13 weeks after infection. (A) Representative images of non-infected footpads of the three mice (I, III and V), infected footpads showing fibrosis (II and VI) and inflammation without fibrosis (IV) after 6 weeks of infection and necrosis and inflammation after 13 weeks (VII, VIII and IX); scale bars 500 µm. (B) Semi-quantitative analysis of necrosis and fibrosis in footpads of the three mice (4–5 animals for each condition) after 6 and 13 weeks of infection. Nine slides were analysed for each tissue sample, with relative scores from 0 to 3. Statistical analysis by ANOVA. *P < 0·05. Bars indicate standard deviation (s.d.).
The same footpad sections were submitted to a comparative analysis of the abundance of lymphocytes, monocytes, macrophages, neutrophils, eosinophils and basophils (Fig. 4). Anatomopathological analysis was crucial to characterize cell infiltrates in infected footpads, since lesion integrity was better preserved by this technique. In fact, we have previously noted that infected BALB/c nude macrophages ruptured very easily during footpad tissue processing for flow cytometry, rendering cell percentage calculations less precise in these mice (Teixeira et al. Reference Teixeira, Velasquez, Lepique, de Rezende, Bonatto, Barcinski, Cunha-Neto and Stolf2015).

Fig. 4. Semi-quantitative analysis of the profusion of lymphocytes, macrophages, neutrophils, eosinophils and basophiles in footpads from BALB/c (B), BALB/c nude (N) and C57BL/6 (C) mice after 6 and 13 weeks of infection and non-infected controls (4–5 animals for each condition). Nine slides were analysed for each tissue sample, with relative scores from 0 (absent) to 3. Statistical analysis by two-way ANOVA. *P < 0·05. Bars indicate standard deviation (s.d.).
As expected, few inflammatory cells were present in non-infected footpads. Infection for 6 weeks significantly increased the quantity of lymphocytes, monocytes, macrophages, neutrophils in all mouse strains and also of eosinophils and basophils in BALB/c and C57BL/6 mice (Fig. 4). From 6 to 13 weeks of infection, all cell types analysed significantly decreased in C57BL/6 footpads. Monocyte and neutrophil numbers decreased in BALB/c nude footpads, but no cell type decreased in BALB/c lesions.
Comparing the three mouse strains, BALB/c nude footpads infected for 6 weeks had a smaller number of lymphocytes, monocytes, eosinophils and basophils. Thirteen weeks after infection, BALB/c lesions had a higher number of lymphocytes, monocytes, neutrophils, eosinophils and basophils than the other two mouse strains, while macrophages had similar proportions in infected BALB/c and BALB/c nude footpads, both higher than in C57BL/6 lesions (Fig. 4). This data indicate that inflammatory infiltrate of nude mice is different from the other two strains and that C57BL/6 lesion and parasite regression is accompanied by the reduction of the cellular infiltrate and tissue damage in footpads.
Cell types and cytokine production differ in infected BALB/c, BALB/c nude and C57BL/6 mice lymph nodes and spleens
To characterize the activation status of the different lymphoid and myeloid cells present in draining lymph nodes and spleens of the three mouse strains, we performed flow cytometry analysis in non-infected mice and in mice after 6 and 13 weeks of infection. We quantified the percentages of T lymphocytes as CD3+CD4+ or CD3+CD8+ cells (Laird and Hayes, Reference Laird and Hayes2009), NK cells as CD49+, and CD11b+ (Mac-1) cells mainly as macrophages in these tissues (Henderson et al. Reference Henderson, Hobbs, Mathies and Hogg2003; Serafini et al. Reference Serafini, De Santo, Marigo, Cingarlini, Dolcetti, Gallina, Zanovello and Bronte2004). In addition, we evaluated the frequency of cytokine-secreting cells by analysing IFN-γ and IL-4 production in T cells and IL-10 and IL-12 in CD11b+ cells. The results obtained for popliteal lymph nodes are shown in Fig. 5. The results obtained for spleens are included as Supplementary Fig. S1.

Fig. 5. Flow cytometry analysis of lymphoid and myeloid populations in popliteal lymph nodes of BALB/c (B), BALB/c nude (N) and C57BL/6 (C) mice infected for 6 (B6, N6 and C6) or 13 (B13, N13 and C13) weeks with L. (L.) amazonensis or non-infected (control – B, N, C). Percentages of T CD4+, T CD8+ cells, CD11b+ and NK cells. Statistical analysis by ANOVA. *P < 0·05 (differences among strains are not represented, but are mentioned in the text). Bars indicate standard deviation (s.d.).
Infected animals showed several differences in cell frequencies relative to controls. BALB/c and C57BL/6 popliteal lymph nodes showed lower percentages of CD4+cells 6 weeks after infection. In lymph nodes of BALB/c nude mice non-infected and after 6 and 13 weeks of infection, a higher proportion of CD4+ cells were positive for IL-4 (Fig. 5). CD4 cells positive for IFNγ were low and similar in all uninfected mice, increased in the three strains after 6 weeks of infection and were more abundant in lymph nodes of C57BL/6 mice, at the peak of lesions and parasitaemia in footpads for this strain. Accordingly, 13 weeks after infection we observed fewer parasites in C57BL/6 footpads and a lower percentage of IFNγ positive CD4 cells in the lymph nodes compared with 6 weeks (Fig. 5), probably reflecting parasite control and lower T cell recruitment and proliferation. IFNγ-secreting T CD8+ cells significantly increased in all mice after 6 weeks of infection and decreased in 13 weeks. NK cells decreased in BALB/c nude and C57BL/6 lymph nodes after 6 weeks of infection. The proportion of macrophages (CD11b+ cells) significantly increased in BALB/c nude lymph nodes in the 6th and decreased in the 13th week of infection, possibly due to recruitment and death of infected macrophages, respectively. Percentages of CD11b+ cells expressing IL-10 and IL-12 were low and similar in all uninfected mice. The proportion of CD11b+ cells producing IL-10 increased in BALB/c and C57BL/6 lymph nodes 6 weeks after infection, while IL-12 producing cells increased in most mice. Both cytokines have their production decreased after 13 weeks.
When total cells from lymph nodes and spleens were stimulated with PMA and ionomycin some quantitative differences were observed relative to non-stimulated cells and the production of most cytokines increased in infected animals (data not shown).
Macrophages of the three mouse strains show small differences in in vitro infection
To analyse whether cells and cytokines of the in vivo milieu were responsible for the observed differences in the parasite loads in lesions of the three mouse strains or if macrophages had intrinsic differences in infection, we compared in vitro infection of the three macrophages with promastigotes for 24 h. The results are shown in Fig. 6.

Fig. 6. In vitro infection of peritoneal macrophages from BALB, BALB/c nude and C57BL/6 with L. (L.) amazonensis promastigotes for 24 h. (A) Percentage of infected macrophages. (B) The number of amastigotes per macrophage. Representative experiment (of three independent experiments with similar profiles) with three technical replicates. Statistical analyses by ANOVA; *P < 0·05. Bars indicate standard deviation (s.d.).
Although the percentages of infected macrophages were similar in primary macrophages of the three mouse strains (Fig. 6A), amastigotes were significantly more abundant in BALB/c peritoneal macrophages than in C57BL/6 (Fig. 6B). These results indicate a small intrinsic difference among these two macrophages also in vitro.
DISCUSSION
This work compares several aspects of the infection by L. (L.) amazonensis in BALB/c nude, wild type BALB/c and C57BL/6 mice. Besides analysing the course of infection in the three mouse strains, we characterized cellular populations in the lesions and secondary lymphoid organs during two distinct ‘phases’ of the infection. Furthermore, we also compared the in vitro infection rate in macrophages from all groups.
Lesion size in BALB/c nude footpads increased later than in wild type BALB/c and C57BL/6 mice and was smaller than in BALB/c throughout the 13 weeks of infection. The course of lesion development (footpad thickness) was qualitatively in agreement with parasite loads estimated using luciferase-expressing parasites, a technique already employed for L. (L.) major, L. (L.) donovani and L. (L.) amazonensis, and validated as a sensitive method for measuring parasite numbers in infected macrophages and tissues (Beattie et al. Reference Beattie, Evans, Kaye and Smith2008; Reimao et al. Reference Reimao, Trinconi, Yokoyama-Yasunaka, Miguel, Kalil and Uliana2013). Since activation of CD4+ T cells contributes to recruitment of monocytes to the site of parasite inoculation (Soong et al. Reference Soong, Chang, Sun, Longley, Ruddle, Flavell and McMahon-Pratt1997), the defective inflammatory response in the immunodeficient BALB/c nude mice most likely results in the observed delay in infection. Differently from our data with BALB/c nude, nude mice from C57BL/6 background showed almost no increase in footpad thickness until twenty weeks after infection with L. (L.) amazonensis (Soong et al. Reference Soong, Chang, Sun, Longley, Ruddle, Flavell and McMahon-Pratt1997). We believe this discrepancy is mainly due to differences in the mice genetic background, although differences in parasite inoculation sites (upper hindfoot × footpad), parasite numbers (1 × 10⁵ vs 1 × 10⁶) and parasite strains used (MHOM/BR/77/LTB0016 × LV79) may also affect infection pattern. We observed a decrease in lesion size in C57BL/6 mice starting 7 weeks after infection, as mentioned by others (Abreu-Silva et al. Reference Abreu-Silva, Calabrese, Cupolilo, Cardoso, Souza and Goncalves da Costa2004; Felizardo et al. Reference Felizardo, Toma, Borges, Lima and Abrahamsohn2007, Reference Felizardo, Gaspar-Elsas, Lima and Abrahamsohn2012). Despite the regression, we still observed parasites in C57BL/6 footpads 13 weeks after infection, in much smaller numbers than in BALB/c and nude mice, as described by others (Felizardo et al. Reference Felizardo, Gaspar-Elsas, Lima and Abrahamsohn2012). Nude mice had higher parasite burdens than the wild type strains in the last 2 weeks. Similarly, skin lesions in BALB/c scid mice have been shown to contain about 30-fold more amastigotes than those from wild type BALB/c (Terabe et al. Reference Terabe, Kuramochi, Hatabu, Ito, Ueyama, Katakura, Kawazu, Onodera and Matsumoto1999).
In agreement with the delayed lesion development, BALB/c nude mice presented no fibrosis and necrosis 6 weeks after infection. Ulcers and oedemas were present only in BALB/c lesions, probably due to inflammation associated with high parasite numbers. Absence of ulcers was reported in L. (L.) amazonensis infection of immunodeficient BALB/c scid and RAG−/− mice, different from wild type counterparts (Terabe et al. Reference Terabe, Kuramochi, Hatabu, Ito, Ueyama, Katakura, Kawazu, Onodera and Matsumoto1999), indicating that T dependent responses have a role in ulcer formation. Similarly, non-ulcerative nodules were also described in human cases of Leishmania and HIV co-infection (Terabe et al. Reference Terabe, Kuramochi, Hatabu, Ito, Ueyama, Katakura, Kawazu, Onodera and Matsumoto1999).
Infection for 6 weeks significantly increased the abundance of lymphocytes, macrophages, neutrophils, eosinophils and basophils in footpads of almost all mice. The similarity between BALB/c and C57BL/6 lesions probably reflects active parasite replication and cell recruitment in both mouse strains at this phase of infection. On the other hand, BALB/c nude had fewer lymphocytes, eosinophils and basophils, surely due to the lower recruitment of T cell in these mice. Most of the cell types analysed decreased in C57BL/6 lesions after 13 weeks, probably associated with the control of infection in this strain. Nude and BALB/c mice have similar number of macrophages in footpads after 13 weeks of infection by histological analysis, different from what we have previously observed by FACS (Teixeira et al. Reference Teixeira, Velasquez, Lepique, de Rezende, Bonatto, Barcinski, Cunha-Neto and Stolf2015). This difference can be attributed to the macrophage fragility of nude mice, which rupture during processing for FACs, as opposed to the higher efficacy of histopathological analysis in preserving tissue integrity in athymic mice lesions.
Analysis by flow cytometry allowed a more precise characterization of cell types present in draining lymph nodes and spleens. We observed a decrease in the percentage of CD4+ T cells in lymph nodes of BALB/c and C57BL/6 after 6 weeks of infection, reaching percentages similar to those already described after infection with L. (L.) mexicana (Hsu and Scott, Reference Hsu and Scott2007). This decrease is probably due to the migration of lymphocytes to infected footpads, as suggested by our histological analysis. IFNγ + CD4+ cells increased in all groups after 6 weeks of infection and were more abundant in C57BL/6. The higher frequency of cells with Th1 profile in this strain probably accounts for the parasite control and lesion regression observed after 7 weeks. Interestingly, BALB/c nude had higher proportions of IL-4+CD4+ cells in lymph nodes and spleens, and of IFNγ +CD4+ and IFNγ +CD8+ cells in spleens after infection. This data indicates that the few nude CD4+ and CD8+ cells are capable of producing IL-4 and IFNγ, but the lower frequency of T cells in BALB/c nude probably results in a much lower cytokine level than in wild type mice. IFNγ +CD8+ cells significantly increased in draining lymph nodes after 6 weeks and decreased 13 weeks after infection in all mice. These cells, which could help in containing parasite growth, probably suffered exhaustion after intense activation. In fact, enhanced expression of PD-1 and functional inactivation of CD8+ cells have been described after infection with Leishmania (Martinez Salazar et al. Reference Martinez Salazar, Delgado Dominguez, Silva Estrada, Gonzalez Bonilla and Becker2014). Infection for 6 weeks increased IL-12+CD11b+ cells in lymph nodes of the three mouse strains, and the proportion of these cells decreased after 13 weeks. IL-12 is produced by M1 macrophages, classically ‘activated’ by LPS, IFNγ or CSF-1 (Murray et al. Reference Murray, Allen, Biswas, Fisher, Gilroy, Goerdt, Gordon, Hamilton, Ivashkiv, Lawrence, Locati, Mantovani, Martinez, Mege, Mosser, Natoli, Saeij, Schultze, Shirey, Sica, Suttles, Udalova, van Ginderachter, Vogel and Wynn2014) in response to infection and its decrease after 13 weeks may correlate to the loss of control of the parasite burden in BALB/c and BALB/c nude mice. IL-10+CD11b+ cells increased in BALB/c and C57BL/6 after 6 weeks of infection and decreased thereafter. IL-10 is induced in macrophages by LPS and Leishmania and favours infection (Buxbaum, Reference Buxbaum2015). The smaller numbers of IL-10+ macrophages in BALB/c nude lymph nodes are probably due to the less pronounced inflammation in these athymic mice 6 weeks post infection.
The similarity of BALB/c and BALB/c nude macrophages in vitro in terms of percentage of infection and parasites per infected cell confirmed that the differences in the course of infection and parasite loads between lesions of these mice were due to in vivo milieu and not to macrophage intrinsic characteristics. Fewer parasites were present in C57BL/6 macrophages than in BALB/c cells after 24 h of infection, suggesting that the intrinsic differences in these two macrophages may affect parasite survival or growth. In fact, after LPS stimulation C57BL/6 and BALB/c macrophages are more prone to activate iNOS and arginase pathways, respectively (Mills et al. Reference Mills, Kincaid, Alt, Heilman and Hill2000), and these different profiles may affect L. (L.) amazonensis survival. Similar to our results, BALB/c peritoneal macrophages showed higher infection indexes in vitro by L. amazonensis compared to C3H/HePas (Serezani et al. Reference Serezani, Perrela, Russo, Peters-Golden and Jancar2006).
We believe that our work contributes to unravel the role of host immune system in the course of L. (L.) amazonensis infection by showing the importance of T cell-dependent responses and mouse background in parasite control. Differences in cell populations and cytokine production in footpads and lymph nodes of BALB/c, BALB/c nude and C57BL/6 mice are probably responsible for the different profiles of lesion development and parasite burden after Leishmania infection.
SUPPLEMENTARY MATERIAL
To view supplementary material for this article, please visit http://dx.doi.org/10.1017/S003118201600024X
ACKNOWLEDGEMENTS
We thank Marcello Barcinski, Valeria Borges and Claudia Brodskyn for important suggestions during this work and Silvia Boscardin for carefully revising the manuscript. We also acknowledge CEFAP facility for making available the bioimaging equipment (IVIS), Cristiana Trinconi for the help with IVIS analysis and Fabio Siviero for helping with HE images.
FINANCIAL SUPPORT
This work was supported by FAPESP (grant number 2008/56923-1) and CNPq (grant number 473000/2008-3) to BSS.
CONFLICT OF INTEREST
None.


