


Phonological processing is crucial for second language (L2) listening and speaking abilities, the two key components of L2 communicative competence (Brown & Lee, Reference Brown and Lee2015). In language acquisition, phonological processing is also important because, to the extent it can be observed, it allows researchers to understand learners’ real-time use of L2 phonological knowledge during comprehension of natural speech in the target language. Many studies on L2 phonology have examined learners’ perception and production of L2 phones, which represent the product of L2 phonological knowledge (e.g., Baker & Trofimovich, Reference Baker and Trofimovich2006; Best & Tyler, Reference Best, Tyler, Bohn and Munro2007; Derwing & Munro, Reference Derwing and Munro2015; Díaz-Campos, Reference Díaz-Campos2004; Flege, Reference Flege and Strange1995; Lord & Harrington, Reference Lord and Harrington2013; Saito et al., Reference Saito, Trofimovich and Isaacs2016). Few studies to date, however, have investigated learners’ use of L2 phonological knowledge in real time, which represents the process of L2 phonological knowledge. The field of second language research (SLA), therefore, has limited understanding of the differences between L1 and L2 phonological processing, the effects of the L1 phonetic system on L2 phonological processing, and different processing patterns across various L2 target phones. Recent psycholinguistic research on SLA has developed a variety of new online measures, including self-paced listening (SPL), self-paced reading, eye-tracking, and event-related episodes (e.g., Jackson, Reference Jackson2008; Lim & Christianson, Reference Lim and Christianson2015; Pliatsikas & Marinis, Reference Pliatsikas and Marinis2013; Roberts, Reference Roberts2012; Tolentino & Tokowicz, Reference Tolentino and Tokowicz2011; Van Hell & Tokowicz, Reference Van Hell and Tokowicz2010). However, most of the research using these tools has focused on morphosyntactic rather than phonological processing.
One consistently documented finding in L2 phonology is that not all L2 sounds are equally challenging to acquire. For example, several previous studies (e.g., Bohn & Flege, Reference Bohn and Flege1992; Flege, Reference Flege1987; Flege et al., Reference Flege, Bohn and Jang1997) have reported that learners are less successful in perceiving and producing L2 phones when two or more are mapped to a single L1 category (many-to-one mapping) than when each is mapped to a separate L1 counterpart (one-to-one mapping). Very few studies, however, have investigated how such asymmetrical L2 phonological development might affect learners’ real-time processing. Limited L2 phonological knowledge can be expected to affect learners’ L2 phonological processing, resulting in poor comprehension. The present study examines whether asymmetry in L2 phonological knowledge leads to inaccurate L2 phonological processing and unsuccessful L2 comprehension. Employing a word-by-word SPL task (Ferreira et al., Reference Ferreira, Henderson, Anes, Weeks and McFarlane1996), this study observed learners’ L2 phonological processing in real time and identified any effects of one-to-one versus two-to-one mappings of L2 phones to L1 categories.
LITERATURE REVIEW
THE EFFECTS OF L1–L2 PHONOLOGICAL MAPPINGS ON THE DEVELOPMENT OF L2 PHONOLOGICAL KNOWLEDGE
Previous research has reported that L2 phonological learning is affected by differences in L1 to L2 phonological mappings. For example, Flege’s (1995) speech learning model (SLM) predicts that learners will experience little learning difficulty in perceiving and producing an L2 target when an identical category exists in their L1 system, which allows one-to-one mapping from L2 to L1. Similarly, Best’s (1995) perceptual assimilation model (PAM) predicts that contrasting L2 phones are perceived with no difficulty when they are mapped to two different L1 categories. Both models also predict that if an L2 phone is radically different and thus new to learners (i.e., differing substantially from any L1 category), a new category is created and the perception and production of the L2 phone can eventually become more accurate. These models further predict, in contrast, that learning difficulty increases when an L2 phone is neither new nor identical but is perceptually similar (i.e., acoustically similar but not the same) to an L1 category (Flege, Reference Flege and Strange1995). In this case, learners tend to map the L2 phone to a member of an existing L1 category, rather than creating a new L2 category. This usually happens in cases of two-to-one mapping, where two different L2 phones are mapped to a single L1 category (Best, Reference Best and Strange1995). In such two-to-one phonological mappings, the two L2 phones become perceptually indistinguishable for L2 learners, resulting in inaccurate L2 perception and production.
A range of previous research supports this view of L2 phonological learning. Bohn and Flege (Reference Bohn and Flege1992), for example, examined native German speakers’ learning of four English vowels, /i, ɪ, ɛ, æ/. The first three (/i, ɪ, ɛ/) exist in the German vowel system but the fourth (/æ/) does not. An intelligibility test found that the German speakers produced /i/ versus /ɪ/ more accurately than /ɛ/ versus /æ/, as they tended to mispronounce /æ/ as /ɛ/. A similar study by Flege et al. (Reference Flege, Bohn and Jang1997) found that L1-Korean speakers had more difficulty than L1-German speakers in learning these four English vowels. Korean has neither /ɪ/ nor /æ/, and the learners mispronounced /ɪ/ and /æ/ as /i/ and /ɛ/, respectively. Several studies have also found sound assimilation effects for L1-English speakers learning L2-French (e.g., Flege, Reference Flege1987; Flege & Hillenbrand, Reference Flege and Hillenbrand1984; Fowler et al., Reference Fowler, Sramko, Ostry, Rowland and Hallé2008). Flege (Reference Flege1987) examined English speakers’ production of French /y/ and /u/. French /y/ is radically different from any English vowel (i.e., new to the learners), while French /u/ is similar to English /u/ but produced further back. Flege showed that the learners produced French /y/ accurately, but they fronted the French /u/. The findings of these studies, taken together, suggest that L2 phones are harder to process when the L1 has acoustically, perceptually, and articulatorily similar counterparts in its system.
While some studies have argued that extensive L2 experience may lead to an ability to dissimilate L2 and L1 sounds and produce accurate, targetlike categories (e.g., Flege, Reference Flege1991; Flege et al., Reference Flege, Bohn and Jang1997; Ingram & Park, Reference Ingram and Park1997), other studies do not support this argument (e.g., Cebrian, Reference Cebrian2006; Flege et al., Reference Flege, Munro and Fox1994; Munro, Reference Munro1993). Flege et al. (Reference Flege, Munro and Fox1994), for example, found no significant difference between experienced versus inexperienced L1-Spanish-speaking English learners’ dissimilarity ratings for English vowels. Munro (Reference Munro1993) reported no significant correlation between Arabic speakers’ length of residence in the United States and the acoustical accuracy of their L2 English vowel production. Further, Cebrian (Reference Cebrian2006) found no positive effect of L2 experience in Catalan speakers’ English vowel perception. Taken together, these studies illustrate that (a) the categorization of L2 phones can be strongly affected by speakers’ L1 system, particularly when the targets are acoustically similar to the L1 categories; and (b) interference from the L1 system may persist despite continuous, long-term L2 exposure.
Although much research suggests L1 effects on the acquisition of L2 phonological knowledge, many investigations are limited by methods that measure only outcomes. The presence or absence of L2 phonological knowledge is typically assessed by, for example, sound discrimination/judgments (to evaluate perception), or formant values or native speakers’ subjective judgments of the products of oral elicitation (to evaluate production). Such decontextualized tests cannot fully represent learners’ real-time use of L2 phonological knowledge. In SLA, the products of knowledge (i.e., explicit knowledge) and the processes of knowledge (i.e., implicit knowledge) are considered two distinct mechanisms, and the presence of one type of knowledge does not imply the presence of the other (see Ellis, Reference Ellis2005; Hulstijn, Reference Hulstijn2002). Because previous studies have largely assessed learners’ L2 phonological knowledge using focused, analytical, context-reduced tests, and observed only the end product, their results may not effectively represent the success or failure of L2 pronunciation in terms of communicative values. By employing a context-embedded situation, the current study hopes to provide a fuller explanation of how processing difficulties related to the acquisition of L2 phonology may cause L2 communication difficulties in real-time interactions.
SELF-PACED LISTENING AS A MEASURE OF L2 PHONOLOGICAL PROCESSING
The SPL technique (Ferreira et al., Reference Ferreira, Henderson, Anes, Weeks and McFarlane1996) is an auditory equivalent of the self-paced reading paradigm (Just et al., Reference Just, Carpenter and Woolley1982). It is a computer-assisted online measure that can examine learners’ processing of L2 linguistic information in real time. In this method, a participant listens to a sentence broken into a sequence of sentence segments (e.g., words or phrases). The participant controls the listening speed by pressing a key to move onto each new segment. The SPL technique observes the response time (RT) for each segment. A longer RT indicates a participant’s need for more time to process the particular segment; prolonged listening times are thus a signal of difficulties that arise during processing. That is, difficulty in comprehending a particular sentence segment and integrating it with what has already been heard will be evident in RTs that are longer than the RTs for similar segments that are comprehended and integrated without difficulty (Papadopoulou et al., Reference Papadopoulou, Tsimpli, Amvrazis, Jegerski and VanPatten2013).
Marinis (Reference Marinis, Belikova, Meroni and Umeda2007, Reference Marinis, Algueró and Freitas2008) and Marshall et al. (Reference Marshall, Marinis and van der Lely2007) further developed the SPL technique by integrating it with a picture verification (PV) task. SPL with PV (SPL-PV) consists of three components: (a) picture presentation (matching or mismatching with the following sentence); (b) segment-by-segment sentence listening; and (c) PV. In PV, participants indicate whether the picture matches or mismatches the sentence they heard. This step is intended to ensure that the participants’ processing during listening is associated with meaning as well as sound, and that, therefore, the RTs are more likely to reflect the time needed to process the auditory stimuli as meaning-focused linguistic input. Based on a similar assumption as the original SPL technique, participants are expected to show longer RTs for critical segments in a mismatch condition than in a match condition. As a result, relatively longer RTs for critical sentence segments in a mismatch condition indicate participants’ sensitivity to the particular linguistic form.
SPL-PV, as an online comprehension task, is reportedly more reliable than offline tests to assess learners’ perceptual sensitivity to the target language and whether a linguistic representation is established in a learner’s mind (Marinis, Reference Marinis, Unsworth and Blom2010; Marsden et al., Reference Marsden, Thompson and Plonsky2018). Unlike offline tasks such as AXB, SPL-PV is implicit in nature. SPL-PV can better “reflect the underlying process involved when the learners process the stimuli in real-time” (Marinis, Reference Marinis, Unsworth and Blom2010, p. 155), and is thought to “provide a window into implicit processing and, possibly, into learners’ implicit underlying linguistic representations” (Marsden et al., Reference Marsden, Thompson and Plonsky2018, pp. 6–7). RTs in SPL-PV are elicited mainly during, not after, the comprehension task, which is virtually time-pressured by the self-pacing. The time pressure inhibits learners from accessing explicit knowledge of the target language and responding strategically. For this reason, the technique allows observation of the participants’ unconscious and automatic responses to the language stimuli.
Partial evidence for the usefulness of SPL-PV as an online measure for language processing has been offered by some previous studies on learners’ processing of L1/L2 morphosyntatic information (e.g., Marinis, Reference Marinis, Belikova, Meroni and Umeda2007, Reference Marinis, Algueró and Freitas2008; Marinis & Saddy, Reference Marinis and Saddy2013; Marshall et al., Reference Marshall, Marinis and van der Lely2007; Papadopoulou & Tsimpli, Reference Papadopoulou and Tsimpli2005; Peristeri & Tsimpli, Reference Peristeri and Tsimpli2013). Marinis and Saddy (Reference Marinis and Saddy2013), for example, observed whether bilingual children (L2-English) and monolingual children (L1-English) with specific language impairment (SLI) showed similar levels of difficulty processing English passive structures, which would indicate uniform patterns of language development. They found that both groups showed longer RTs for the critical segments with passive morphosyntactic cues (e.g., was kissed, by the camel). They also, however, found a difference in processing from RTs for the postcritical segment (e.g., at the zoo). Specifically, the L1–SLI group but not the learner group showed longer RTs for the postcritical segment, indicating that the L1–SLI children were still processing the mismatch between the sentence and the picture resulting from the initial analysis even after the critical segments, while the L2 children had completed the reanalysis before they arrived at the postcritical segment. Thus, despite the two groups’ similar performance in the PV task, the RTs from the SPL task imply differences in the language development of L1–SLI children and L2 children.
DIFFICULTIES IN L2 PHONOLOGICAL PROCESSING: THE CASE OF KOREAN LEARNERS OF ENGLISH
Korean has eight monophthongs (/ɑ, ɛ, i, o, u, ʌ, ɯ, ø/) while American English (AE) has 12 monophthongs (/i, ɪ, e, ɛ, æ, ɑ, ʌ, ə, ɔ, o, ʊ, u).Footnote 1 Note that none of the AE and Korean vowels represented using the same IPA symbols are acoustically identical.
Because AE has a larger and denser vowel inventory than Korean, it is likely that AE and Korean vowels are mapped to each other in many-to-few relations as shown in Figure 1. Indeed, previous research (e.g., Baker & Trofimovich, Reference Baker and Trofimovich2005; Baker et al., Reference Baker, Trofimovich, Flege, Mack and Halter2008; Han et al., Reference Han, Choi, Lim and Lee2011a, Reference Han, Choi, Lim and Lee2011b; Jun & Cowie, Reference Jun and Cowie1994; Lee & Cho, Reference Lee and Cho2018; Tsukada et al., Reference Tsukada, Birdsong, Bialystok, Mack, Sung and Flege2005; Yang, Reference Yang1996) has identified Korean L1 speakers’ tendency to map two contrastive English vowels to a single Korean vowel category (e.g., English /i/ and /ɪ/ to Korean /i/, English /ɛ/ and /æ/ to Korean /ɛ/, English /ə/ and /ʌ/ to Korean /ʌ/, English /ʊ/ and /u/ to Korean /u/, and English /ɔ/ and /o/ to Korean /o/; Figure 1). That is, L1-Korean speakers perceive (as measured by subjective ratings using a Likert scale or categorical discrimination tasks) and produce (as measured by formant values of speech output or L1-AE speakers’ judgments) less distinction between such English vowel pairs.

FIGURE 1. Comparison of the F1–F2 vowel space of 11 English vowels and 8 Korean vowels (highlighted; Lee, Reference Lee2002). Shaded circles show possible two-to-one mappings from English to Korean vowels.
Such many-to-few mappings between English and Korean vowels may lead to learners’ inaccurate perception of an English vowel, potentially resulting in miscomprehension. For example, when the English target vowel /ɪ/ (e.g., s i t in [2]) is replaced with the English vowel /i/ (e.g., s ea t in [1]), the error might not be perceived by an L1-Korean speaker; it is likely that the Korean speaker would accept the sentence in (2) as the sentence in (1) without perceiving an error.
This is because Korean learners tend to map the two contrastive English vowels /i/ and /ɪ/ to a single Korean vowel category /i/. Such two-to-one mapping is expected to lead to learners’ poor discrimination of the two contrastive English vowels, and in turn to lower perceptual sensitivity to phonological errors caused by the misuse of /i/ instead of /ɪ/, or vice versa. In such cases, therefore, we would expect learners to experience processing errors and comprehension difficulties.
An opposite scenario may occur for the English target vowel /i/ (e.g., B ea st in [3]) if it is replaced with /ɛ/ (e.g., B e st in [4]).
Korean learners would map the English vowels /i/ and /ɛ/ to the separate Korean vowel categories /i/ and /ɛ/, respectively. Within this one-to-one mapping context, the Korean learner would be expected to successfully distinguish the English vowels /i/ and /ɛ/, and thus to successfully identify the error in the target vowel use. In this case, learners would have relatively high perceptual sensitivity to a phonological error caused by the misuse of /i/ instead of /ɛ/, and therefore, we would not expect the learners to experience the processing errors and comprehension difficulties that we do expect to see in the two-to-one mapping context.
As these examples illustrate, Korean learners’ sensitivity in vowel perception could be significantly affected by L1–L2 phonological mapping. Mapping issues, therefore, may lead to Korean learners’ persistent processing difficulties in L2 English, which would further negatively affect their L2 comprehension during real-time language use.
THE STUDY
The aim of the present study is to observe learners’ sensitivity to L2 phonology and to identify differences in their processing of different L2 phones. The previous research has consistently reported asymmetrical difficulty levels in the learning of L2 phones caused by different types of L1–L2 phonological mapping. The present study, therefore, attempts to investigate whether one-to-one versus two-to-one mappings between L2 targets and their L1 counterparts result in different degrees of sensitivity in real-time phonological processing.
To observe L2 phonological processing and comprehension, the study used an SPL-PV task. There are several benefits of employing SPL-PV in this context of research. First of all, SPL-PV is an online measure that can examine participants’ real-time L2 phonological processing, not just the outcome of comprehension. Also, in SPL-PV, L2 targets are presented in a contextualized, meaningful speech stream rather than in a decontextualized manner (e.g., as in sound discrimination, similarity judgment, and oral elicitation tasks). Hence, the method is expected to be more effective for assessing learners’ real-time use of their phonological knowledge to make meaning rather than as the primary focus of the participants’ attention. No study to date has employed SPL-PV in the context of L2 pronunciation. The current study extends the use of SPL-PV to this context in the expectation that it will allow the observation of learners’ sensitivity to L2 phonology and their phonological processing.
The study asks one main research question:
-
• In the SPL-PV paradigm, do learners show differential phonological sensitivity to L2 target vowels when the target (e.g., English /i/) is presented in a one-to-one mapping context (e.g., English /i/-/æ/; hearing bea n when b a n is expected) versus a two-to-one mapping context (e.g., English /i/-/ɪ/; hearing b ea n when b i n is expected)?
The study will evaluate learners’ differential sensitivity to the target vowels by RTs (i.e., longer RTs when hearing inaccurate pronunciation show higher sensitivity) and/or PV accuracy rates (i.e., higher accuracy rates show higher sensitivity). The study hypothesized that equal sensitivity to the L2 target (e.g., b ea n) regardless of mapping context will result in equivalent RT increases in the two contexts when learners encounter violations of their expectations in the L2 targets (e.g., the RT increase for b ea n when b a n is expected = the RT increase for b ea n when b i n is expected). In contrast, different degrees of sensitivity to the L2 targets in the two mapping contexts will result in differences in RT increases by context (e.g., the RT increase for b ea n when b a n is expected > or < the RT increase for b ea n when b i n is expected). The learners’ PV accuracy scores are also expected to differ accordingly.
METHOD
PARTICIPANTS
A total of 67 undergraduate students (9 L1-English speakers and 58 adult L2-English learners) enrolled in a university located in Seoul, Korea participated in this study. The participants were undergraduate students with various majors (e.g., international relations, education, environmental science, chemical engineering, business administration, English, mathematics). The nine native speakers (L1 participants) of English (male = 5, female = 4) were in their early twenties (M = 22.11, SD = 1.83). All of them came from the United StatesFootnote 2 for the purpose of study abroad, and identified English as their native language. At the time of participation, the nine L1 participants’ lengths of residence in Korea were 24 months or less (6 months = 1; 9 months = 1; 12 months = 1; 18 months = 1; 24 months = 5), and the mean age at which they began learning Korean was 20.56 years (SD = 1.94). Their self-reported Korean proficiency was between beginner and intermediate, based on their rankings on a 6-point Likert scale (0 = Beginner; 1 = Intermediate; 2 = High-intermediate, 3 = Advanced, 4 = Near-native, 5 = Native) for four skills: listening (M = .44, SD = .53), speaking (M = 1.00, SD = .71), reading (M = .89, SD = .60), and writing (M = .67, SD = .50). None of them had taken a standardized Korean proficiency test. The 58 English L2 learner participants (male = 28, female = 30) were aged between 20 and 27 (M = 23.03, SD = 2.79) and identified their first language as Korean. Ten students reported having been to English-speaking countries (e.g., the United States, Canada, England, Singapore, Australia) for the purposes of family visits, study abroad, or tourism; eight had lived in such countries for more than six months. The other 48 students reported that they had learned English only in Korea in formal language learning contexts. The mean age at which the learners started to learn English was 7.80 (SD = 2.56) and the mean length of their English learning was 14.66 years (SD = 3.47). The L2 participants’ English proficiency was between high-intermediate and advanced according to their standardized English proficiency test scores (TOEIC scores reported by 48 L2 learners, M = 835.96; SD = 47.43) and self-reporting for the four English skills on a 6-point Likert scale (0 = Beginner; 1 = Intermediate; 2 = High-intermediate, 3 = Advanced, 4 = Near-native, 5 = Native): listening (M = 2.43, SD = .89), speaking (M = 2.18, SD = 1.06), reading (M = 2.61, SD = .82), and writing (M = 2.14, SD = 1.02).
L2 TARGETS
The L2 targets used in this study were the four English front vowels /i/, /ɪ/, /ɛ/, and /æ/, which have been identified as perceptually similar for Korean native speakers (Flege et al., Reference Flege, Bohn and Jang1997).
STIMULI MATERIALS
Critical Items
The study employed six English vowel pairs using the four target vowels: /i/-/ɪ/; /ɛ/-/æ/; /i/-/ɛ/; /i/-/æ/; /ɪ/-/ɛ/; and /ɪ/-/æ/. Four of the pairs consist of vowels that have one-to-one mappings (Type 1: /i/-/ɛ/; /i/-/æ/; /ɪ/-/ɛ/; /ɪ/-/æ/) while the other two pairs consist of vowels that have two-to-one mappings (Type 2: /i/-/ɪ/; /ɛ/-/æ/) between English and Korean (Figure 2).
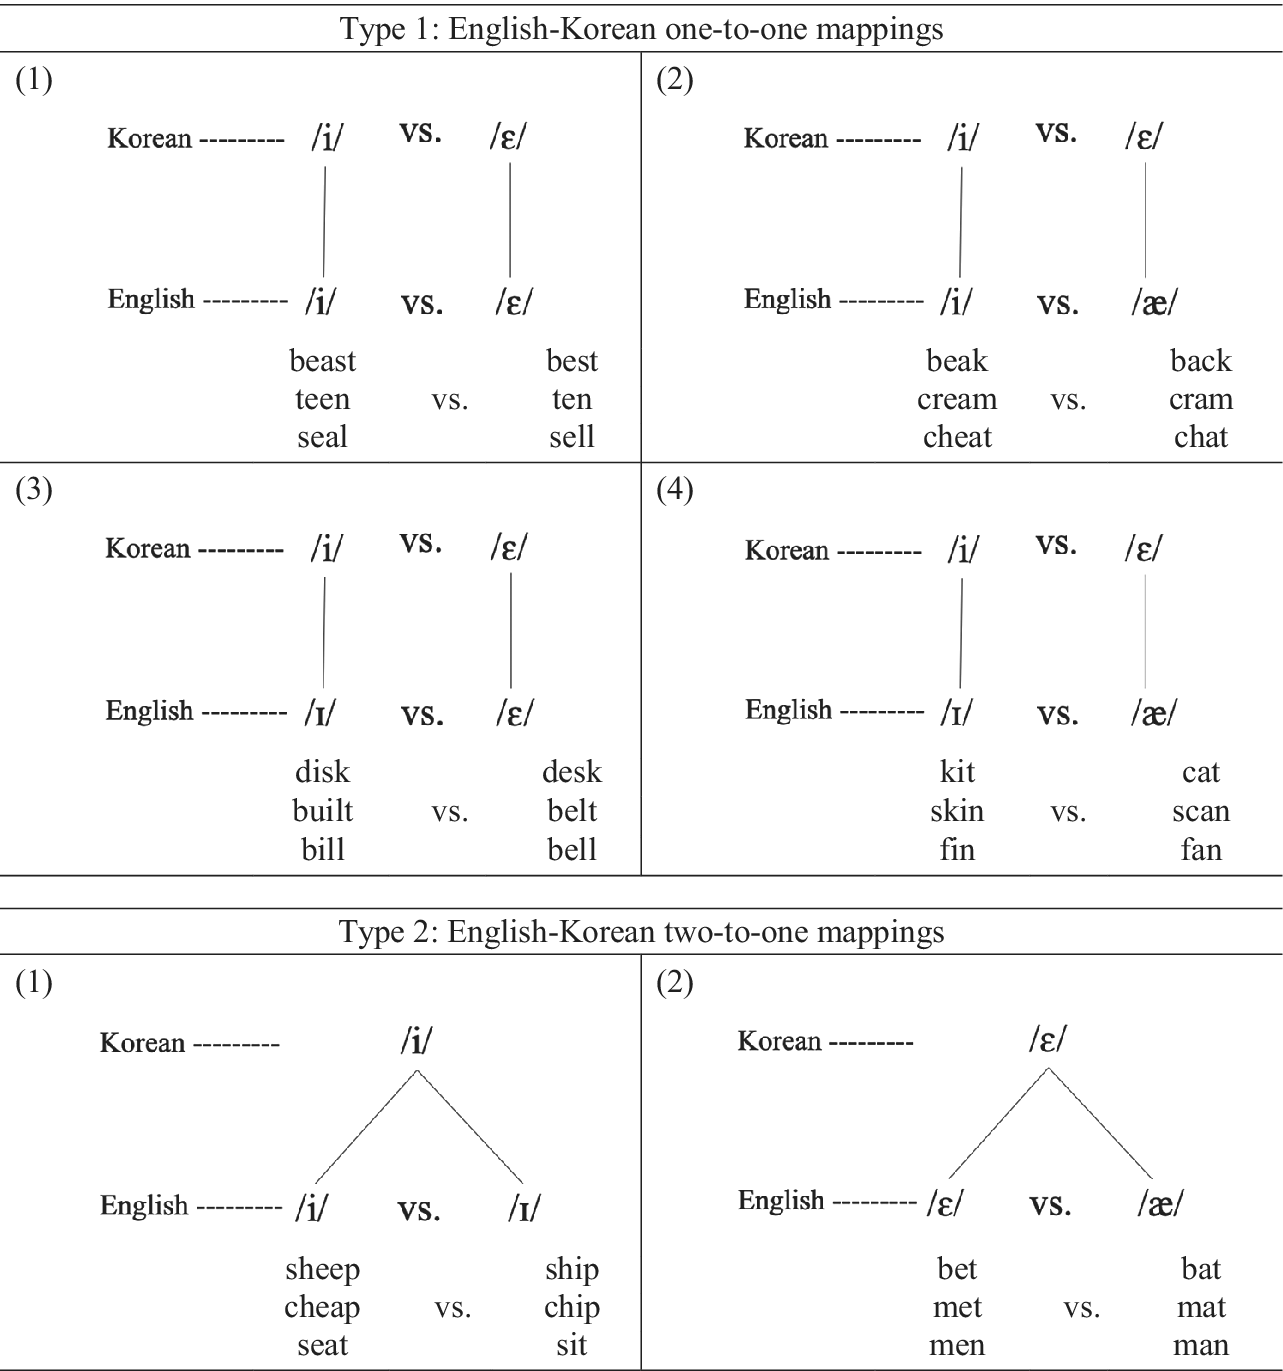
FIGURE 2. Vowels with one-to-one mappings (Type 1) versus two-to-one mappings (Type 2).
The task had 48 critical items (sentences). The sentences were read by a male native speaker of American English (age = 31), and recorded in a sound-attenuated room using PRAAT version 6.0.16 (Boersma & Weenink, Reference Boersma and Weenink2007; sampling at 44.1 kHz, 16 bit resolution, mono). The speaker was asked to read the sentences with natural intonation for declarative sentences but with short pauses in between words. Each word was cut out and saved as a separate .wav file at the midpoints of the short pauses before and after the word.
The experiment included a total of 103 items consisting of 7 training items, 48 filler items, and 48 critical items (24 items with Type 1 vowel pairs, i.e., six each for the four pairs with /i/, /ɪ/, /æ/, and /ɛ/, and 24 items with Type 2 vowel pairs, i.e., 12 for /i/ vs. /ɪ/ and 12 for /ɛ/ vs. /æ/). Of the 48 critical items, half correctly describe (i.e., match) the pictures (Example 1 in Figure 3) and half incorrectly describe (i.e., mismatch) the pictures (Example 2 in Figure 3). The match/mismatch items were then counterbalanced across Type 1 pairs (12 match and 12 mismatch) and Type 2 pairs (12 match and 12 mismatch). See Table 1 for examples (a complete list of stimuli materials appears in Appendix A). Each sentence included one word employing a target vowel (i.e., a critical word). For mismatch items, each of the critical words was replaced with a minimal pair counterpart. For example, the critical word band (/bænd/) in The girl is wearing a band on her head was replaced with bend (/bεnd/): The girl is wearing a *bend on her head (Figure 3). All critical items employed one of two syntactic structures:
-
1. [NP1 [[VP] [[PP 1 ] PP2]]] with intransitive verbs
The woman is talking to the teenage girls on the football field.
The doctors are preparing for an MRI *skin (should be scan) of a patient.
-
2. [NP1 [[VP] [[NP 2 ] PP]]] with transitive verbs
The dog is chasing a sheep in the grass.
Two children are watching Beauty and the *Best (should be Beast) on TV.

FIGURE 3. Example stimuli sentences for the SPL-PV task.>Note: R0, Region 0 (baseline); R1, Region 1 (critical region); R2, Region 2; R3, Region 3.
TABLE 1. Stimuli materials for the SPL-PV task (complete list in Appendix A)

In both, the critical word occurred only in the third phrasal position, that is, PP1 in the first structure or NP2 in the second structure.
Five linguistic characteristics were analyzed across the 48 critical stimuli items: (a) word frequency of the critical words; (b) syllabic structure of the critical words; (c) number of words preceding the critical word within each syntactic phrase; (d) number of words preceding the critical word in each sentence; (e) phrasal location of the critical region (Region 1) in relation to the following regions (Region 2 and Region 3).Footnote 3 As for the word frequency of the 48 critical words, their mean lexical dispersion expressed as Julland’s D (a frequency measure adjusted by word distribution, ranging from 0.00 to 1.00; Leech & Rayson, Reference Leech and Rayson2014) was fairly high at 0.90 (SD = 0.05). In terms of their syllabic structures, there were four types: CVC = 30, CVCC = 13, CCVC = 4, and CVC.VC = 1. For the number of words preceding the critical word within each syntactic phrase, there were five types: zero preceding words in the phrase = 5; one = 25; two = 13; three = 4, and five = 1. For the number of words preceding the critical word in each sentence, there were five types: three preceding words in the sentence = 2; four = 4; five = 21; six = 16; and seven = 5. Lastly, as for the phrasal location of Region 1, Region 2, and Region 3, there were three types: [phrase I Region 1] [phrase II Region 2, Region 3] = 42; [phrase I Region 1, Region 2] [phrase II Region 3] = 5; and [phrase I Region 1, Region 2, Region 3] = 1. RTs can be highly sensitive to various item-related factors that might differentially affect learners’ processing of experimental stimuli. To ensure that any variation in RTs at the critical region was due to the processing of the target vowels in the critical items, and not due to other factors, the study conducted a preliminary RT analysis (see “A Homogeneity Check” in “Results”). In the case that a significant effect was found for any of these five factors, it was identified as a violation of item homogeneity, and the particular item was removed from the RT analysis. In this way, the study attempted to ensure that any variations in RTs at the critical region were due to the processing of the target vowels.
Filler Items
Forty-eight filler items, consisting of 12 match items and 36 mismatch items, were created for the task. The match filler items paired a picture and a sentence that matched each other (Example 3 in Figure 3). The mismatch filler items had a picture paired with a sentence incorrectly describing it, in which the incorrectness was due to the misuse of lexical items (Example 4 in Figure 3). The syntactic structures used for the fillers were the same as for the critical items:
-
1. [NP1 [[VP] [[PP1] PP2]]] with intransitive verbs
The dog is sitting in a cart with a child.
Some people are *lying (should be sitting) on the benches near the lake.
-
2. [NP1 [[VP] [[NP2] PP]]] with transitive verbs
A squirrel is holding a nut in a tree.
A * baby (should be man) is making a cocktail for someone.
For the 36 mismatch filler items, the position of the erroneous words was counterbalanced across the first, second, and fourth phrasal positions to prevent the participants from noticing the position of the critical word in the critical items (i.e., third phrasal position). Thus, 12 filler sentences had the incorrect words in the first phrasal position (e.g., * Ten [should be four] people are playing music with their instruments), 12 sentences had them in the second phrasal position (e.g., The woman is *catching [should be buying] some fish from the market), and 12 sentences had them in the fourth phrasal position (e.g., A man is juggling balls in the *classroom [should be garden]).
The items were presented in a fixed pseudorandom order so the same experimental items and/or filler items would not appear more than two times together. The 96 items were presented in three blocks of 32 items. Each block consisted of 16 critical items (eight Type 1 vowel pairs and eight Type 2 vowel pairs) and 16 filler items. The item order was pseudorandomized across participants so no three critical or filler pairs would appear consecutively.
INSTRUMENT: SELF-PACED LISTENING WITH PICTURE VERIFICATION
In the SPL-PV task, participants were presented with a picture (e.g., a man resting in the shade of a tree). While the picture remained on screen, they listened to a sentence word-by-word (e.g., a-man-is-avoiding-the-*hit [should be heat]-under-the-tree), moving to each new word by pressing a space bar. The participants were instructed to press the space bar as quickly as possible when they were ready to hear the next word. After listening to the full sentence, they were prompted to judge whether the sentence they had heard matched the picture as quickly as possible. The participants were asked to press “z” when the sentence matched the picture and “/” when it mismatched. Their responses were recorded to judge their accuracy. Once the participants pressed “z” or “/” the next trial was triggered (Figure 4). The times between the offset of each word and the button press were recorded as RTs. A longer RT at a particular word in a sentence is interpreted to reflect processing difficulties caused by the violation of an expectation based on the presented picture. The participants’ accuracy score on the PV was considered an outcome of the accuracy of their sound processing of the target English vowels.

FIGURE 4. An example trial of the SPL task with PV.
PROCEDURE
The experiment was conducted in a sound-attenuated room, where participants wore headphones to hear the stimuli and saw the pictures on a computer screen. Each participant was tested individually, with one of the researchers present to guide the experimental session. The experiment was created using PsychoPy v.3.1, an open-source application (Peirce & MacAskill, Reference Peirce and MacAskill2018).
All participants completed the experiment in under 1 hour. All participants first signed a consent form. They then completed an online background questionnaire (Appendix B) asking about their personal information, linguistic background, and language learning experiences (5 minutes). Next, the participants completed the SPL-PV task (96 items preceded by 7 training items; 25 minutes), with time pressure operationalized as the instruction to proceed as quickly as possible. During and immediately after the training session, the participants were allowed to ask any questions they might have. After each block of 32 items of the experimental session, the participants were offered the choice to take a break. After the SPL-PV task, the participants immediately completed a quick pen-and-paper vocabulary-check task (2 minutes; Appendix C) to ensure that vocabulary knowledge did not affect task performance, and that, therefore, variations in RTs at the critical region could be assumed to be due to the processing of the target vowels. In this task, the participants were given a complete list of the vocabulary they had encountered in the SPL-PV task, and asked to circle any word of which they were unsure of the meaning. None of the participants expressed uncertainty about the meaning of any word.
DATA ANALYSIS
The data consisted of the participants’ accuracy on PV and RTs from the SPL task. PV accuracy was dichotomous (one point for correct; zero for incorrect). The RT (in milliseconds) for each word was measured by subtracting word duration (the audio recording length) from the total duration of the presentation (from the word onset to the next button press). In this way, the study minimized the effect of word length on the RTs. Only the RTs for items on which the participants correctly completed the PV were included in the analysis. There were three regions of interest for which the RTs were compared between match and mismatch items: the critical region where the error occurred in the mismatch items (Region 1, R1) and the two regions immediately following the critical region to capture any spillover effects (R2 and R3). Following Jiang’s (2007) method, the word preceding the critical region (R0) was also used as a baseline to check that the RTs of the word before the R1 did not differ between match and mismatch items (e.g., The / old / lady / is / trying / to [R0] / seat [R1] / on [R2] / the [R3] / chair /). RT outliers (three standard deviations above or below each participant’s mean; Waters & Caplan, Reference Waters and Caplan2005) were identified and were replaced with the highest/lowest cutoff point of the mean per participant (Papadopoulou et al., Reference Papadopoulou, Tsimpli, Amvrazis, Jegerski and VanPatten2013). This procedure replaced 1.83% of the data. The L1 and L2 groups’ PV accuracy and RTs were then compared across the regions to identify their sensitivity to the target vowels.
STATISTICAL PROCEDURES
For the analysis of the binary PV accuracy data (correct = 1; incorrect = 0), the study utilized generalized linear mixed-effects logistic regression models (GLME) using the glmer function from the lme4 package (Bates et al., Reference Bates, Maechler, Bolker and Walker2015) in R (R Core Team, 2016). The lmerTest package (Kuznetsova et al., Reference Kuznetsova, Brockhoff, Christensen and Jensen2019) was additionally used to calculate p values from the output. In this analysis, the L1 and L2 groups’ accuracy data for the critical items (i.e., 0 or 1) were entered as a dependent variable. Three independent variables, Group (L1 and L2), Match (Match and Mismatch), and Vowel Pair Type (Type 1 and Type 2), were specified as fixed factors. Item and Subject were included as random factors. When the analysis observed potentially meaningful main and/or interaction effects in the output, a post-hoc pairwise comparison with the Tukey procedure was run using the lsmeans package (Lenth, Reference Lenth2016). Effect sizes of the full model, as marginal R 2 (an effect size associated with the fixed effects) and conditional R 2 (an effect size associated with the fixed effects plus random effects), were calculated using the MuMIn package (Nakagawa & Schielzeth, Reference Nakagawa and Schielzeth2013).
As for the analysis of the RT data from the SPL (scale data), the study utilized linear mixed-effects regression models (LME) using the lmer function from the lme4 package in R. Because the study’s interest is whether each group of participants exhibited longer RTs at critical regions than noncritical regions, the RT data from the L1 group and the L2 group were analyzed separately; thus, separate LME analyses were run for the two RT data sets (i.e., RTs from the L1 group and RTs from the L2 group). The lmerTest package (Kuznetsova et al., Reference Kuznetsova, Brockhoff, Christensen and Jensen2019), again, was also used to calculate p values from the output. In each analysis, the RT data were entered as a dependent variable. Three independent variables were specified: Region (R1, R2, and R3), Match (Match and Mismatch), and Vowel Pair Type (Type 1 and Type 2). Item and Subject were, again, treated as random factors. Any potentially meaningful main effects and/or interaction effects exhibited in the output were further analyzed in a post-hoc analysis (Tukey method using the lsmeans package), and the effect size of the full model was also computed (using the MuMIn package).
RESULTS
ACCURACY SCORES ON THE PICTURE VERIFICATION
First, participants’ accuracy on the fillers in the PV was analyzed to assess whether the participants maintained a focus on meaning throughout the task (Table 2). The mean accuracy scores of the L1 and L2 groups were 97.78 and 95.92, respectively. One-sample t-tests revealed that these means were significantly above chance with large effect sizes (L1: t(8) = 55.558, p < .001, d = 18.52; L2 = t(56) = 62.692, p < .001, d = 8.30), and an independent samples t-test found no significant difference between the L1 and L2 groups. These results show that the implicitly meaning-focused nature of the task was well maintained in this study.
TABLE 2. Mean accuracy scores (%) on filler items in the PV task

Note: Maximum possible accuracy score is 100%.
Table 3 presents the results of the analysis of the L1 and L2 groups’ accuracy scores on the following critical items: Type 1-Match (12 items); Type 1-Mismatch (12 items); Type 2-Match (12 items); and Type 2-Mismatch (12 items). The L1 group’s mean accuracy on the PV ranged between 88.89% and 92.59%, whereas the L2 group’s ranged between 10.23% and 91.37%.
TABLE 3. L1 and L2 groups’ mean accuracy scores (%) on the critical items (standard deviations in parentheses)
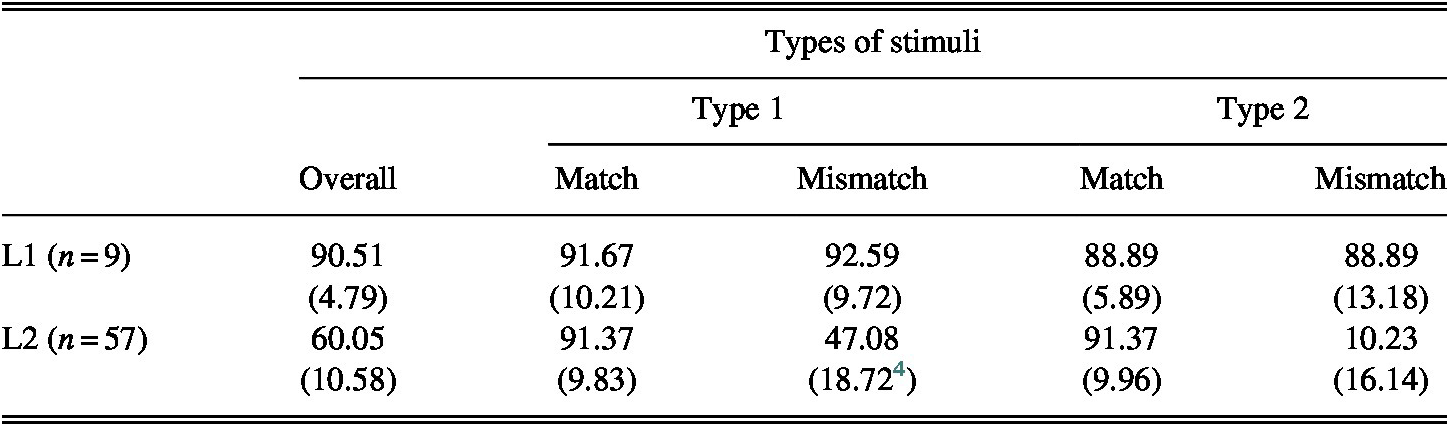
Note: Mean scores on the Type 1 vowel pairs: L1 group: M = 92.14, SD = 6.73; L2 group, M = 69.23, SD = 15.94; mean scores on the Type 2 vowel pairs: L1 group, M = 88.89, SD = 13.94; L2 group, M = 50.83; SD = 9.05. Correlations between the L2 group’s TOEIC scores and PV accuracy were not significant: r(48) = .330, p = .099.
The two groups’ accuracy data on the four types of critical items were analyzed using R to construct a 2 × 2 × 2 GLME model (Table 4). In this model, Group (two levels: L1 and L2), Match (two levels: Match and Mismatch), and Vowel Pair Type (two levels: Type 1 and Type 2), were fixed (independent) factors and accuracy was a dependent variable. To control for any unexpected intervening effects from the test items (e.g., item difficulty, sentence length) and participants’ individual differences (e.g., age, gender), Item and Subject were entered as random factors. Fitting the model using a maximum likelihood technique, the effect size analysis for the full model indicated that 51.8% of the variance can be explained by the fixed factors (marginal R 2 = .518), and 70% of the variance can be explained by the fixed plus random factors (conditional R 2 = .700). The analysis found no significant fixed effect for L2 (vs. L1), Mismatch (vs. Match), or Type 2 (vs. Type 1). However, the analysis found a significant interaction effect for L2 × Mismatch and L2 × Mismatch × Type 2.
TABLE 4. GLME testing PV accuracy across groups, match, and vowel pair types

Note: Group baseline = L2; Match baseline = Match; Vowel Pair Type baseline = Type 1. Model formula: Accuracy Scores ~ Group ∗ Match ∗ Vowel Pair Type + (1 | Item) + (1 | Subject).
* = significant effect
A post-hoc analysis using the Tukey procedure (Table 5) revealed that these significant interactions were caused by the L2 group’s differential performances on the match versus mismatch items; regardless of Vowel Pair Type, the L2 participants were significantly more accurate on the match items than the mismatch items (Match vs. Mismatch; Type 1 × Match vs. Type 1 vs. Mismatch; Type 2 × Match vs. Type 2 vs. Mismatch). Within the mismatch items, the L2 group performed significantly better on Type 1-Mismatch than Type 2-Mismatch items (Mismatch × Type 1 vs. Mismatch × Type 2). In contrast, the L1 group’s scores showed no statistical difference between any of the four types of critical items.
TABLE 5. Post-hoc analysis for PV accuracy
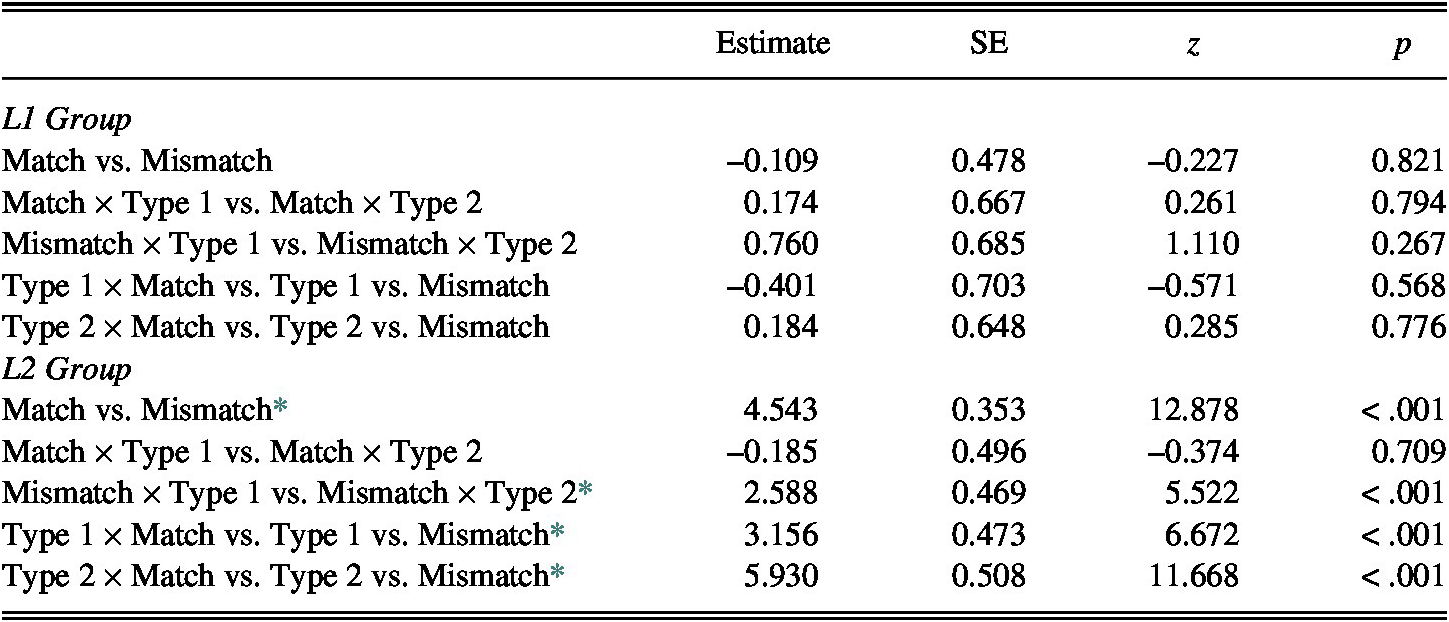
Note: Terms on left side of “vs.” are baselines for each comparison.
* = significant effect
These results suggest that the L2 phonological knowledge of learners, unlike that of native speakers, may be affected by how L2 phones are mapped to L1 categories. That is, the learners’ lower PV accuracy, which reflects learning difficulty, on the Type 2 vowel pairs may be attributed to the mapping of two L2 phones to a single L1 category (two-to-one mapping).
RESPONSE TIMES FROM THE SELF-PACED LISTENING TASK
A Homogeneity Check
Prior to the main RT analysis, the study conducted an RT analysis to identify the homogeneity of the 48 stimuli items. The homogeneity was checked by testing the effects of various item-internal factors on the participants’ RTs at the critical region (i.e., Region 1). Specifically, this analysis looked for any effects on the participants’ RTs at Region 1 from five linguistic characteristics associated with the critical word: (a) lexical dispersion value; (b) syllabic structures (four types: CVC, CCVC, CVCC, and CVC.VC), (c) number of words preceding the critical word within each syntactic phrase (ranging from zero to five) and/or (d) in each sentence (ranging from three to seven), and (e) location of Region 1 in relation to the following regions within/across phrases (three types: [phrase I Region 1] / [phrase II Region 2, Region 3]; [phrase I Region 1, Region 2] / [phrase II Region 3]; and [phrase I Region 1, Region 2, Region 3]).
First, a correlation analysis found no significant correlation between lexical dispersion and RTs for each group: L1 group, r(430) = –0.047, p = 0.804; L2 group, r(2,734) = –0.016, p = 0.576. Second, a one-way analysis of variance (ANOVA) found no significant effect of syllabic structure: L1 group, F(3, 428) = 1.678, p = .171; L2 group, F(3, 2,732) = 2.237, p = .082. Third, a correlation analysis revealed no significant relationship between the number of words preceding the critical word within each syntactic phrase and RTs at Region 1: L1 group, r(430) = –0.048, p = 0.972; L2 group, r(2,734) = –0.018, p = 0.687. Fourth, a correlation analysis revealed no significant relationship between the number of words preceding the critical word in each sentence and RTs at Region 1: L1 group, r(430) = –0.048, p = 0.869; L2 group, r(2,734) = –0.013, p = 0.466. Fifth, as for the locations of Region 1, Region 2, and Region 3, a one-way ANOVA reported no significant effect for the L1 group, F(2, 429) = 1.773, p = 0.171, and a significant effect for the L2 group, F(2, 2,733) = 4.3165, p = 0.013, r 2 = 0.002. A post-hoc analysis by the Tukey procedure showed that the learners’ RTs at Region 1 were significantly faster when Regions 1, 2, and 3 were within the same phrase than in the other cases (ps > .05). There was one such item (i.e., There are four [R1 sealed] [R2 glass] [R3 jars] on the table); due to the identified effect on the RTs at the critical region, this item was removed from the main analysis.
Response Time Analysis
The two groups’ sensitivity to English vowels was examined using the L1 and L2 groups’ mean RTs (in milliseconds) for the four regions of interest: R0, R1, R2, and R3 (L1 group: Table 6 and Figures 5 and 6; L2 group: Table 7 and Figures 7 and 8). An RT increase at a particular region is taken to reflect participants’ processing difficulty due to the violation of their expectation. Therefore, a significant RT increase was expected to occur at the critical region of the mismatch items but not at the critical region of the match items. The L1 and L2 groups’ RTs were analyzed across regions, match/mismatch items, and vowel pair types.
TABLE 6. Descriptive statistics for the L1 group’s (n = 9) mean RTs (in milliseconds) across the four regions (standard deviations in parentheses)


FIGURE 5. Visual representation of L1 group’s (n = 9) mean RTs at four regions: Type 1 only.

FIGURE 6. Visual representation of L1 group’s (n = 9) mean RTs at four regions: Type 2 only.
TABLE 7. Descriptive statistics for the L2 group’s (n = 57) mean RTs (in milliseconds) across the four regions (standard deviations in parentheses)

Note: RTs for correct items only were included. Correlations between the L2 group’s TOEIC scores and RTs at Region 0 (r(48) = –.192, p = .347), TOEIC scores and RTs at Region 1 (r(48) = –.282, p = .164), TOEIC scores and RTs at Region 2 (r(48) = .058, p = .780), and TOEIC scores and RTs at Region 3 (r(48) = –.087, p = .671) were not significant (ps > .05).

FIGURE 7. Visual representation of L2 group’s (n = 57) mean RTs at four regions: Type 1 only.

FIGURE 8. Visual representation of L2 group’s (n = 57) mean RTs at four regions: Type 2 only.
First, the study compared RTs between match and mismatch items at R0 to check whether the RTs were equivalent, as expected, immediately before R1. Mixed-effect model analysis was conducted separately for the L1 group and the L2 group. The model consisted of two fixed factors, Match (Match and Mismatch) and Vowel Pair Type (Type 1 and Type 2), and two random factors, Item and Subject. The results showed no significant difference between the RTs at R0 for Match (Match vs. Mismatch), L1 group: Estimate = –.123, SE = .108, t = –1.148, p = .268; L2 group: Estimate = –.067, SE = .057, t = –.427, p = .675, or Vowel Pair Type (Type 1 vs. Type 2), L1 group: Estimate = –.046, SE = .109, t = –1.148, p = .268; L2 group: Estimate = –.079, SE = .057, t = –1.394, p = .170. Therefore, any increase at R1 can be attributed to the participants’ processing difficulty at the critical region.
Next, the RT data from the L1 group and the L2 group were examined separately. In this observation, a 3 × 2 × 2 LME model analysis was conducted where Region (three levels: Region 1, Region 2, and Region 3), Match (two levels: Match and Mismatch), and Vowel Pair Type (two levels: Type 1 and Type 2) were fixed factors and mean RTs were the dependent variables. Item and Subject were entered as random factors to control for any random effect. Fitting the model using a maximum likelihood technique, the model for the L1 group reported a marginal R 2 of .084, and a conditional R 2 of .551. For the L2 group, the full model indicated a marginal R 2 of .042, and a conditional R 2 of .235.
For the L1 group (Table 8), the analysis revealed a significant RT difference for Region 2 (vs. Region 1), for Region 3 (vs. Region 1), and for Mismatch (vs. Match). The analysis did not, however, reveal a significant RT difference for Type 2 (vs. Type 1). These results indicate that the native participants exhibited significantly longer RTs at R1 than at R2 or R3, and for the mismatch items than match items. As for interaction effects, the analysis found statistical significance for Region 2 × Mismatch and Region 3 × Mismatch.
TABLE 8. LME testing L1 group’s RTs across region, match, and vowel pair type

Note: Region baseline = Region 1; Match baseline = Match; Vowel Pair Type baseline = Type 1. Model formula: RT ~ Region ∗ Match ∗ Vowel Pair Type + (1 | Item) + (1 | Subject).
* = significant effect
The locus of these significant interactions was sought with a post-hoc analysis using the Tukey procedure (Table 9). The analysis found that, regardless of Vowel Pair Type, the L1 group tended to show significantly longer RTs at Region 1 of the mismatch items than at Region 1 of the match items (Region 1 × Match vs. Region 1 × Mismatch). Within the mismatch items, the L1 group exhibited longer RTs at Region 1 than at Region 2 or Region 3 (Mismatch × Region 1 vs. Mismatch × Region 2; Mismatch × Region 1 vs. Mismatch × Region 3). A three-way post-hoc analysis revealed that, within Region 1, the L1 participants’ RTs on mismatch items were significantly longer than on match items regardless of vowel type (Region 1 × Type 1 × Match vs. Region 1 × Type 1 × Mismatch; Region 1 × Type 2 × Match vs. Region 1 × Type 2 × Mismatch). The same effects were not found at Region 2 or Region 3. These results, therefore, show that the interaction effects were caused by the L1 group’s significantly longer Region 1 RTs for the mismatch items than for the match items.
TABLE 9. Post-hoc analysis of the L1 group’s RTs using the Tukey method

Note: Terms on left side of “vs.” are baselines for each comparison.
* = significant effect
For the L2 group (Table 10), the analysis found significant effects for Region 2 (vs. Region 1) and Mismatch (vs. Match), and a marginally significant effect for Region 3 (vs. Region 1). The fixed effect for Type 2 (vs. Type 1), however, did not show statistical significance. These results show that the L2 group tended to exhibit longer RTs at Region 1 than at Region 2 or Region 3, and for the mismatch items than for the match items. As for interaction effects, the analysis found statistical significance for Region 3 × Mismatch and Mismatch × Type 2.
TABLE 10. LME testing L2 group’s RTs across region, match, and vowel pair type

Note: Region baseline = Region 1; Match baseline = Match; Vowel Pair Type baseline = Type 1. Model formula: RT ~ Region ∗ Match ∗ Vowel Pair Type + (1 | Item) + (1 | Subject).
* = significant effect; + = marginally significant effect
A post-hoc analysis with the Tukey procedure (Table 11) was carried out to identify the locus of these interaction effects. The analysis found that the interaction effects were due to the L2 group’s longer RTs at Region 1 of the mismatch items than at Region 1 of the match items. This significant RT difference of the match versus mismatch items was maintained until Region 2, in a spillover effect, but disappeared at Region 3. The post-hoc analysis further indicated that, within the mismatch items, the L2 group showed significantly longer RTs at Region 1 than at Region 2 or Region 3 (Mismatch × Region 1 vs. Mismatch × Region 2; Mismatch × Region 1 vs. Mismatch × Region 3) while the RT differences at Region 2 and Region 3 of the mismatch items were not statistically significant (Mismatch × Region 2 vs. Mismatch × Region 3). Furthermore, the RTs for the match versus mismatch items were compared across Vowel Pair Types (Type 1 × Match vs. Type 1 × Mismatch). For the Type 1 pairs, the learners showed significantly longer RTs for mismatch items than for match items. For the Type 2 pairs, the difference in the learners’ RTs for the match and mismatch items was not statistically significant (Type 2 × Match vs. Type 2 × Mismatch). A three-way post-hoc analysis revealed that, within Region 1, the L2 participants’ RTs on mismatch items were significantly longer than their RTs on match items for the Type 1 pairs (Region 1 × Type 1 × Match vs. Region 1 × Type 1 × Mismatch), and this significant difference was maintained, in a spillover effect, until Region 2 (Region 2 × Type 1 × Match vs. Region 2 × Type 1 × Mismatch). No significant difference was found for Type 2 items at Region 1 (Region 1 × Type 2 × Match vs. Region 1 × Type 2 × Mismatch) or Region 2 (Region 2 × Type 2 × Match vs. Region 2 × Type 2 × Mismatch). At Region 3, no significant difference was identified for any vowel type or between match/mismatch items.
TABLE 11. Post-hoc analysis for the L2 group’s RTs using the Tukey method
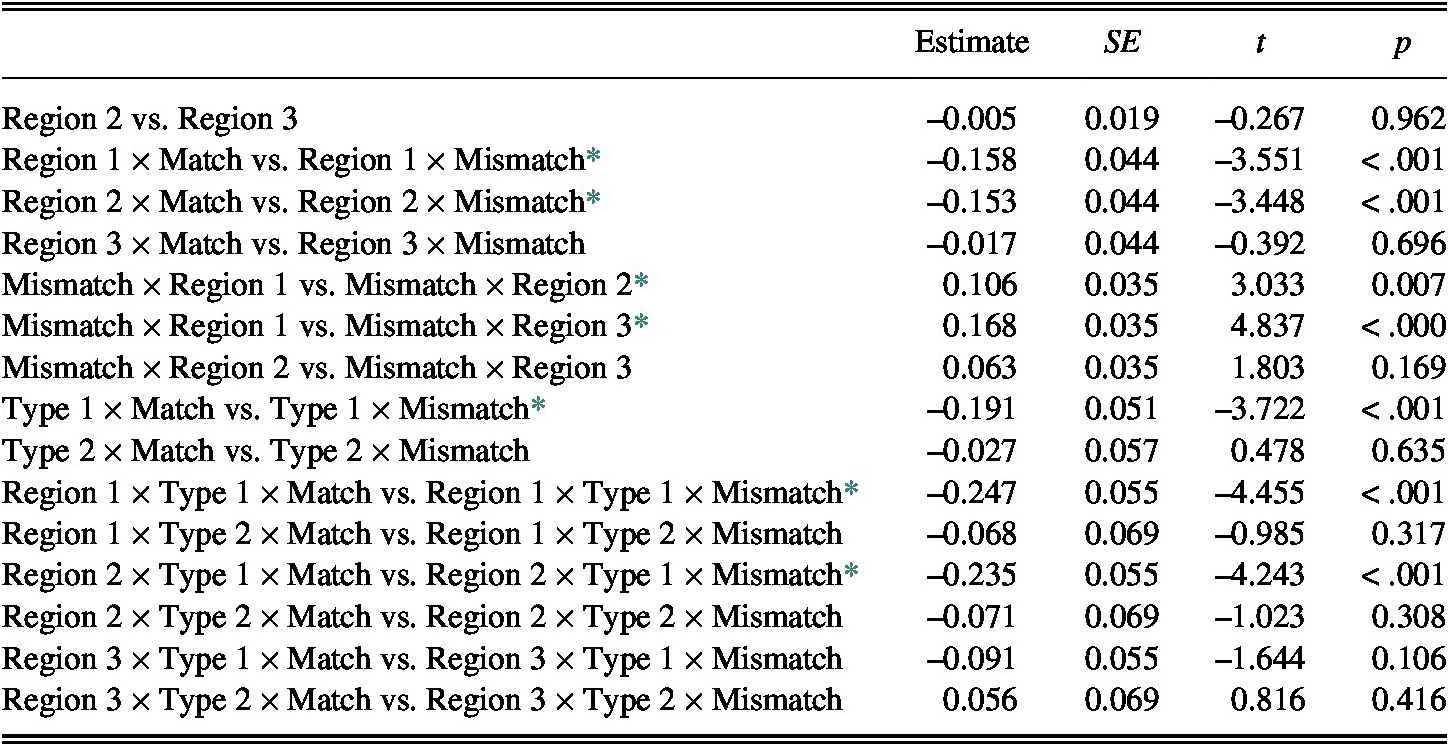
Note: Terms on left side of “vs.” are baselines for each comparison.
* = significant effect
In sum, the L1 group showed longer RTs at R1 in both types of mismatch items, which indicates their perceptual sensitivity to the English target vowels. Unlike the L1 group, the L2 group showed longer RTs at R1 in mismatch items for Type 1 vowel pairs but not for Type 2 vowel pairs. These results suggest that L2 learners’ sensitivity to the target vowels may be affected by how L1 and L2 phones are mapped to each other, as the learners showed more sensitivity to L2 target phones with one-to-one mapping to L1 counterparts than to L2 phones with two-to-one mapping.
DISCUSSION
THE EFFECTS OF L1–L2 MAPPINGS ON THE PROCESSING OF L2 PHONOLOGICAL KNOWLEDGE
This study investigates whether L2 phonological knowledge is affected by the mappings of L2 phones to L1 phones: one-to-one mapping (e.g., English /i/ and /ɛ/ to Korean /i/ and /ɛ/, respectively) versus two-to-one mapping (e.g., English /i/ and /ɪ/ to Korean /i/). The participants’ phonological sensitivity to the target phones was assessed using the SPL paradigm as an online measure for L2 phonological processing. In the SPL paradigm, L2 phonological sensitivity is exhibited by longer RTs caused by slower processing at problematic points.
The RT data indicated that the L1 speakers slowed down to process the critical region (Region 1) containing Type 1 and Type 2 phonological errors (e.g., a switch between /i/ and /ɛ/; and a switch between /i/ and /ɪ/). The L2 group, however, slowed down at the critical region (Region 1) only when processing the Type 1 errors (e.g., a switch between /i/ and /ɛ/), and not the Type 2 errors (e.g., a switch between /i/ and /ɪ/). The L2 learners also showed a spillover effect at Region 2, the region following the critical region, for Type 1 errors, indicating that the processing difficulty caused at the critical region had spilled over to hinder the processing of the following word. No such spillover effect was found for the Type 2 errors. The learners’ different processing speeds for Type 1 and Type 2 vowel pairs, therefore, illustrate different patterns in L2 phonological processing: they show higher perceptual sensitivity to vowel errors caused by a switch in one-to-one mappings, and lower perceptual sensitivity to vowel errors caused by a switch in two-to-one mappings.
Previous research had reported such asymmetries in L2 phonological knowledge (Bohn & Flege, Reference Bohn and Flege1990, Reference Bohn and Flege1992; Flege, Reference Flege1987; Flege et al., Reference Flege, Bohn and Jang1997; Flege & Hillenbrand, Reference Flege and Hillenbrand1984; Fowler et al., Reference Fowler, Sramko, Ostry, Rowland and Hallé2008). The present study adds to this research by showing that such asymmetries may affect L2 processing in real-time acts of language comprehension. The previous studies have suggested that L2 learners map a target L2 phone to an existing L1 category when the L2 target is perceptually similar to an L1 category; when the target does not have a perceptually similar L1 counterpart, the learners form a new category. More specifically, in the case of this study, because the English vowels /i/ and /ɪ/ are perceptually similar to the Korean vowel /i/, and the English vowels /ɛ/ and /æ/ are perceptually similar to the Korean vowel /ɛ/, L1-Korean learners of L2-English are more likely to reuse these two existing Korean phonetic categories for the four English vowels, instead of developing four separate phonetic categories. Hence, Korean speakers are less likely to perceptually distinguish minimal pairs that differ by /i/-/ɪ/ or /ɛ/-/æ/ than minimal pairs that differ by /i/-/ɛ/ and /ɪ/-/æ/ because the learners have separate, though not newly developed, phonetic categories for the L2 targets in each of the latter pairs.
The accuracy rates on the PV task point to a consequence of unsuccessful L2 phonological processing: inaccurate sentence comprehension. The post-hoc analysis found that the learners performed significantly better on the mismatches caused by Type 1 vowel pairs (e.g., beast versus best) than on those caused by Type 2 vowel pairs (e.g., scene versus sin). The native group, however, performed equally well on mismatches caused by either vowel pair type. The learners’ poor PV performance with sentences containing the vowels toward which they showed the least sensitivity illustrates how inaccurate L2 phonological processing may lead to incorrect L2 comprehension.
SELF-PACED LISTENING AS A WINDOW ON IMPLICIT L2 PHONOLOGICAL PROCESSING
The L2 learners also showed relatively low PV accuracy on the Type 1-Mismatch items (M = 47.08, SD = 18.72), which has another interesting implication. If the learners used two separate phonetic categories for perceptually dissimilar pairs (Type 1 pairs, in this study), one might expect them to show fairly good PV performance on the Type 1-Mismatch items. However, the learners’ mean score on these items was not distinguishable from the chance level (t(57) = −.769, p = .445). In the check of their explicit vocabulary knowledge that was conducted after the SPL task, no learner reported not knowing any of the words that appeared in the SPL task, indicating that their chance-level performance was not related to their L2 vocabulary knowledge. In addition, the simple, unvaried syntactic structures used for the stimuli make it unlikely that lower scores in one condition were caused by problems of syntactic comprehension. Given that the native participants showed high PV accuracy on the Type 1-Mismatch items (M = 92.59, SD = 9.72), the learners’ fairly poor performance on these items suggests that successfully rejecting phonologically mismatching sentences may be quite challenging for nonnative speakers.
One possible explanation for this could be related to characteristics of the SPL task that are in line with the characteristics of other implicit measures of L2 knowledge. Ellis (Reference Ellis2005) identified a range of constructs for implicit knowledge tests: (a) responses by feel; (b) time pressure; (c) primary focus on meaning, not form; and (d) no use of metalinguistic knowledge. In the SPL-PV task, the learners were asked to listen to each segment as quickly as possible (time pressure), with the intention of inhibiting their use of explicit phonological knowledge (metalinguistic knowledge) and forcing them to rely on their implicit knowledge, if any. In addition, by using a PV task along with an SPL task, the experiment was designed to lead the participants to attend primarily to meaning rather than to the L2 sounds (form). The association of these constructs with implicit knowledge has been confirmed by a range of validation research (e.g., Bowles, Reference Bowles2011; Kim & Nam, Reference Kim and Nam2017; Spada et al., Reference Spada, Shiu and Tomita2015; Zhang, Reference Zhang2014). These studies have commonly found that L2 learners gain relatively lower scores on implicit measures than on explicit measures, which is attributed to the learners’ limited implicit knowledge.
Similar claims have been made in research that employs self-paced reading as a measure for implicit knowledge/processing (Bultena et al., Reference Bultena, Dijkstra and van Hell2014; Jiang, Reference Jiang2004; Vafaee et al., Reference Vafaee, Suzuki and Kachisnke2017; VanPatten et al., Reference VanPatten, Keating and Leeser2012). That is, they suggest that the concurrent nature of self-paced reading allows it to tap into implicit knowledge, drawing on the participants’ automatic competence. Moreover, some studies have reported that learners score lower on ungrammatical stimuli than on grammatical stimuli (Ellis, Reference Ellis2005; Spada et al., Reference Spada, Shiu and Tomita2015; Zhang, Reference Zhang2014), as well as lower on aural than on visual stimuli (Kim & Nam, Reference Kim and Nam2017; Spada et al., Reference Spada, Shiu and Tomita2015), which suggests that ungrammatical items and auditory input may tap into implicit knowledge more easily than grammatical and visual items do. The SPL-PV task used in this research thus has several built-in features that make it a reasonable measure of implicit knowledge. The L2 learners’ poor performance on the Type 1/Type 2-Mismatch (rather than on the Type 1/Type 2-Match) items may, therefore, be attributable to limits to the learners’ capacity for implicit or automatic processing of L2 phones.
The learners’ low scores on the SPL-PV task indicate that developing L2 implicit phonological knowledge is not an easy or simple task. Recall that the learners’ English proficiency measured by TOEIC and self-rating was between high-intermediate and advanced, and they self-reported having studied English for, on average, nearly 15 years, while their mean age was 23. Because implicit phonological knowledge is mediated by L2 aural input, use of and access to such knowledge is likely to be challenging and effortful for L2 learners (Kim & Nam, Reference Kim and Nam2017; Spada et al., Reference Spada, Shiu and Tomita2015). The spillover effect on RTs shown by the L2 group also seems to provide additional evidence that developing implicit L2 phonological knowledge is effortful. According to previous studies (e.g., Declerck & Kormos, Reference Declerck and Kormos2012; Oomen & Postma, Reference Oomen and Postma2002), learners’ L2 speech-encoding processes and self-monitoring efficiency can be affected by the amount of attentional resources available during a task; a learner’s language processing may be less efficient when task demand is higher and thus draws more heavily on their attentional resources. This study’s SPL-PV task entailed time-pressure and required learners to accomplish more than one task, including listening to the sentence carefully, comparing the sentence to a picture, and indicating the match or mismatch. In this attention-demanding context, the learners’ processing mechanism and monitoring efficiency for L2 phonology might have been impacted. That is, the spillover effect shown by the L2 learners’ data could be indicative of an inefficient monitoring process for L2 phonology.
CONCLUSIONS
This study explored the issue of whether one-to-one (e.g., English /i/ and /ɛ/ to Korean /i/ and /ɛ/, respectively) versus two-to-one (e.g., English /i/ and /ɪ/ to Korean /i/) mappings between L2 targets and their L1 counterparts result in different degrees of sensitivity in real-time phonological processing. Perceptual sensitivity was gauged by RTs in a word-by-word SPL task. Each SPL item was also paired with a PV task to draw the learners’ primary attention to the meaning of each stimulus sentence, and also to assess the connection between successful L2 sentence comprehension and correct L2 phonological processing. The study’s findings suggest that learners tend to be perceptually less sensitive in distinguishing two phones that map onto a single L1 category, and that this resulted in significant processing problems in a real-time sentence comprehension activity. The processing difficulty and comprehension errors were evidenced by insignificant changes in their RTs at critical regions in the SPL task and lower accuracy rates on the PV task. In the case of two L2 phones mapping onto two separate L1 categories, the learners showed fair perceptual sensitivity and less negative effect on their L2 processing.
This research provides evidence that the asymmetrical acquisition of L2 phonology may result in processing problems, which might not be successfully resolved during real-time acts of L2 comprehension. Although the participants were limited to L1-Korean speakers learning English as an L2, the results imply that a similar processing difficulty may exist for any L2 learners who already have established L1 phonetic categories that are similar to, and thus can be reused for, two or more L2 phones. The empirical evidence, therefore, supports the necessity and importance of special pronunciation instruction customized on the basis of learners’ different L1 phonological mappings.
In addition, the study demonstrated that the SPL-PV task can be an effective measure to assess learners’ real-time L2 phonological processing and implicit phonological L2 knowledge; thus, the study makes a potentially valuable contribution by suggesting a useful measure of L2 phonological processing. There are, indeed, a range of assessment tasks developed to separately measure implicit and explicit knowledge of L2 morphosyntax (Ellis, Reference Ellis2005), and their validity and reliability have been tested and ascertained by other studies (e.g., Bowles, Reference Bowles2011; Erlam, Reference Erlam2006; Gutiérrez, Reference Gutiérrez2013; Kim & Nam, Reference Kim and Nam2017; Spada et al., Reference Spada, Shiu and Tomita2015; Zhang, Reference Zhang2014). However, very limited psychometric research has been conducted on the aspect of L2 phonological knowledge. Some research has claimed that a self-paced reading task, the visual counterpart of the aural SPL-PV, is an acceptable psycholinguistic tool to observe learners’ implicit processing of the L2 as well as to tap into their automatic, implicit (or not explicit) knowledge (Coughlin & Tremblay, Reference Coughlin and Tremblay2013; Jiang, Reference Jiang2004; Macizo & Bajo, Reference Macizo and Bajo2006; Papadopoulou & Clahsen, Reference Papadopoulou and Clahsen2003; Vafaee et al., Reference Vafaee, Suzuki and Kachisnke2017). As a goal for future research, it would be particularly interesting to know how valid and reliable SPL-PV tasks might be as a measure of implicit knowledge of L2 phonology.
APPENDIX
Appendix A Stimuli Materials for the Self-Paced Listening Task with Picture Verification
( ? = mismatches caused by semantic error; * = mismatches caused by pronunciation error)

Appendix B Online Background Questionnaire (Presented to Participants in Both English and Korean)
-
1. What is your age and major?
-
2. Are you a male or a female?
-
3. What is your nationality?
-
4. What city/state were you born in?
-
5. What city/state have you lived in most of your life (in your home country) and how long?
-
6. What is your native language (can be more than one)?
-
7. Do you speak any second/foreign languages (can be more than one)? (All Korean and American participants identified English and Korean as their second/foreign language, respectively.)
-
8. What age did you start to learn the second/foreign languages?
-
9. How long have you been studying the second/foreign languages?
-
10. When (age) and what foreign countries have you lived in?
-
11. How long have you lived in the foreign countries and what was the purpose of the stay?
-
12. Please self-evaluate your second/foreign language proficiency in terms of reading, writing, listening, and speaking.
-
13. Have you taken any standardized language proficiency test (e.g., TOEIC, TOEFL)? If so, what score did you gain on the test?
Appendix C Vocabulary Check (Instructions Given in Both English and Korean)
A vocabulary check test
Instructions: Do you know all of these words? The following words appeared in the task. Please circle any word you don’t know the meaning of.


