


Introduction
Effective strategies for preventing depression and reducing disease burden are hindered by lack of evidence about whether the risk for major depression can be quantified in the same way as other clinical disorders, such as cardiovascular disease (Conroy et al. Reference Conroy, Pyorala, Fitzgerald, Sans, Menotti, De Backer, De Bacquer, Ducimetière, Jousilahti, Keil, Njølstad, Oganov, Thomsen, Tunstall-Pedoe, Tverdal, Wedel, Whincup, Wilhelmsen and Graham2003). The predictD study is a pioneering international study whose main objective was to develop a risk index for the onset of major depression in general practice attendees (King et al. Reference King, Weich, Torres, Svab, Maaroos, Neeleman, Xavier, Morris, Walker, Bellon, Moreno, Rotar, Rifel, Aluoja, Kalda, Geerlings, Carraca, Caldas de Almeida, Vicente, Saldivia, Rioseco and Nazareth2006). From 39 potential risk factors for depression, a risk index of 10 risk factors was drawn up for Europe; it has excellent predictive power and good external validity (King et al. Reference King, Walker, Levy, Bottomley, Royston, Weich, Bellon-Saameno, Moreno, Svab, Rotar, Rifel, Maaroos, Aluoja, Kalda, Neeleman, Geerlings, Xavier, Carraca, Goncalves-Pereira, Vicente, Saldivia, Melipillan, Torres-Gonzalez and Nazareth2008b). However, risk models do not always apply well across countries. For example, the incidence of myocardial infarction is relatively low in Spain and other southern European countries and individual cardiovascular risk estimates based on the classic Framingham model have been shown to overestimate the actual individual risk in Spanish persons (Conroy et al. Reference Conroy, Pyorala, Fitzgerald, Sans, Menotti, De Backer, De Bacquer, Ducimetière, Jousilahti, Keil, Njølstad, Oganov, Thomsen, Tunstall-Pedoe, Tverdal, Wedel, Whincup, Wilhelmsen and Graham2003; Marrugat et al. Reference Moons, Royston, Vergouwe, Grobbee and Altman2007). Likewise, evidence exists of different prevalence rates of depression across Europe, even after adjusting for likely confounding factors (King et al. Reference King, Nazareth, Levy, Walker, Morris, Weich, Bellón-Saameño, Moreno, Svab, Rotar, Rifel, Maaroos, Aluoja, Kalda, Neeleman, Geerlings, Xavier, de Almeida, Correa and Torres-Gonzalez2008a). Moreover, important variations are found across European countries concerning the prevalence of factors associated with depression, including co-morbidity of mood and anxiety disorders, living arrangements, unemployment, perception of life events and social support, quality of life, impact of work on mental health, and seeking help from services for mental health problems or misuse of psychotropic drugs (European Commission, 2004; De Girolamo et al. Reference De Girolamo, Alonso and Vilagut2006; König et al. Reference König, Bernert, Angermeyer, Matschinger, Martinez, Vilagut, Haro, de Girolamo, de Graaf, Kovess and Alonso2009). Consequently, rather than simply calibrating existing risk prediction tools, new country-specific prediction risk scores for the onset of depression are required. We aimed to develop and validate a risk algorithm for the onset of major depression in Spanish primary care attendees, and to compare the performance of the European and Spanish risk algorithms in Spanish data.
Method
Design
We undertook a prospective cohort study to develop and validate a risk prediction algorithm for the onset of major depression at 12 months in Spanish primary care attendees. The method has been described in detail elsewhere (King et al. Reference King, Weich, Torres, Svab, Maaroos, Neeleman, Xavier, Morris, Walker, Bellon, Moreno, Rotar, Rifel, Aluoja, Kalda, Geerlings, Carraca, Caldas de Almeida, Vicente, Saldivia, Rioseco and Nazareth2006, Reference King, Walker, Levy, Bottomley, Royston, Weich, Bellon-Saameno, Moreno, Svab, Rotar, Rifel, Maaroos, Aluoja, Kalda, Neeleman, Geerlings, Xavier, Carraca, Goncalves-Pereira, Vicente, Saldivia, Melipillan, Torres-Gonzalez and Nazareth2008b; Bellón et al. Reference Bellón, Moreno, Torres-González, Montón-Franco, GildeGómez-Barragán, Sánchez-Celaya, Díaz-Barreiros, Vicens, de Dios Luna, Cervilla, Gutierrez, Martínez-Cañavate, Oliván-Blázquez, Vázquez-Medrano, Sánchez-Artiaga, March, Motrico, Ruiz-García, Brangier-Wainberg, Del Mar Muñoz-García, Nazareth and King2008). The predictD-Spain study was approved by ethics committees in each Spanish province.
Setting
Seven provinces participated with 41 health centres and 231 physicians distributed throughout Spain: Malaga and Granada in southern Spain; Saragossa and La Rioja in northern Spain; Madrid, capital of Spain, situated in the centre; Las Palmas in the Canary Islands; and Majorca in the Balearic Islands. Each health centre covers a population of 15 000–30 000 inhabitants from a geographically defined area. The physicians in each health centre work as a group, with extensive primary care teams. The Spanish National Health Service provides free medical cover to 100% of the population. The health centres taking part cover urban and rural settings in each province.
The external validation study used data collected in the original predictD-International study in five other European countries: 25 health centres in the Medical Research Council General Practice Research Framework in the UK; 74 health centres nationwide in Slovenia; 23 health centres nationwide in Estonia; seven large health centres near Utrecht, The Netherlands; two large health centres in Portugal, one in Lisbon and the other in Alentejo; and 78 health centres in Concepción and Talcahuano in the Eighth Region of Chile.
Participants
In the six Spanish provinces, systematic random samples from physician appointment lists were taken at regular intervals of between four and six attendees with random starting points for each day. The study population, aged 18 to 75 years, was recruited between October 2005 and February 2006. The seventh province, Malaga, recruited between October 2003 and February 2004 as it was already participating in the predictD-International study. The external validation data were collected in consecutive attendees aged 18–75 years who had been recruited in Europe between April 2003 and September 2004 and in Chile between October 2003 and February 2005. Exclusion criteria for all participant countries were an inability to understand one of the main languages involved, psychosis, dementia, and incapacitating physical illness. In the UK and The Netherlands, patients were recruited in health centre waiting rooms whereas in the other countries recruitment was conducted in discussion with the family physician. In Chile, attendees were randomly selected stratified by age and sex in each centre. Participants who gave informed consent undertook a research interview within 2 weeks.
Variables
A DSM-IV diagnosis of major depression in the preceding 6 months was made using the depression section of the Composite International Diagnostic Interview (CIDI) at baseline, 6 and 12 months (Robins et al. Reference Royston1988; Rubio-Stipec et al. Reference Schafer1991; WHO, 1997). The risk factors selected cover all important areas identified in a systematic review of the literature. For the test–retest analysis, we selected in Spain a random sample of 401 patients stratified by province; 251 completed researcher-administered questionnaires and 150 self-administered questionnaires before the main study began (Bellón et al. Reference Bellón, Moreno, Torres-González, Montón-Franco, GildeGómez-Barragán, Sánchez-Celaya, Díaz-Barreiros, Vicens, de Dios Luna, Cervilla, Gutierrez, Martínez-Cañavate, Oliván-Blázquez, Vázquez-Medrano, Sánchez-Artiaga, March, Motrico, Ruiz-García, Brangier-Wainberg, Del Mar Muñoz-García, Nazareth and King2008). Test–retest reliability of questions used in the predictD-International study has been reported previously (King et al. Reference King, Weich, Torres, Svab, Maaroos, Neeleman, Xavier, Morris, Walker, Bellon, Moreno, Rotar, Rifel, Aluoja, Kalda, Geerlings, Carraca, Caldas de Almeida, Vicente, Saldivia, Rioseco and Nazareth2006). All potential risk factors for depression were measured at baseline:
• Sociodemographic factors: age, sex, marital status, occupation, employment status, ethnicity, nationality, country of birth, educational level, income, owner-occupier of an accommodation, living alone or with others.
• Controls, demands and rewards for unpaid and paid work, using an adapted version of the job content instrument (Karasek & Theorell, Reference Karasek and Theorell1990).
• Debt and financial strain (Weich & Lewis, Reference Weich and Lewis1998).
• Physical and mental well-being, assessed by the 12-item Short Form (SF-12; Jenkinson et al. Reference Jenkinson, Layte, Jenkinson, Lawrence, Petersen, Paice and Stradling1997; Gandek et al. Reference Gandek, Ware, Aaronson, Apolone, Bjorner, Brazier, Bullinger, Kaasa, Leplege, Prieto and Sullivan1998) and a question on the presence of long-standing illness, disability or infirmity.
• Alcohol misuse, assessed by the Alcohol Use Disorders Identification Test (AUDIT; Barbor et al. Reference Barbor, de la Fuente, Saunders and Grant1989; Rubio Valladolid et al. Reference Rubio Valladolid, Bermejo Vicedo, Caballero Sánchez-Serrano and Santo-Domingo Carrasco1998; Pérula-de Torres et al. Reference Pérula-de Torres, Fernández-García, Arias-Vega, Muriel-Palomino, Marquez-Rebollo and Ruiz-Moral2005).
• A lifetime screen for depression based on the first two questions of the CIDI (Arroll et al. Reference Arroll, Khin and Kerse2003).
• Lifetime use of recreational drugs (WHO, 1997).
• Brief questions on the quality of sexual and emotional relationships with a partner, adapted from a standardized questionnaire (Reynolds et al. Reference Reynolds, Frank, Thase, Houck, Jennings, Howell, Lilienfeld and Kupfer1988).
• Anxiety symptoms using the anxiety section of the Primary Care Evaluation of Mental Disorders (PRIME-MD; Baca et al. Reference Baca, Saiz, Agüera, Caballero, Fernández-Liria, Ramos, Gil, Madrigal and Porras1999; Spitzer et al. Reference Spitzer, Kroenke and Williams1999).
• Childhood experiences of physical, emotional or sexual abuse (Fink et al. Reference Fink, Bernstein, Handelsman, Foote and Lovejoy1995).
• Nature and strength of spiritual beliefs (King et al. Reference King, Speck and Thomas1995).
• Presence of serious physical, psychological or substance misuse problems, or any serious disability, in persons who were close friends or relations of participants; and difficulty getting on with people and maintaining close relationships, assessed using questions from a social functioning scale (Tyrer, Reference Tyrer, Peck and Shapiro1990).
• Family psychiatric history in first-degree family members, and suicide in first-degree relatives (Qureshi et al. Reference Rabe-Hesketh and Skrondal2005).
• The living environment, including satisfaction with neighbourhood and perception of safety inside and outside the home using questions from the Health Surveys for England (Sproston & Primatesta, Reference Sproston and Primatesta2003).
• Recent life-threatening events, using a brief validated checklist (Brugha et al. Reference Brugha, Bebbington, Tennant and Hurry1985).
• Experiences of discrimination on the grounds of sex, age, ethnicity, appearance, disability or sexual orientation using questions from a European study (Janssen et al. Reference Janssen, Hanssen, Bak, Bijl, de Graaf, Vollebergh, McKenzie and van Os2003).
• Adequacy, availability and sources of social support from family and friends (Blaxter, Reference Blaxter1990).
Statistical analyses
To develop the predictD-Spain risk algorithm (PSRA), we included only patients without major depression at baseline. Participants with missing depression diagnoses at both follow-up points (at 6 and 12 months) were excluded. We also excluded those with missing CIDI data at one follow-up who were not depressed at the other, as we could not conclude whether or not major depression had occurred over the follow-up period. However, we could include patients who were depressed at one follow-up point and missing at the other (at 6 or 12 months), as they met the outcome criterion of depression at some point over the 12 months. We conducted all analyses using Stata, release 10 (StataCorp, 2007).
Data imputation
Missing data in candidate risk factors were imputed using the method of chained equations, implemented in the Stata ice program (Royston, Reference Royston2005). We imputed 10 datasets (Schafer, Reference Sebre, Sprugevica, Novotni, Bonevski, Pakalniskiene, Popescu, Turchina, Friedrich and Lewis1999) and obtained combined estimates (Little & Rubin, Reference Little and Rubin2002).
Model building
We performed multi-level logistic regressions to test the hierarchical data structure with the cumulative incidence of depression at 12 months as the dependent variable. The likelihood-ratio test of the null model with health centre as a random factor versus usual logistic regression was significant (χ2=15.20, p<0.001). Nevertheless, the likelihood-ratio test of the null model with health centre and doctor as a random factor versus the null model with only health centre was not significant (χ2=1.48, p=0.11). The intraclass correlation coefficients for incidence of depression at 12 months were 0.07 and 0.03 for health centre and doctor respectively. Hence, we used multi-level logistic regression with two levels, patients and health centre. We built the risk model at 12 months using all the risk factors described earlier and the province of each participant. We developed these models in the imputed data using a threshold for inclusion of p⩽0.20 to ensure that information lost as a result of exclusion of a variable from the equation was minimal (Greenland, Reference Greenland1989). We retained age and sex in all regression models because of their well-known associations with the onset of depression (Piccinelli & Wilkinson, Reference Piccinelli and Wilkinson2000). We also retained province because of an a priori assumption of clustering within province, although it had few categories (n=7) that could be considered as random factors (Snijders & Bosker, Reference Snijders and Bosker1999). The usefulness of including first-degree interactions was considered. We considered especially the age×sex interaction because it has been found previously (Bebbington et al. Reference Bebbington, Dunn, Jenkins, Lewis, Brugha, Farrell and Meltzer2003). Multi-variable fractional polynomial analysis was used to assess possible nonlinear effects of continuous predictors. From the model thus obtained, those variables with p⩾0.05 were extracted step by step to obtain a more parsimonious model. The variables that modified coefficients by more than 10%, irrespective of the p value, remained in the model. For each patient the probability of remaining in the follow-up at 12 months was obtained (Bellón et al. Reference Bellón, Luna, Moreno, Montón-Franco, Gildegómez-Barragán, Sánchez-Celaya, Díaz-Barreiros, Vicens, Motrico, Martínez-Cañavate, Olivan-Blázquez, Vázquez-Medrano, Sánchez-Artiaga, March, Muñoz-García, Moreno-Peral, Nazareth, King and Torres-González2010) and then inverse probability weighting was applied to the final model to adjust for a possible selection bias due to participants lost during the follow-up (Hernán et al. Reference Hernán, Hernández-Díaz and Robins2004), implemented through the Stata gllamm program (Rabe-Hesketh & Skrondal, Reference Rabe-Hesketh and Skrondal2008). We repeated the analyses in participants with complete data as a sensitivity analysis.
Internal validation
The ability to distinguish those who would develop major depression from those who would not was assessed using the C-index (Harrell, Reference Greenland2001). We used a calculation proposed by Copas (Reference Copas1983) to adjust for overfitting of our prediction models. To deal with the overfitting that arises through variable selection, we computed the shrinkage factor based on the initial model including all variables. We calculated effect sizes using Hedges' g (Cooper & Hedges, Reference Cooper and Hedges1994) for the difference in log odds of predicted probability between patients who were later found to be depressed and those who were not. To obtain more information on the level of overoptimism of the Spanish C-index and Hedges' g, we recalculated them deriving the PSRA from a random sample of 75% of the Spanish data and testing it on the remaining 25%. We assessed the goodness of fit of the final risk model by grouping individuals into deciles of risk and comparing the observed probability of major depression within these groups with the average risk (calibration plots).
External validation
We used the C-index, Hedges' g and calibration plots to evaluate the performance of the PSRA (without province) in data from Chile and the other European countries. When the PSRA was tested in data from all of the European countries, we excluded Spanish patients from the European sample. We estimated the same parameters applying the predictD-Europe risk algorithm (PERA; King et al. Reference King, Walker, Levy, Bottomley, Royston, Weich, Bellon-Saameno, Moreno, Svab, Rotar, Rifel, Maaroos, Aluoja, Kalda, Neeleman, Geerlings, Xavier, Carraca, Goncalves-Pereira, Vicente, Saldivia, Melipillan, Torres-Gonzalez and Nazareth2008b) in Spanish data to compare both models, the European and the Spanish. In this comparison the sample from Malaga was excluded because it was used to develop the PERA. A test for the difference between two correlated C-index (PSRA and PERA), estimating standard error (s.e.) by bootstrap, was used (Pepe, Reference Pepe2003). Furthermore, we calculated the Integrated Discrimination Improvement (IDI) and the asymptotic test for the null hypothesis of IDI=0 (Pencina et al. Reference Pencina, D'Agostino, D'Agostino and Vasan2008). The IDI can be viewed as a difference between improvement in average sensitivity and any potential increase in average ‘1 – specificity’. Because the calculation of the IDI can be affected by the different incidence rates of depression in Europe and Spain, for each individual we multiplied the predicted probabilities by a ‘calibration factor’, defined as the ratio of the observed depression rate to the mean predicted probability (Pencina et al. Reference Pencina, D'Agostino, D'Agostino and Vasan2008).
Results
A total of 6526 people in the seven Spanish provinces were asked to take part in the study. The response to recruitment was 83.4%; 5442 were interviewed and 1084 refused to participate at baseline (Fig. 1). Of those who refused to participate, 780 gave their consent for their age and sex data to be used in our analysis. A higher proportion of the 780 were male [360 (46.1%) versus 1756 of the 5442 (32.3%) patients who provided baseline information, χ2=18.06 and p<0.001] and those who refused had a lower mean age, 46.9 [95% confidence interval (CI) 45.7–48.0] versus 48.5 years (95% CI 48.1–48.9), p=0.018.
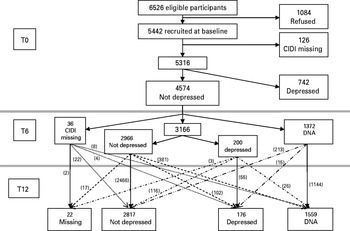
Fig 1. Flow of patients through the predictD-Spain study and numbers becoming depressed. CIDI, Composite International Diagnostic Interview; DNA, did not attend; T0, T6 and T12, baseline, 6 and 12 months interview.
At recruitment, 5360 participants had full CIDI data to allow a depression diagnosis; of these, 4574 were not depressed. The response to follow-up was 70% at 6 months and 66% at 12 months. The analysis of variables associated with non-response has been described elsewhere (Bellón et al. Reference Bellón, Luna, Moreno, Montón-Franco, Gildegómez-Barragán, Sánchez-Celaya, Díaz-Barreiros, Vicens, Motrico, Martínez-Cañavate, Olivan-Blázquez, Vázquez-Medrano, Sánchez-Artiaga, March, Muñoz-García, Moreno-Peral, Nazareth, King and Torres-González2010). In brief, province and sociodemographic factors were strong predictors of loss to follow-up: those who did not respond were younger, had lower levels of education and income, and were more often male, single, born outside Spain, and less often students than those who responded. Major depression and anxiety had no effect but other psychosocial factors predicted attrition (Bellón et al. Reference Bellón, Luna, Moreno, Montón-Franco, Gildegómez-Barragán, Sánchez-Celaya, Díaz-Barreiros, Vicens, Motrico, Martínez-Cañavate, Olivan-Blázquez, Vázquez-Medrano, Sánchez-Artiaga, March, Muñoz-García, Moreno-Peral, Nazareth, King and Torres-González2010).
In the six countries (apart from Spain) that had participated in predictD, 8567 people took part and their responses to recruitment were, in decreasing order: Chile (97%), Estonia (80%), Slovenia (80%), Portugal (76%), The Netherlands (45%) and the UK (44%). In Chile, 2133 participants who were not depressed started the follow-up and 5184 in the five other European countries; the respective responses to follow-up at 6 and 12 months were 89% and 82%, and 91% and 88% (King et al. Reference King, Weich, Torres, Svab, Maaroos, Neeleman, Xavier, Morris, Walker, Bellon, Moreno, Rotar, Rifel, Aluoja, Kalda, Geerlings, Carraca, Caldas de Almeida, Vicente, Saldivia, Rioseco and Nazareth2006). The sociodemographic differences between Spanish provinces are shown in Table 1; differences between countries have been described elsewhere (King et al. Reference King, Walker, Levy, Bottomley, Royston, Weich, Bellon-Saameno, Moreno, Svab, Rotar, Rifel, Maaroos, Aluoja, Kalda, Neeleman, Geerlings, Xavier, Carraca, Goncalves-Pereira, Vicente, Saldivia, Melipillan, Torres-Gonzalez and Nazareth2008b).
Table 1. Demographic characteristics and response to follow-up of not depressed Spanish participants at baseline
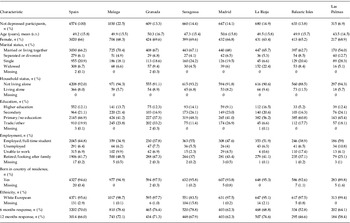
s.d., Standard deviation.
The cumulative 12-months incidence of DSM-IV major depression was 11.5% in Spain, varying between provinces: Las Palmas 17.5%, Malaga 15.2%, Granada 14.9%, Majorca 14%, Saragossa 7.9%, Madrid 7.2% and La Rioja 5.6%. The incidence in the other countries was: the UK 8.8%, Slovenia 4.2%, Portugal 8.5%, The Netherlands 5.4%, Estonia 5.9% and Chile 11.6% (King et al. Reference King, Walker, Levy, Bottomley, Royston, Weich, Bellon-Saameno, Moreno, Svab, Rotar, Rifel, Maaroos, Aluoja, Kalda, Neeleman, Geerlings, Xavier, Carraca, Goncalves-Pereira, Vicente, Saldivia, Melipillan, Torres-Gonzalez and Nazareth2008b).
Missing information in Spanish data was less than 1% for most risk factors; exceptions were ethnicity (2.9%), suicide in brothers or sisters (3.30%), and sexual or emotional relationship with a spouse or partner (18.3%).
The results of reliability analyses have been reported elsewhere (Bellón et al. Reference Bellón, Moreno, Torres-González, Montón-Franco, GildeGómez-Barragán, Sánchez-Celaya, Díaz-Barreiros, Vicens, de Dios Luna, Cervilla, Gutierrez, Martínez-Cañavate, Oliván-Blázquez, Vázquez-Medrano, Sánchez-Artiaga, March, Motrico, Ruiz-García, Brangier-Wainberg, Del Mar Muñoz-García, Nazareth and King2008). They were good or excellent for almost all the questionnaires and items. However, in Spain the questions on the use of any recreational drugs over the previous 6 months were removed due to poor reliability (Bellón et al. Reference Bellón, Moreno, Torres-González, Montón-Franco, GildeGómez-Barragán, Sánchez-Celaya, Díaz-Barreiros, Vicens, de Dios Luna, Cervilla, Gutierrez, Martínez-Cañavate, Oliván-Blázquez, Vázquez-Medrano, Sánchez-Artiaga, March, Motrico, Ruiz-García, Brangier-Wainberg, Del Mar Muñoz-García, Nazareth and King2008).
Development of the Spanish model
Eight variables were retained at p<0.05 (Tables 2 and 3), and one more (physical child abuse) was included at p=0.085 because the coefficients changed by more than 10% when this was removed. The age×sex interaction was also included in the final equation because the likelihood-ratio test was significant (χ2=4.03, 1 df, p=0.0447). Interaction between sex and each of the remaining risk factors in the model was not significant at p⩽0.10. Nor were interactions between age and the other variables in the model significant. Nonlinear transformation of continuous variables did not significantly improve the model fit. Six variables were patient characteristics or past events (sex, age, sex×age interaction, education, physical child abuse and lifetime depression) and six were current status (SF-12 physical health subscale score, SF-12 mental health subscale score, dissatisfaction with unpaid work, number of serious problems in very close persons, dissatisfaction with living together at home, and taking medication for stress, anxiety or depression); and one concerned Spanish province. The random component (health centre) was also significant even after including all variables of the fixed component in the regression models; these coefficients were 0.390 (s.e.=0.085, p<0.0001) and 0.469 (s.e.=0.101, p<0.0001) for the models with and without province respectively.
Table 2. Spanish predictD model with provinceFootnote a for predicting the onset of major depression at 12 months
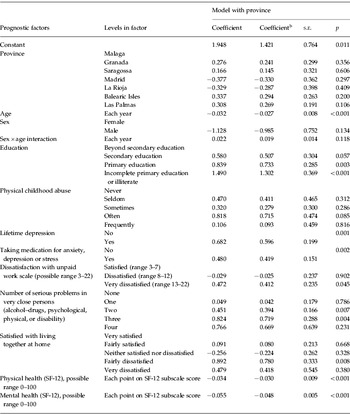
s.e., Standard error; SF-12, 12-item Short Form Health Survey.
a Model derived in the 10 imputed datasets weighting for the inverse probability of remaining in the follow-up to 12 months.
b Coefficient after Copas shrinkage.
Table 3. Spanish predictD model without provinceFootnote a for predicting the onset of major depression at 12 months
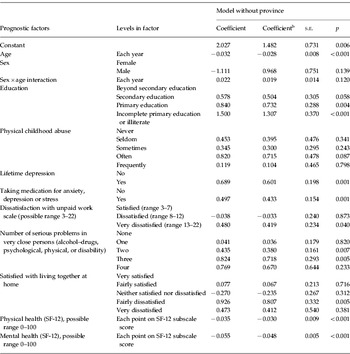
s.e., Standard error; SF-12, 12-item Short Form Health Survey.
a Model derived in the 10 imputed datasets weighting for the inverse probability of remaining in the follow-up to 12 months.
b Coefficient after Copas shrinkage.
The model derived in participants with complete data (n=2544) and the model derived in the 10 imputed datasets (n=2787) were very similar, except for the variables set ‘age, sex, and age×sex interaction’, which was more significant in the model with complete data (see Appendix 1, available online); nevertheless, there were more differences between the model derived in the 10 imputed datasets and the same weighted for the inverse probability of remaining in the follow-up to 12 months (Appendix 1).
Internal validation
The average C-index and the effect size (Hedges' g) in data sets were 0.817 (95% CI 0.790–0.843) and 1.35 (95% CI 1.21–1.48) respectively; and 0.816 (95% CI 0.755–0.878) and 1.34 (95% CI 1.16–1.53) when deriving the PSRA from a random sample of 75% of the Spanish data and testing it on the remaining 25%. The calibration plot of the PSRA in Spain is shown in Fig. 2. The predicted probability of depression at 0.113 was associated with estimates of sensitivity, specificity and likelihood ratio (+) of 72.8%, 72.6% and 2.67 respectively. Examples of the kinds of participants scoring at increasing levels of predicted probability of depression are shown in Table 4. The predicted probability of major depression over 12 months can be calculated through the PSRA at www.rediapp.org/predict.php.
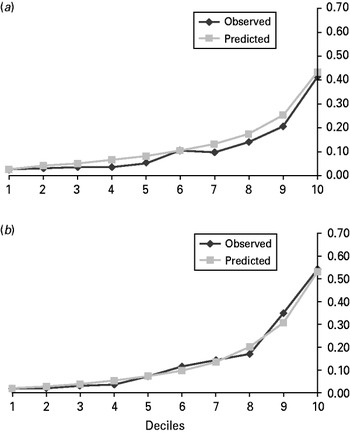
Fig. 2. Calibration plots (mean predicted probability against observed probability of depression within deciles of predicted risk) of the (a) predictD-Europe risk algorithm (PERA) and (b) the predictD-Spain risk algorithm (PSRA) in Spain.
Table 4. Examples of a range of predicted probabilities of depression at baseline

Mean (standard deviation) Short Form 12 (SF-12) mental and physical subscale scores for Spain were 47.1 (12.4) and 43.8 (11.4) respectively. High scores indicate good health/well-being. Scores in parentheses correspond to eliminating dissatisfaction with unpaid work and living together at home, perception of serious problems in close persons and correcting SF-12 physical and mental health scores to the Spanish mean.
a Perception of serious problems in close persons did not change.
b Very dissatisfied with living together at home changed to neither satisfied nor dissatisfied and stopped taking medication for anxiety, depression or stress.
External validation
The Copas shrinkage factor for the Spanish model was 0.873 including the province and 0.872 without the province. The shrunk regression coefficients are shown in Tables 2 and 3. The C-index ranged from 0.70 in Chile to 0.83 in The Netherlands and Hedges' g from 0.77 in Chile to 1.50 in The Netherlands (Table 5). Calibration plots of the PSRA in Chile and the other European countries are shown in Appendix 2 (available online).
Table 5. C-Index statistic and effect sizes computed using Hedges' g

PSRA, PredictD-Spain risk algorithm; PERA, predictD-Europe risk algorithm; CI, confidence interval.
a The risk score was computed using unshrunk estimates in Spain and shrunk estimates in Chile and other European countries.
b The risk score was computed using shrunk estimates in Spain, Chile and other European countries.
c Average C-Index and Hedges' g over 10 imputed data sets.
d The UK+Slovenia+Portugal+The Netherlands+Estonia.
When we applied the PERA to the Spanish data (excluding the sample recruited from Malaga): the C-index was 0.78 (95% CI 0.73–0.83) and Hedges' g was 1.14 (95% CI 0.98–1.31) (Table 5); the test for the C-index difference between the PSRA and PERA was significant (difference=0.0316, 95% CI 0.0121–0.0530, Z exp=3.10, p<0.0022). The IDI was 0.0558 (s.e.=0.0071, Z exp=7.88, p<0.0001) because of the increase in average sensitivity (0.2744 v. 0.2256, Z exp=7.00, p<0.0001) and a small decrease in ‘average 1 – specificity’ (0.0942 v. 0.1012, Z exp=5.55, p<0.0001). Calibration plots showed that the PSRA functioned better in Spain than the PERA (Fig. 2).
Discussion
We have developed and validated a risk score for the development of major depression over 12 months in 2787 general practice attendees in Spain. The PSRA included new variables and afforded an improved performance over the PERA for predicting the onset of major depression in Spain. To our knowledge, Spain is the first country to have developed its own risk score for predicting new episodes of major depression in primary care. However, the PERA is still the best option for predicting the onset of major depression in other European countries.
The PSRA worked better than the PERA in Spain; however, this conclusion cannot be generalized to other countries because it has only been studied in Spain. In general, it is expected that countries with similar incidence rates of depression and a similar distribution of their risk factors can probably share the same risk algorithm.
Studies are needed to provide data about whether the improvement in 5.6 IDI points translates into improvements for the health of patients (depressions avoided) and/or decreased costs, but so far no study has been published about the primary prevention of depression using the PSRA. Meanwhile, we can again use the analogy with cardiovascular disease, where an increase of 1 IDI point or more has been suggested to represent a meaningful improvement (Pencina et al. Reference Pencina, D'Agostino, D'Agostino and Vasan2008). From this viewpoint, the improvement in 5.6 IDI points could lead to substantial clinical differences and important public health implications.
The C-indexes were very similar (differing in one thousandth) when we derived and applied the PSRA on the whole sample or when we derived it from 75% and applied it to the remaining 25%. This supports the hypothesis that the differences between the PSRA and PERA cannot be explained by overoptimism.
We recruited a systematic random sample of primary care attendees and we used a criterion of stratification to include urban and rural health centres in each province and included provinces from different geographical areas in both mainland Spain (north, central and south) and the Spanish islands. Although we did not select health centres randomly and our sample could under-represent patients who attend very infrequently (Lee et al. Reference Lee, Yano, Wang, Simon and Rubenstein2002), the study population is likely to be fairly representative of primary care attendees in Spain. Further studies to develop risk algorithms in other countries will have to consider the external validity of the sample chosen, especially if there are data to suggest that within the same country there are different incidence rates of depression and different risk factors. In the case of Spain, we found that unadjusted incidence rates of depression were very different between provinces; for example, 17.5% in Las Palmas and 5.6% in La Rioja, with an ascending gradient from the north to the south. However, after adjusting for risk factors, these differences were largely dissipated (Table 2), though not so with the PERA, where differences between countries remained (King et al. Reference King, Walker, Levy, Bottomley, Royston, Weich, Bellon-Saameno, Moreno, Svab, Rotar, Rifel, Maaroos, Aluoja, Kalda, Neeleman, Geerlings, Xavier, Carraca, Goncalves-Pereira, Vicente, Saldivia, Melipillan, Torres-Gonzalez and Nazareth2008b). If the PSRA is applied in a different country, or a province other than one of the seven participating provinces, we recommend using the shrunk coefficients of the model without province (Table 3).
We used multi-level regression because of the hierarchical structure of the data. In these cases, this approach improves the accuracy of estimates of coefficients and standard errors (Snijders & Bosker, Reference Spitzer, Kroenke and Williams1999). Our large sample size and the number of events (major depression) per variable included in the model (>29) contributed to reducing the risk of selecting unimportant variables and failing to include important ones (Altman & Royston, Reference Altman and Royston2000). The multiple imputation strategy allowed us to gain statistical power and to avoid potentially biased estimates obtained from a reduced complete-case dataset (Little & Rubin, Reference Little and Rubin2002). We have lack of certainty about the reasons for missing data, but we do know that, at baseline, the outcome variable (depression) was not associated with loss during the follow-up (Bellón et al. Reference Bellón, Luna, Moreno, Montón-Franco, Gildegómez-Barragán, Sánchez-Celaya, Díaz-Barreiros, Vicens, Motrico, Martínez-Cañavate, Olivan-Blázquez, Vázquez-Medrano, Sánchez-Artiaga, March, Muñoz-García, Moreno-Peral, Nazareth, King and Torres-González2010) and no major discrepancy was found between imputed data and complete-case analyses (Appendix 1). From this point of view, we would be more inclined to think they are ‘at random’. There were important differences between the Spanish models with and without inverse probability weighting, indicating that loss to follow-up might lead to selection bias and suggesting that this strategy could provide unbiased estimates of coefficients, even in the presence of selection bias (Hernán et al. Reference Hernán, Hernández-Díaz and Robins2004). We consider that follow-up at 12 months is appropriate for the prediction of the onset of depression in primary care because this is sufficient time to develop major depression (11.5% of incident cases). Furthermore, doctors and patients may be more motivated to undertake interventions and behavioural changes when depression is likely to happen sooner rather than later.
The PERA and PSRA share many risk factors; however, the new risk factors included in the Spanish equation improved its results for prediction in Spain. ‘Dissatisfaction with living together at home’ and ‘number of serious problems in very close persons’ are risk factors consistent with the geography of family systems; the central and northern parts of Europe, together with North American society, have been characterized by relatively weak family links, whereas the Mediterranean region has strong family ties (Reher, Reference Reher1998). Spain belongs to the regions where the family group has traditionally had priority over the individual. Moreover, the association between marital discord, family dysfunction and depression is well known (Whisman & Uebelacker, Reference Whisman and Uebelacker2009). The inclusion of ‘dissatisfaction with unpaid work’ instead of ‘difficulties in paid and unpaid work’ may be due to different ways of measuring these variables. We used two scales in Spain, one for unpaid work and another for paid work, with seven items each that were valid and reliable (Bellón et al. Reference Bellón, Luna, Moreno, Montón-Franco, Gildegómez-Barragán, Sánchez-Celaya, Díaz-Barreiros, Vicens, Motrico, Martínez-Cañavate, Olivan-Blázquez, Vázquez-Medrano, Sánchez-Artiaga, March, Muñoz-García, Moreno-Peral, Nazareth, King and Torres-González2010), whereas in the predictD-Europe study two items were used to summarize both dimensions together. When we included these two items in the predictD-Spain model instead of work scales, it was not significant. However, we cannot rule out the influence of other factors, such as a higher participation of Spanish women in domestic work as compared with other European regions (Drew et al. Reference Drew, Emerek and Mahon1998). Although relationships between ‘physical childhood abuse’ and depression are well documented (Arnow, Reference Arnow2004), they are complex, vary between countries, and have cross-cultural differences (Sebre et al. Reference Sebre, Sprugevica, Novotni, Bonevski, Pakalniskiene, Popescu, Turchina, Friedrich and Lewis2004). Finally, the variable ‘taking medication for anxiety, depression or stress’ might be associated with patients who have suffered previous depressive episodes and were still taking antidepressants. However, the question is phrased in such a way that it might also include those taking anxiolytics, often in an inadequate way, for anxiety, co-morbidity or even just taking medicines (vitamins, placebos, etc.) for other minor emotional problems. A hypothesis might be that these patients share coping styles, such as ‘external health locus’, with a tendency to ask their doctors for more psychotropic drugs for emotional problems encountered in everyday life (Demyttenaere et al. Reference Demyttenaere, Bonnewyn, Bruffaerts, De Girolamo, Gasquet, Kovess, Haro and Alonso2008). Spain is also among those European countries that have a higher use of psychotropic drugs (Alonso et al. Reference Alonso, Angermeyer, Bernert, Bruffaerts, Brugha, Bryson, de Girolamo, Graaf, Demyttenaere, Gasquet, Haro, Katz, Kessler, Kovess, Lépine, Ormel, Polidori, Russo, Vilagut, Almansa, Arbabzadeh-Bouchez, Autonell, Bernal, Buist-Bouwman, Codony, Domingo-Salvany, Ferrer, Joo, Martínez-Alonso, Matschinger, Mazzi, Morgan, Morosini, Palacín, Romera, Taub and Vollebergh2004). We might expect the PSRA to work better than the PERA in Chile or Portugal because the Spanish equation includes specific risk factors that may be shared with Mediterranean or southern Europe countries and Latin America, that is those related to family (‘dissatisfaction with living at home’, ‘serious problems in families and close persons’). However, this was not the case.
Although the PSRA adds two items on top of those already included in the PERA, both algorithms need a computer for risk calculation. Nowadays, it would be easy to incorporate our algorithm into a computerized medical records system. As the questionnaire can be checked online (www.rediapp.org/predict.php), completing it just takes about three minutes. One of the uses of our PSRA could be to select relevant patients for studies of the primary prevention of depression, although the main use of any risk score is to help physicians with complex decisions (Moons et al. Reference Moons, Royston, Vergouwe, Grobbee and Altman2009). Our PSRA could help physicians with decisions by providing more objective estimates of the likelihood of risk of major depression, as a supplement to other relevant clinical information; perhaps in a similar manner to the way cardiovascular risk scores are used to determine the indication for lowering cholesterol. However, trials are needed using our PSRA to test different strategies of primary prevention of major depression. Impact studies are also needed to quantify the effect of using the PSRA on physicians' behaviour, patient outcome or cost-effectiveness of care. When such evidence is available, the PSRA could also be used by any patient for self-assessment using the web-based calculator. Meanwhile, we have taken the first step; we have an accurate, valid and reliable tool that provides an objective and individualized measure of the likelihood of risk of the onset of major depression in primary care.
Note
Supplementary material accompanies this paper on the Journal's website (http://journals.cambridge.org/psm).
Acknowledgements
We thank the Primary Care District of Malaga and, in particular, Dr J.M. Morales and Dr M. Vilaseca for their support. We also thank P. Royston and C. Bottomley (both UK) for their contribution to the analytical strategy in predictD and predictD-Spain, and P. Zuithoff (The Netherlands) for his statistical comments on the article. Finally, we thank all the interviewers, physicians and patients for their participation in the predictD study.
This work was supported in Spain by grants from the Spanish Ministry of Health (grant FIS references: PI041980, PI041771, PI042450 and PI06/1442); the Andalusian Council of Health (grant references: 05/403 and 06/278) and the Spanish Ministry of Education and Science (grant reference SAF 2006/07192); the Spanish Network of Primary Care Research ‘redIAPP’ (RD06/0018), the ‘Aragón group’ (RD06/0018/0020), the ‘Baleares group’ (RD07/0018/0033), and the ‘SAMSERAP group’ (RD06/0018/0039). The Malaga sample, as part of the predictD-International study, was also co-funded by a grant from the European Commission (reference QL4-CT2002-00683). The research in Europe was funded by a grant from the European Commission (reference PREDICT-QL4-CT2002-00683). Funding in Chile was provided by project FONDEF DO2I-1140. Partial support in Europe was from the Estonian Scientific Foundation (grant 5696) and the Slovenian Ministry for Research (grant 4369-1027). The UK National Health Service Research and Development Office provided service support costs in the UK. The funders had no direct role in the design or conduct of the study, interpretation of the data or review of the manuscript.
Declaration of Interest
None.


