


Introduction
Industrialization and urbanization frequently bring about rising incomes, wages and life expectancy, particularly in the long-run (Komlos, Reference Komlos1987; Floud et al., Reference Floud, Wachter and Gregory1990, pp. 272–273). However, in the short-run, economic change also creates social turmoil, such as increasing inequality, crime and a more virulent disease environment, which are associated with deteriorating biological conditions. Hence, the overall effect of industrialization on biological conditions depends on which effect dominates. In the case of the 19th century United States, economic growth was associated with greater factor mobility and income accumulation, which, in the long-run, enhanced biological conditions. However, US economic growth was also related to increasing inequality, industrialization and urbanization, which are negatively associated with biological conditions. Moreover, 19th century US industrialization and urbanization were also related to the physical separation of agricultural production from consumption, which increased the relative price of food. This study, therefore, uses a new data source from a 19th century Philadelphia prison to address black and white BMI variation during the period when the north-east's agriculture transformed from rural to mechanized agriculture in one of North America's most rapidly industrializing regions.
Body mass index (BMI) values (weight(km)/height(m2)) reflect the net current balance between nutrition, work effort and the physical environment (Fogel, Reference Fogel1994, p. 375; Coclanis & Komlos, Reference Coclanis and Komlos1995, p. 102), and BMIs increase when economic conditions improve and decrease when economic conditions deteriorate (Strauss & Thomas, Reference Strauss and Thomas1998, p. 773). By considering average versus individual BMIs, genetic differences are mitigated, leaving only the influence of economic and physical environments. Therefore, BMIs provide considerable insight into understanding historical processes and augment other 19th century black and white welfare measures. The BMIs from a Philadelphia County (Holmesburg) prison are, therefore, used here to assess how black and white current net biological conditions varied throughout industrialization in a Northern industrial state (Easterlin, Reference Easterlin, Fogel and Engerman1971, pp. 40–41; Soltow, Reference Soltow1975, p. 103; Atack & Bateman, Reference Atack and Bateman1980, p. 125; Steckel, Reference Steckel1983; Atack & Bateman, Reference Atack and Bateman1987, pp. 87–92).
Historical BMI studies provide important insight into the evolution of health during economic development. For BMIs less than 20, Waaler (Reference Waaler1984) and Koch (Reference Koch2011) find an inverse relationship between BMI and mortality risk. Costa (Reference Costa1993b) applies Waaler's results to historical populations and finds the modern BMI relationship applies to historical populations, and Jee et al. (Reference Jee, Sull, Park, Lee, Ohrr, Guallar and Samet2006, p. 780, 784–785) find the relationship is stable across racial groups. Cuff (Reference Cuff1993) finds that mid-19th century West Point Cadet BMIs were low relative to modern BMI values and placed a large portion of 19th century Northern young males into a high relative risk of mortality. Coclanis & Komlos (Reference Coclanis and Komlos1995, pp. 102–103) find that late 19th century BMI values at The Citadel were comparable to those of West Point Cadets. Costa (Reference Costa2004, pp. 8–10) demonstrates that there were considerable differences between 19th century black and white BMIs, and that blacks had greater BMI values than whites (Flegal et al., Reference Flegal, Carroll and Ogden2010, p. 240). Health risks associated with greater white BMI values are also greater than those for blacks (Wienpahl et al., Reference Wienphal, Ragland and Sidney1990; Stevens et al., Reference Stevens, Keil, Rust, Tyroler, Davis and Gazes1992, Reference Stevens, Cai, Pamuk, Williamson, Thun and Woods1998; Sanchez et al., Reference Sanchez, Reed and Price2000; Abell et al., Reference Abell, Egan, Wilson, Lipsitz, Woolson and Lacklund2007; Flegal et al., Reference Flegal, Shepherd, Looker, Graubard, Borrud and Ogden2009, p. 507). Costa (Reference Costa2004) finds that BMI values increased between 1860 and 1950, and Cutler et al. (Reference Cutler, Glaeser and Shapiro2003) find that US BMIs have increased since the beginning of the 20th century, because people consume more calories, not because they are physically less active.
It is against this backdrop that this paper considers three paths of inquiry into BMI variation during Northern industrialization. First, how were 19th century black and white BMIs distributed in a 19th century urbanized region? The BMIs in Philadelphia were distributed symmetrically and neither wasting nor obesity was common. Second, how did late 19th and early 20th century BMI values compare by race? African-Americans consistently had greater BMI values than whites and mulattos; therefore, there is no evidence of a 19th century mulatto BMI advantage in the North, where the institution of slavery did not apply (Bodenhorn, Reference Bodenhorn1999). Third, between 1873 and 1913, how did black and white BMIs vary by socioeconomic status in a Northern industrializing region? Black and white BMIs varied by socioeconomic status, and farmer BMIs were consistently greater than BMIs for workers in other occupations.
Philadelphia and Pennsylvania: a case study in economic development
Nineteenth century Pennsylvania creates a unique environment to study BMI variation during urbanization and industrialization. As the process of agricultural commercialization separated dairy consumption from production, it increased the relative price of milk and decreased access to dairy products (Fletcher, Reference Fletcher1955, p. 165). In 1840, most of Pennsylvania's dairy production was produced on single family farms that primarily produced butter and cheese; little dairy surplus was left over for market. By 1900, Pennsylvania's dairy sector transformed into a highly organized commercial industry, supplying the fluid milk demand for urban markets. As Pennsylvania's dairy sector commercialized, the physical distance of consumers from dairy production increased, and most of this development occurred before refrigeration was available (Craig et al., Reference Craig, Goodwin and Grennes2004). The quality of Pennsylvania's 19th century dairy production was also questionable. Pennsylvania milk was adulterated by widespread milk watering and whitening, storing milk in tin cans, and the practice of feeding whiskey mash to dairy cows, which hastened spoilage. Therefore, 19th century Philadelphia creates a unique environment to study the net effects on BMIs during a period of considerable economic change.
Compared with other 19th century US regions, Pennsylvania's black population was relatively small and did not change proportionally throughout the 19th century (Carson, Reference Carson2008a). Pennsylvania also varied regionally by race. In 1850, 4.2% of Pittsburgh and 2.5% of Allegheny County's population was black (Blackett, Reference Blackett, Trotter and Smith1997, p. 149). By 1860, Philadelphia's free-black population was the second largest outside of the South – second only to Baltimore – making Pennsylvania racially and economically diverse (Hershberg, Reference Hershberg, Trotter and Smith1997, p. 124).
There were nine distinct geographic regions within Pennsylvania: Great Lakes, Appalachian Wilds, North-east Poconos, Central Pennsylvania, South-east (excludes Philadelphia), Pennsylvania Dutch, Laurel Highlands, Philadelphia and Pittsburgh regions (Fig. 1). Some prisoners were admitted to the system without identifying their county or region of incarceration, and therefore are coded as Pennsylvania At Large. These nine diffuse regions span Pennsylvania's economic and political environments. In 1800, Pennsylvania's population was rural and lived in towns of 2500 persons or fewer (Andriot, Reference Andriot1993, p. 670). Throughout the 19th century, nearly half of the state's population resided in the south-eastern Philadelphia region, which was among America's most economically developed regions (Cuff, Reference Cuff2005, pp. 68, 82–84). The south-east region also included Pennsylvania's leading dairy producing counties – Bucks, Chester and Lancaster – but also included Pennsylvania's most urban and industrialized county, Philadelphia. At the other extreme were Pennsylvania's Appalachian Wilds and North-east Poconoes, where populations were sparse, communities fragmented, and most economic production occurred in agricultural sectors (Cuff, Reference Cuff2005, pp. 88–92). Therefore, if BMIs were adversely related to 19th and early 20th century urbanization, BMIs will be lower in Philadelphia County.
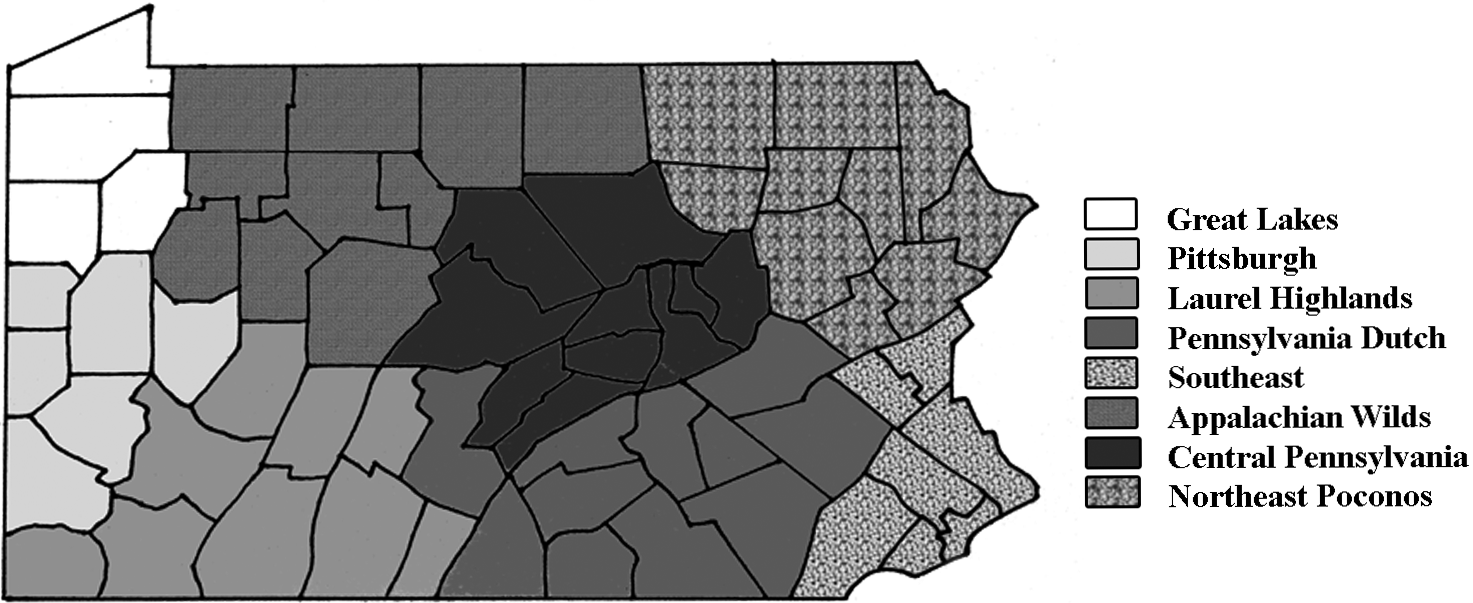
Fig. 1. Nineteenth century Pennsylvania regions. Pennsylvania's north-western Great Lakes region consists of Crawford, Erie, Mercer and Venango counties. The Appalachian Wilds consists of Warren, Forest, Clarion, Jefferson, Elk, McKean, Clearfield, Cameron, Potter and Tioga counties. Central Pennsylvania consists of Center, Clinton, Lycoming, Union, Snyder, Mifflin, Juniata, Columbia, Montour and Northumberland counties. Pocono counties include Bradford, Wayne, Lackawanna, Wyoming, Sullivan, Luzerne, Pike, Monroe, Carbon, Schuylkill, Susquehanna and Scranton counties. Counties in south-eastern Pennsylvania include Northampton, Lehigh, Bucks, Montgomery, Chester, Delaware and Philadelphia counties. Counties in the Pennsylvania Dutch region are Berks, Lancaster, Lebanon, York, Adams, Dauphin, Perry, Cumberland, Huntington and Franklin counties. The Laurel Highlands consist of Bedford, Fulton, Blair, Cambria, Somerset, Indiana, Westmoreland, Fayette, Greene, Altoona, Mount Pleasant and Johnston counties. Counties in the Pittsburg region include Butler, Lawrence, Beaver, Armstrong, Allegheny, Washington and Pittsburg counties. Proximity to a river means a county sharing a border with the Susquehanna River or Allegheny River Basin. For the Susquehanna, these counties include Bradford, Wyoming, Lackawanna, Luzerne, Columbia, Montour, Northumberland, Union, Snyder, Dauphin, Perry and Cumberland counties. Western counties sharing a border with the Allegheny, Monongahela and Ohio Rivers include Ohio, Beaver, Allegheny, Greene, Fayette, Washington, Westmoreland, Erie, Crawford, Venango, Clarion and Armstrong counties.
Pennsylvania was a major recipient of 19th century US immigrants, and New York, Pennsylvania and Ohio received the majority of the European immigration flow to the US. There was a distinct nativity advantage associated with US economic opportunity. After their arrival in the US, the British and Germans experienced greater economic opportunity than the Irish (Ferrie, Reference Ferrie1994, Reference Ferrie1999; Cohen, Reference Cohen2009). Moreover, internal US immigration was high, and during the 1860s, nearly 25% of native-born men lived in a state or territory different from their birth state (Atack & Bateman, Reference Atack and Bateman1987, p. 71). Therefore, during early industrialization, Philadelphia and Pennsylvania were primary recipients of 19th century US immigration, and material and biological welfare may have varied with Pennsylvania's industrialization and economic development (Cohen, Reference Cohen2009, p. 156). Northern states also had various levels of Underground Railroad activity. Clearfield, Chrystal Park, Uniontown and Philadelphia were all notable Pennsylvania cities and counties with considerable Underground Railroad activity. William Sill, the so-called father of the Underground Railroad, also lived in Philadelphia. Moreover, numerous Northern states implemented fugitive state laws in the early 19th century. The 1842 US Supreme Court decision Prigg vs Pennsylvania made it so state authorities were not required to act in fugitive slave cases; however, national authorities must carry out the national law.
Pennsylvania is also unique in its river transportation systems. On the eastern side of the state runs the Susquehanna River, which is America's longest river with an East Coast outlet that drains into the Atlantic Ocean. The Susquehanna originates in New York's Lake Otsego, runs through Pennsylvania's south-eastern rural farmland, and empties into the Chesapeake Bay. Moreover, the Susquehanna's proximity to Pennsylvania's anthracite coal region made it an integral part of US 19th century economic development (Cuff, Reference Cuff2005, pp. 84–86). On the western side of the state is Pennsylvania's Allegheny River Basin, which contains the Allegheny, Ohio and Mononghela Rivers, and was one of America's most productive 19th century energy-producing regions. Consequently, Pennsylvania's physical geography and river basins influenced Pennsylvania's economic production, population distribution and BMIs.
The nineteenth century Philadelphia County prison
The Philadelphia County (Holmesburg) prison was erected in the early 1830s with resources allocated by the Philadelphia Assembly. Like the Eastern Pennsylvania state prison, while incarcerated inmates were given diverse occupations and held in solitary, or near solitary, confinement for their sentence durations (Pennsylvania General Assembly, 1838, pp. 4–7). Moreover, while males and females were housed in the Philadelphia County prison, any form of interaction or visual contact between them was strictly prohibited. Because there were too few female observations to produce reliable results, females are excluded here, and the few Philadelphia female observations are combined with various other female prisons in Carson (Reference Carson2011).
Data used to study black and white anthropometrics are a subset of a much larger 19th century prison sample. All available records from American state repositories have been acquired and entered into a master file. These records include Arizona, California, Colorado, Idaho, Illinois, Kansas, Kentucky, Mississippi, Missouri, Montana, Nebraska, New Mexico, Ohio, Oregon, Pennsylvania, Philadelphia, Texas, Utah and Washington. To isolate the effects of urbanization on BMI, only prison records for inmates incarcerated in the Philadelphia County prison are used in this project. All records with complete age, stature, occupations and nativity were collected. Because the comparison is between black and white American males, females were excluded from the analysis.
All historical data have various biases, and there is always concern over entry requirements. Physical descriptions were recorded by prison enumerators at the time of incarceration as a means of identification, and therefore represent pre-incarceration conditions. While prison records are not random samples, the selectivity they represent has its own advantages, such as being drawn from lower socioeconomic groups, that segment of society most vulnerable to economic change. This kind of selection is preferable to the type of selection that afflicts military samples – minimum stature enlistment requirements (Fogel et al., Reference Fogel, Engerman, Trussell, Floud, Pope and Wimmer1978, p. 85). By arbitrarily truncating shorter statures, military records underestimate BMI values, because shorter statures are associated with greater BMI values (Herbert et al., Reference Herbert, Richards-Edwards, Manson, Ridker, Cook, O'Conner, Buring and Hennekens1993).
Between 1873 and 1913, over 21,000 male inmates were incarcerated in the Philadelphia County prison, and over 20% of the Philadelphia County prison population was foreign born. Prison guards routinely recorded the dates inmates were received, age at incarceration, complexion, nativity, height, weight, pre-incarceration occupation, inmate crimes, and the county in which inmates were received. Inmate height and weight measurements were recorded in detail because accurate measurement had legal implications in the event that inmates escaped and were later recaptured.
Fortunately, inmate enumerators were quite thorough when recording inmate complexion and occupation. For instance, Philadelphia County prison enumerators recorded African-Americans as black, various shades of brown, coloured and Negro. Enumerators recorded white complexions as light, medium, dark and fair. The white inmate complexion is further supported by European immigrant complexions, which were always of fair complexion and were also recorded as light, medium and dark. This classification is also supported by European inmates in US prisons who were of fair complexion and recorded as light, medium and dark. While mulatto inmates possessed genetic traits from both European and African ancestry, they were treated as blacks in the 19th century US, and when comparing whites with blacks, mulattos are included with blacks.
Enumerators recorded a broad continuum of occupations and defined them narrowly, recording over 200 different occupations. These occupations are classified into four categories. Workers who were merchants and highly skilled are classified as white collar workers; manufacturing workers and carpenters are classified as skilled workers; workers in the agricultural sector are classified as farmers; labourers are classified as unskilled workers. Unfortunately, inmate enumerators did not distinguish between farm and common labourers. Since common labourers were frequently agricultural labourers, this potentially overestimates the biological benefits of being a common labourer and underestimates the advantages of being a farm labourer. By having low turnover among prison enumerators, the consistency of the Philadelphia sample creates reliable comparisons across race and time.
Table 1 presents black and white average BMIs and proportions by occupation, proximity to water (residence prior to incarceration in a county containing or bordering the Susquehanna or Allegheny Rivers) and residence. Although average BMIs are included, they are not reliable because of possible compositional effects, which are accounted for in the regression models that follow.
Table 1. Nineteenth century black and white Philadelphia County prison inmate characteristics

Blacks in the prison sample were concentrated near Philadelphia and the Laurel Dutch Highlands, away from rivers and were unskilled; whites were skilled artisans and farmers who resided in the Allegheny River Basin and northern Pennsylvania. The largest BMI difference between black and white youth by occupation was for white collar and skilled workers, which is consistent with other 19th century BMI studies.
Nineteenth century Philadelphia County black and white BMI distributions
The shape of the BMI distribution tells us much about the current biological conditions facing a population. On the one hand, 17th and 18th century BMIs may have been low because of meager diets relative to work expenditures, which continued into the 19th century (Fogel, Reference Fogel1994, p. 373). On the other, 19th century BMIs may have increased as US agricultural settlement produced more nutritious diets relative to calories devoted to work and to fend off disease. Shifts in relative well-being over the life-cycle complicate interpreting BMIs. For example, if an individual is poorly nourished as a youth, their statures may be short, their frames are possibly smaller, and their basal metabolic needs would be relatively low. Improved nutrition later in life, therefore, results in higher BMI values. Alternatively, a well nourished individual during youth may have larger frames. Their basal metabolic needs are higher, resulting in lower BMIs later in life.
Using the World Health Organization BMI classification coding system for modern standards, individuals in the Philadelphia County sample with BMIs less than 18.5 are classified as underweight; BMIs between 18.5 and 24.9 are normal; BMIs greater than 24.9 but less than 30 are overweight; BMIs greater than 30 are obese. Because BMIs are sensitive to age, two groupings are considered in Fig. 2: youths and adults.

Fig. 2. Nineteenth century Philadelphia County prison BMIs by age and race.
Figure 2 illustrates that the overwhelming proportion of 19th century black and white BMIs fell within the normal BMI category and neither malnourishment nor obesity was the historical problem in Philadelphia. Average black youth and adult BMIs were 23.35 and 24.30, respectively. Average white youth and adult BMIs were 22.48 and 23.01, respectively, indicating that average black BMIs were between 4 and 5% heavier than average white BMIs (Flegal et al., Reference Flegal, Carroll and Ogden2010, p. 240). Although blacks came to shorter terminal statures, they were less likely to be underweight, in part, because muscle is heavier than fat, and modern blacks are leaner and have lower percentage body fat than whites (Aloia et al., Reference Aloia, Vaswani, Ma and Flaster1996, p. 116; Fernandez et al., Reference Fernandez, Heo, Heymsfield, Pierson, Pi-Sunyer and Wang2003; Evans et al., Reference Evans, Rowe, Racette, Ross and McAuley2006; Flegal et al., Reference Flegal, Shepherd, Looker, Graubard, Borrud and Ogden2009, p. 507; Flegal et al., Reference Flegal, Carroll and Ogden2010, p. 240). Moreover, blacks were nearly twice as likely as whites to be overweight. However, heavier 19th century black BMIs are not necessarily a sign of more robust health because blacks were shorter than whites, and shorter statures are associated with heavier BMIs (Herbert et al., Reference Herbert, Richards-Edwards, Manson, Ridker, Cook, O'Conner, Buring and Hennekens1993, p. 1438).
The percentages of black and white males in the Holmesburg prison between the ages of 20 and 21 with BMIs below the threshold of 19 – that which marks an increase in mortality risk – were only 1.9 and 3.8%, respectively, compared with 40% for West Point Cadets (Cuff, Reference Cuff1993, p. 178). Morbid obesity is defined as a BMI>40, and has been linked to elevated risks of diabetes mellitus, cardiovascular disease and cancer (Pi-Sunyer, Reference Pi-Sunyer1991, p. 1599s; Kenchaiah et al., Reference Kenchaiah, Evans, Levy, Wilson, Benjamin, Larson, Kannel and Vasan2002, p. 306–312; Calle et al., 2003, pp. 1628–1630). Cases of 19th century black and white morbid obesity in the Philadelphia County sample were nearly non-existent. Only 0.018% of blacks and 0.013% of whites in the Philadelphia County prison were morbidly obese, and this indicates that modern Americans are more likely than inmates in the 19th century Philadelphia County prison to be morbidly obese. Therefore, compared with a modern developed economy, blacks and whites in the Philadelphia County prison were in moderate weight ranges, and morbid obesity was nearly unheard of.
Black and white demographics, occupations and BMIs: a qualitative response model
The underweight, normal, overweight and obese categories give a natural range of binary classifications for 19th century BMI classifications and multinomial logit models for underweight, overweight and obese classifications are used here to illustrate black and white characteristics associated with BMI classifications. Coefficients are reported in odds ratios, which represent the probability of being in a given BMI classification relative to the normal category. For example, in Table 2's Model 3 the odds ratio for 50-year-olds of 1.63 indicates that 50-year-olds were 63% more likely than the 20-year-old control group to be in the overweight BMI category.
Table 2. Nineteenth century black and white Philadelphia County OLS and multinomial logit regression models

The following geographic classification scheme is consistent with Carlino & Sill (Reference Carlino and Sill2001): New England=CT, ME, MA, NH, RI and VT; Middle Atlantic=DE, DC, MD, NJ, NY and PA; Great Lakes=IL, IN, MI, OH and WI; Plains=IA, KS, MN, MO, NE, ND and SD; South-east=AL, AR, FL, GA, KY, LA, MS, NC, SC, TN, VA and WV; South-west=AZ, NM, OK and TX; Far West=CA, CO, ID, MT, NV, OR, UT, WA and WY. Because of fewer observations, black and white youth observations are combined for the 1840s and 1850s.
* p<0.10;
** p<0.05;
*** p<0.01.
To start, the BMI of the ith individual at time t is classified as underweight, overweight and obese categories, where pj is the probability of falling into a respective category relative to the normal category.

Stature in centimetres is included to account for the inverse relationship between BMI and stature. Black and mulatto complexion dummy variables account for skin pigmentation. Dummy variables are included for individual youth ages 15 through 22; adult age dummies are in 10-year intervals from the 30s through 60s. Year received dummy variables are in 10-year intervals from 1870 through 1810. Occupation dummy variables are for white collar, skilled, farmers and unskilled occupations. Nativity dummy variables are included for national and international nativity. Dummy variables are added to account for proximity to the Susquehanna and Allegheny River Basins.
Three general patterns emerge when comparing 19th century black and white BMIs in Philadelphia. First, 19th century black BMIs were greater than white BMI values (Costa, Reference Costa2004, p. 8; Flegal et al., Reference Flegal, Carroll and Ogden2010, p. 240), and it is striking that proportionally so many whites relative to blacks fell into the underweight category. Nineteenth century mulatto statures were consistently taller than darker black statures, a comparison known as the ‘mulatto advantage’, and taller 19th century mulatto statures are typically attributed to social preferences that disproportionately favoured fairer complexioned mulattos (Steckel, Reference Steckel1979; Bodenhorn, Reference Bodenhorn1999; Carson, Reference Carson2008b; Carson, Reference Carsonin press). However, if mulattos received disproportionate biological benefits from social preferences, fairer complexioned mulattos would have had greater BMIs than darker complexioned blacks. After controlling for stature, blacks consistently had greater BMI values than mulattos and whites; therefore, there is no evidence of a 19th century mulatto BMI advantage in the North, where the institution of slavery did not apply. During the late 19th and early 20th centuries, US black incomes probably increased, and blacks devoted a larger share of their incomes than whites to food acquisition, which may have been associated with heavier black BMIs (Higgs, 1977, p. 107; Bodenhorn, Reference Bodenhorn1999, pp. 985–993; Komlos & Lauderdale, Reference Komlos and Lauderdale2005; Flegal, et al., Reference Flegal, Carroll, Ogden and Johnson2002; Flegal, Reference Flegal, Carroll and Ogden2010, p. 240). Part of lower mulatto BMIs may also be biological. Nineteenth century mulatto statures were consistently taller than those of their black complexioned counterparts, and blacks have lower percentage body fat than whites (Steckel, Reference Steckel1979; Bodenhorn, Reference Bodenhorn1999, 2001; Carson, Reference Carson2008b, Reference Carson2009).
Second, black and white BMIs varied by socioeconomic status, and farmer BMIs were consistently greater than those of workers in other occupations, indicating that rural diets and less exposure to viral and infectious diseases accrued to farmers (Metzer, Reference Metzer1975, p. 134; Steckel, Reference Steckel1979, p. 373; Margo & Steckel, Reference Margo and Steckel1982, p. 525). Because muscle is heavier than fat, part of farmers' heavier BMIs may be related to physical activity. Agricultural workers used between 2.5 and 6.8 energy multiples of sleeping basal metabolic rate (Food and Agricultural Organization of the United Nations, 1985; Fogel, Reference Fogel1994), indicating that agricultural workers had greater BMI values because they consumed nutritious diets and were more physically active than workers in other occupations. On the other hand, skilled workers only used between 1.5 and 2.5 energy multiples of sleeping basal metabolic rate, and because of their physical inactivity relative to calories consumed, experienced excess weight gain.
Third, BMIs varied considerably by Pennsylvania, US, and international nativity and illustrates that individuals in south-eastern Pennsylvania (excludes Philadelphia) were about 40% more likely to be overweight than individuals from outside south-eastern Pennsylvania. South-eastern Pennsylvanians were closer to its leading dairy-producing Bucks, Chester and Lancaster counties, and south-eastern Philadelphia BMIs were greater than those of other nativities. If BMIs represent the net current difference between diets, work expenditures and diseases, BMIs in industrialized cities were lower than elsewhere within the US. However, after controlling for stature, international nativity illustrates that urban nativity was unlikely to be in normal BMI ranges and more likely to be in either underweight, overweight or obese categories.
Other patterns are consistent with expectations. A novel aspect of the Philadelphia prison sample is proximity to water. Two possibly counteracting forces may obscure the relationship between proximity to water and BMI. If trade decreased transaction costs and increased access to imported foodstuffs, BMI may have increased with closer proximity to water. However, if trade increased the relative cost of acquiring net nutrition, BMIs may have been lower with closer proximity to water (Haines et al., Reference Haines, Craig and Weiss2003, p. 408). The BMIs in close proximity to eastern and western Pennsylvania waterways were greater than those in counties that did not share a border with waterways, indicating that proximity to trade routes decreased the price of net nutrition relative to energy expended for work (Haines et al., Reference Haines, Craig and Weiss2003, p. 405). Body mass index values also increased over time and were progressively more likely to be overweight and obese.
Discussion
For 19th century Philadelphia blacks and whites, the underclass was reasonably well nourished, even in a Northern industrializing region. Unlike modern BMIs, 19th century Northern black and white BMIs were symmetrically distributed, and widespread wasting was not common. Rather, 19th century black and white BMIs in the North were in normal, healthy BMI categories; therefore, 19th century health that was poor by modern standards was not related to BMIs. Unlike stature studies, there was no 19th century BMI mulatto advantage, and mulatto BMIs were less than darker black BMIs. Farmers, who were physically active and obtained sufficient calories to maintain health, had greater BMI values than workers in other occupations. Nutrition relative to work expenditure was good in a Northern US state, even among the working class, as it was throughout US history because of abundant agricultural resources, nutrition and access to animal proteins. Nineteenth century BMIs in industrializing US cities were the result of a complex set of demographic and socioeconomic characteristics, and relationships between BMI and observable characteristics reflect 19th century US industrialization.
Acknowledgments
The authors appreciate comments from John Komlos, Marco Sunder and Tom Maloney.


