INTRODUCTION
Fish larvae are exposed to pathogens long before their immunocompetence is attained. How developing fish embryos/larvae survive microbial attacks is one of the central problems for reproductive and developmental immunology. It is believed that fish embryo/larvae mainly rely on maternal immunity. The presence of humoral immune factors including IgM (Van Loon et al., Reference Van Loon, van Osterom and van Muiswinkel1981; Bly et al., Reference Bly, Grimm and Morris1986; Mor & Avtalion, Reference Mor and Avtalion1990; Castillo et al., Reference Castillo, Sanchez, Dominguez, Kvaattari and Villena1993; Breuil et al., Reference Breuil, Vassiloglou, Pepin and Romestand1997; Olsen, Reference Olsen1997; Hanif et al., Reference Hanif, Bakopoulos and Dimitriadis2004; Picchietti et al., Reference Picchietti, Taddei, Scapigliati, Buonocore, Fausto and Romano2004, Reference Picchietti, Abelli, Buonocore, Randelli, Fausto, Scapigliati and Mazzini2006; Swain et al., Reference Swain, Dash, Bal, Routray, Sahoo, Sahoo, Saurabh, Gupta and Meher2006; Zapata et al., Reference Zapata, Diez, Cejalvo, Frías and Cortés2006), complement (Ellingsen et al., Reference Ellingsen, Strand, Monsen, Bøgwald and Dalmo2005; Huttenhuis et al., Reference Huttenhuis, Grou, Taverne-Thiele, Taverne and Rombout2006; Løvoll et al., Reference Løvoll, Kilvik, Boshra, Bogwald, Sunyer and Dalmo2006, Reference Løvoll, Johnsen, Boshra, Bøgwald, Sunyer and Dalmo2007; Wang et al., Reference Wang, Zhang, Wang and An2008b), lectin (Bildfell et al., Reference Bildfell, Markham and Johnson1992; Tateno et al., Reference Tateno, Yamaguchi, Ogawa, Muramoto, Watanabe, Kamiya and Saneyoshi2002; Jung et al., Reference Jung, Park and Kim2003), protease inhibitors (Yamashita & Konagaya, Reference Yamashita and Konagaya1996; Choi et al., Reference Choi, Park and Kim2002) and lysozyme (Kudo, Reference Kudo1991, Reference Kudo1992; Yousif et al., Reference Yousif, Albright and Evelyn1991, Reference Yousif, Albright and Evelyn1994; Takemura & Takano, Reference Takemura and Takano1995; Takemura, Reference Takemura1996; Brown et al., Reference Brown, Cox and Levine1997; Cecchini et al., Reference Cecchini, Terova, Caricato and Saroglia2000; Wang & Zhang, Reference Wang and Zhang2010) has been reported in the eggs, embryos and larvae of different teleost species. However, little information is available on the effective duration of maternal immunity, especially whether it can be maintained until the maturation of larvae's own immune system. Therefore, knowledge on the ontogeny and maturation of the immune system of fish offspring might help us better understand the anti-infection mechanism in early fish life and demonstrate the potential value of maternal immunity in aquaculture.
The complement system is one of the first lines of defence against pathogenic infection, which can be activated by three different but partially overlapping routes: the classical pathway (CP), the alternative pathway (AP) and the lectin pathway (LP). The CP activation is initiated by binding of antibody to the C1 complex, formed by C1q and two serine proteases (C1r and C1s), or by direct binding of the C1q component to the pathogen surface (Kishore & Reid, Reference Kishore and Reid2000; Brown et al., Reference Brown, Hussell, Gilliland, Holden, Paton, Ehrenstein, Walport and Botto2002; Thielens et al., Reference Thielens, Tacnet-Delorme and Arlaud2002). The AP is mainly triggered by certain structures on microbial surfaces in an antibody-independent manner (Holland & Lambris, Reference Holland and Lambris2002), which needs factor B (Bf) and factor D (Df). The LP is activated by binding of microbial polysaccharides to circulating lectins, such as mannose-binding lectin (MBL) (Fujita, Reference Fujita2002), the C4 is then cleavaged via mannose-binding protein-associated serine protease (MASP). All the three pathways merge at an amplification step involving C3 and proceed through a common lytic pathway that leads to the formation of a membrane attack complex including C6–C9, which can directly lyse microbial cells.
Recently, it has been demonstrated that maternal complement components contribute to the bacteriolytic activity of the fertilized eggs of zebrafish (Danio rerio) (Wang et al., Reference Wang, Zhang, Wang and An2008b), and mother immunization can enhance the vertical transfer of maternal complement components so as to improve the immunity of zebrafish offspring (Wang et al., Reference Wang, Zhang, Li, Tong and Wang2009). Moreover, the early ontogeny of complement expression and activity has been studied in several fish species. For example, C3 mRNA and proteins have been shown to be produced in the eggs, embryos and larvae of halibut (Hippoglossus hippoglossus L.) (Lange et al., Reference Lange, Bambir, Dodds, Bowden, Bricknell, Espelid and Magnadóttir2006), cod (Gadus morhua L.) (Lange et al., Reference Lange, Dodds, Gudmundsdóttir, Bambir and Magnadóttir2005), salmon (Salmo salar) (Løvoll et al., Reference Løvoll, Johnsen, Boshra, Bøgwald, Sunyer and Dalmo2007), wolffish (Anarhichas minor Olafsen) (Ellingsen et al., Reference Ellingsen, Strand, Monsen, Bøgwald and Dalmo2005), carp (Cyprinus carpio) (Huttenhuis et al., Reference Huttenhuis, Grou, Taverne-Thiele, Taverne and Rombout2006) and trout (Oncorhynchus mykiss) (Løvoll et al., Reference Løvoll, Kilvik, Boshra, Bogwald, Sunyer and Dalmo2006). The ontogeny of Bf, Df, C4, C5 and C7 was also studied in the rainbow trout (Løvoll et al., Reference Løvoll, Kilvik, Boshra, Bogwald, Sunyer and Dalmo2006). We once found that the zebrafish complement system operating via AP is competent shortly after hatching, based on the expression changes of complement genes when the offspring was constantly cultured in LPS-containing water from 2 h post-fertilization (2 hpf) (Wang et al., Reference Wang, Zhang and Wang2008a). In this work, the ontogeny and maturation of zebrafish complement system was further investigated, with special reference to compare the expression pattern of key complement genes in response to short-term LPS challenge in the adult fish and the larvae at different developing stages.
MATERIALS AND METHODS
Fish, embryos and larvae
Adult zebrafish (Danio rerio) were purchased from a local fish dealer and maintained in well-aerated tap water at 26 ± 1°C in a natural light:dark cycle. After acclimation for two weeks, nine healthy fish were immersed in water with 20 μg/ml LPS (sigma) and three fish were sampled at 3, 6 and 12 h respectively, three fish in just water were collected as control.
Sexually mature D. rerio were placed in the late evening at a female to male ratio of 2:1, and about 3000 naturally fertilized eggs were collected early the next morning and cultured at 26 ± 1°C. Hatched larvae were fed twice a day with paramecium culture. At 3, 7, 14, 21 and 28 d post-fertilization (dpf), 100 larvae were transferred to the water filled with 1 μg/ml LPS and about 30 larvae were sampled after 3, 6 and 12 h post-challenge (hpc), larvae without LPS treatment were used as control.
RNA extraction and cDNA synthesis
The fish samples were crushed in a mortar filled with liquid nitrogen, and total RNA was prepared with TRIzol according to the manufacturer's protocol. For the larvae samples, they were collected into a centrifuge tube, washed three times with DEPC-treated water and milled with a plastic pestle after 50 μl TRIzol was added. Finally, another 450 μl TRIzol was supplemented and it was vigourously shaken for 15 s. The total RNA was then isolated.
The concentration and quality of the RNA samples were measured by spectrophotometry (Genequant, Amersham Biosciences, USA), and the integrity checked by electrophoresis in 1% agarose gel. The RNA samples were then stored at −70°C for further use.
After digestion with RQ1 RNase-free DNase (Promega) to eliminate the genomic contamination, the cDNA templates were synthesized with reverse transcription kit (Invitrogen) using the Oligo(dT) primer. The reaction was carried out at 42°C for 50 min and inactivated at 95°C for 5 min. To evaluate if there is any genomic contamination, a β-actin primer set (sense primer, 5′-CTC CGG TAT GTG CAA GGC-3′; antisense primer, 5′-GCT GGG CTG TT GAA GGT C-3′) amplifying a region including an intron was also used. The cDNA was then stored at −20°C until use.
Quantitative real-time PCR
Seven PCR primer sets specific for the complement genes C3, C1r/s, C4, C6, Bf, MBL and MASP were selected according to Wang et al. (Reference Wang, Zhang, Wang and An2008b). β-actin, a validated reference gene for time course studies in D. rerio embryogenesis (Tang et al., Reference Tang, Dodd, Lai, McNabb and Love2007), was selected to standardize the results by eliminating variations in mRNA and cDNA quantity and quality (Chen et al., Reference Chen, Chen and Wu2003). The primer set for β-actin was selected from Keegan et al. (Reference Keegan, Feldman, Lee, Koos, Ho, Stainier and Yelon2002). The primer sequences and amplicon sizes are listed in Table 1. All the primers were synthesized by Sangon (China). The effectiveness to amplify the desired fragment and the amplification efficiency of each primer set was checked with the cDNA from the liver of adult fish.
Table 1. Primers used for real-time PCR analysis.

*, C4 involved in both dassical pathway and lectin pathway.
After qualification of the cDNA templates and primers, real-time PCR was performed on ABI 7500 real-time PCR system. SYBR Premix® Ex TaqTM (Takara) was used according to the manufacturer's protocol with a primer concentration of 200 nM. Reaction conditions were as follows: 95°C for 10 s, followed by 40 cycles of 95°C for 5 s, 60°C for 15 s and 72°C for 35 s. Reaction of each sample was performed in triplicate. Dissociation analysis was performed at the end of each PCR reaction to confirm the amplification specificity.
The dissociation curve of amplification products showed in all cases only a single peak, indicating that the amplifications were specific. Moreover, the amplification efficiency of all the primer sets kept within 0.92 to 0.98 (data not shown), indicating that the obtained expression levels of different genes can be compared with each other.
After the PCR program, data were analysed with ABI 7500 SDS software (Applied Biosystems), and quantified with the comparative Ct method (2−ΔΔCt) based on Ct values for complement genes and β-actin in order to calculate the relative mRNA expression level (Livak & Schmittgen, Reference Livak and Schmittgen2001). The expression levels of tested genes were given in fold increase compared to C3 expression level in the control larvae of 3dpf.
Statistical analysis
All experiments were performed in triplicate and repeated three times. Statistical analysis was performed using SPSS 13.0. The data obtained from real-time PCR analysis were subjected to one-way analysis of variance followed by Dunnett two-sided test to determine differences in the mean values among the treatments, and the data were expressed as means ± SD. Significance was concluded at P < 0.05.
RESULTS
Expression levels of main complement genes and their responses to LPS challenge in adult fish
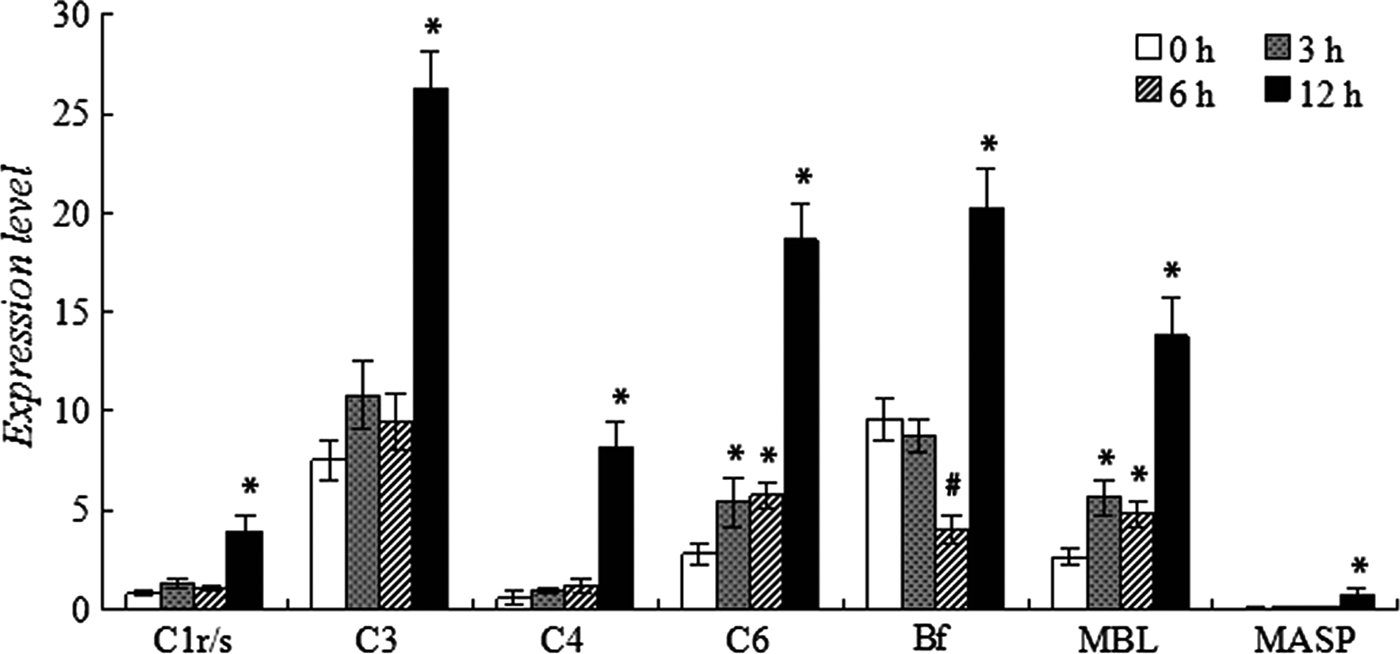
Figure 1 shows the expression level of selected complement genes in the control and LPS challenged fish. In the control fish, the complement genes involved in CP and LP (mainly C1r/s, C4, MBL and MASP) all expressed at a relatively lower level compared to C3 (the key component of complement system) and Bf (involved in AP). The expression levels of C1r/s, C4, MBL, MASP, C3 and Bf were 0.788, 0.563, 2.644, 0.046, 7.521 and 9.600-fold, respectively. Moreover, the representative gene of the common lytice pathway, C6, expressed at 2.808-fold.

Fig. 1. Expression of complement genes in the normal and LPS-challenged adult zebrafish. * or # means the gene expression was significantly up-regulated or down-regulated after challenge.
When challenged with 20 μg/mL LPS, no significant change in the expression level was observed in 6 h for C1r/s, C3, C4 and MASP in contrast to the rapid increase of C6 and MBL at 3 hpc, a dramatic drop of Bf expression was detected at 6 hpc. Along with the duration of challenge, all complement genes up-regulated and peaked at 12 hpc.
Expression of C3 and its response to LPS challenge in developing larvae
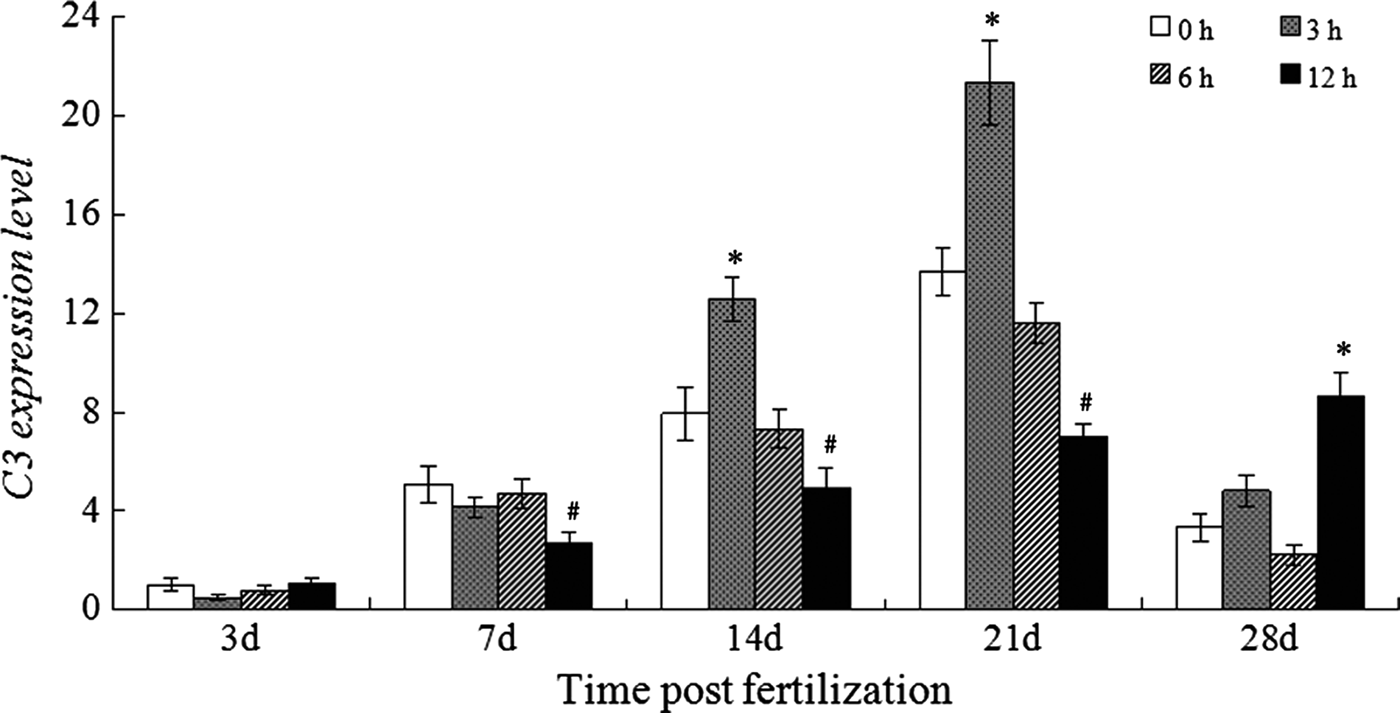
As shown in Figure 2, a steady increase in C3 expression in the control larvae was detected from 3 to 21 dpf, which is similar to the finding that the C3 expression continuously increased up to 24 dpf (Wang et al., Reference Wang, Zhang and Wang2008a). The C3 expression levels in the developing larvae were 1.0, 5.092, 11.942 and 13.675-fold on 3, 7, 14 and 21 dpf, respectively. However, it dramatically dropped to 3.343-fold on 28 dpf.

Fig. 2. Expression of C3 in the normal and LPS-challenged larvae. * or # means the gene expression was significantly up-regulated or down-regulated after challenge.
The LPS challenge did not affect the C3 expression in the larvae on 3 dpf, while a significant decrease of C3 expression in the larvae on 7 dpf was detected at 12 hpc. For the larvae on 14 and 21 dpf, LPS challenge up-regulated the C3 expression at 3 hpc, which was followed by a rapid decrease and it dropped to below the normal level at 12 hpc. Moreover, the response of C3 expression to LPS challenge in the larvae at 28 dpf was similar to the response pattern of C3 in the adult Danio rerio, both starting increasing since 12 hpc.
Expression of Bf and its response to LPS challenge in developing larvae
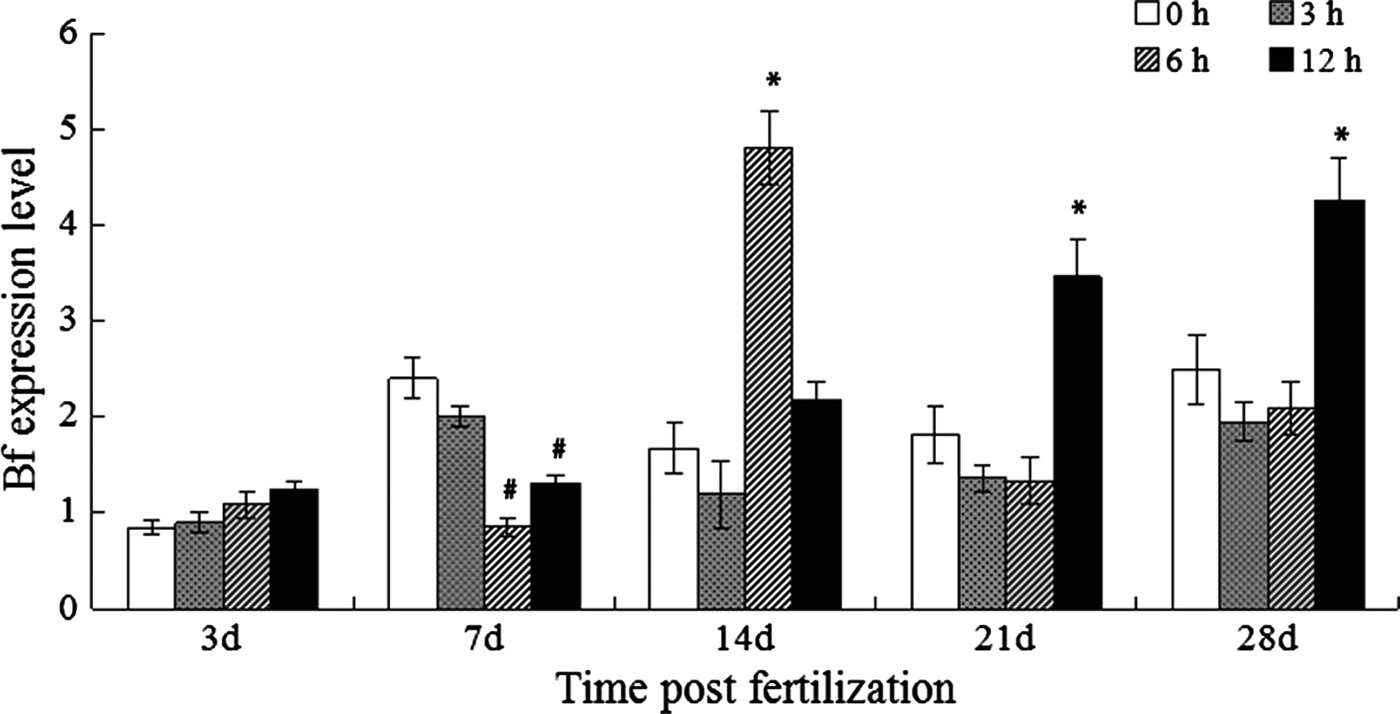
The fluctuations were detected for the Bf expression in developing unstimulated zebrafish larvae, with the expression level at 0.843, 2.400, 1.672, 1.812 and 2.489-fold on 3, 7, 14, 21 and 28 dpf, respectively (Figure 3). When challenged with LPS, no obvious change in the Bf expression was observed for the larvae at 3 dpf, but it induced a marked decline of Bf expression since 6 hpc for the larvae at 7 dpf, although a slight rebound was observed at 12 hpc. The Bf expression began to increase at 6 hpc (4.808-fold) and it nearly restored to the normal level at 12 hpc for the larvae on 14 dpf. The LPS challenge affect the Bf expression in a similar way for the larvae on 21 and 28 dpf, both of them started up-regulation at 12 hpc as is shown in the adult fish.

Fig. 3. Expression of Bf in the normal and LPS-challenged larvae. * or # means the gene expression was significantly up-regulated or down-regulated after challenge.
Expression of C1r/s and C4 and their response to LPS challenge in developing larvae
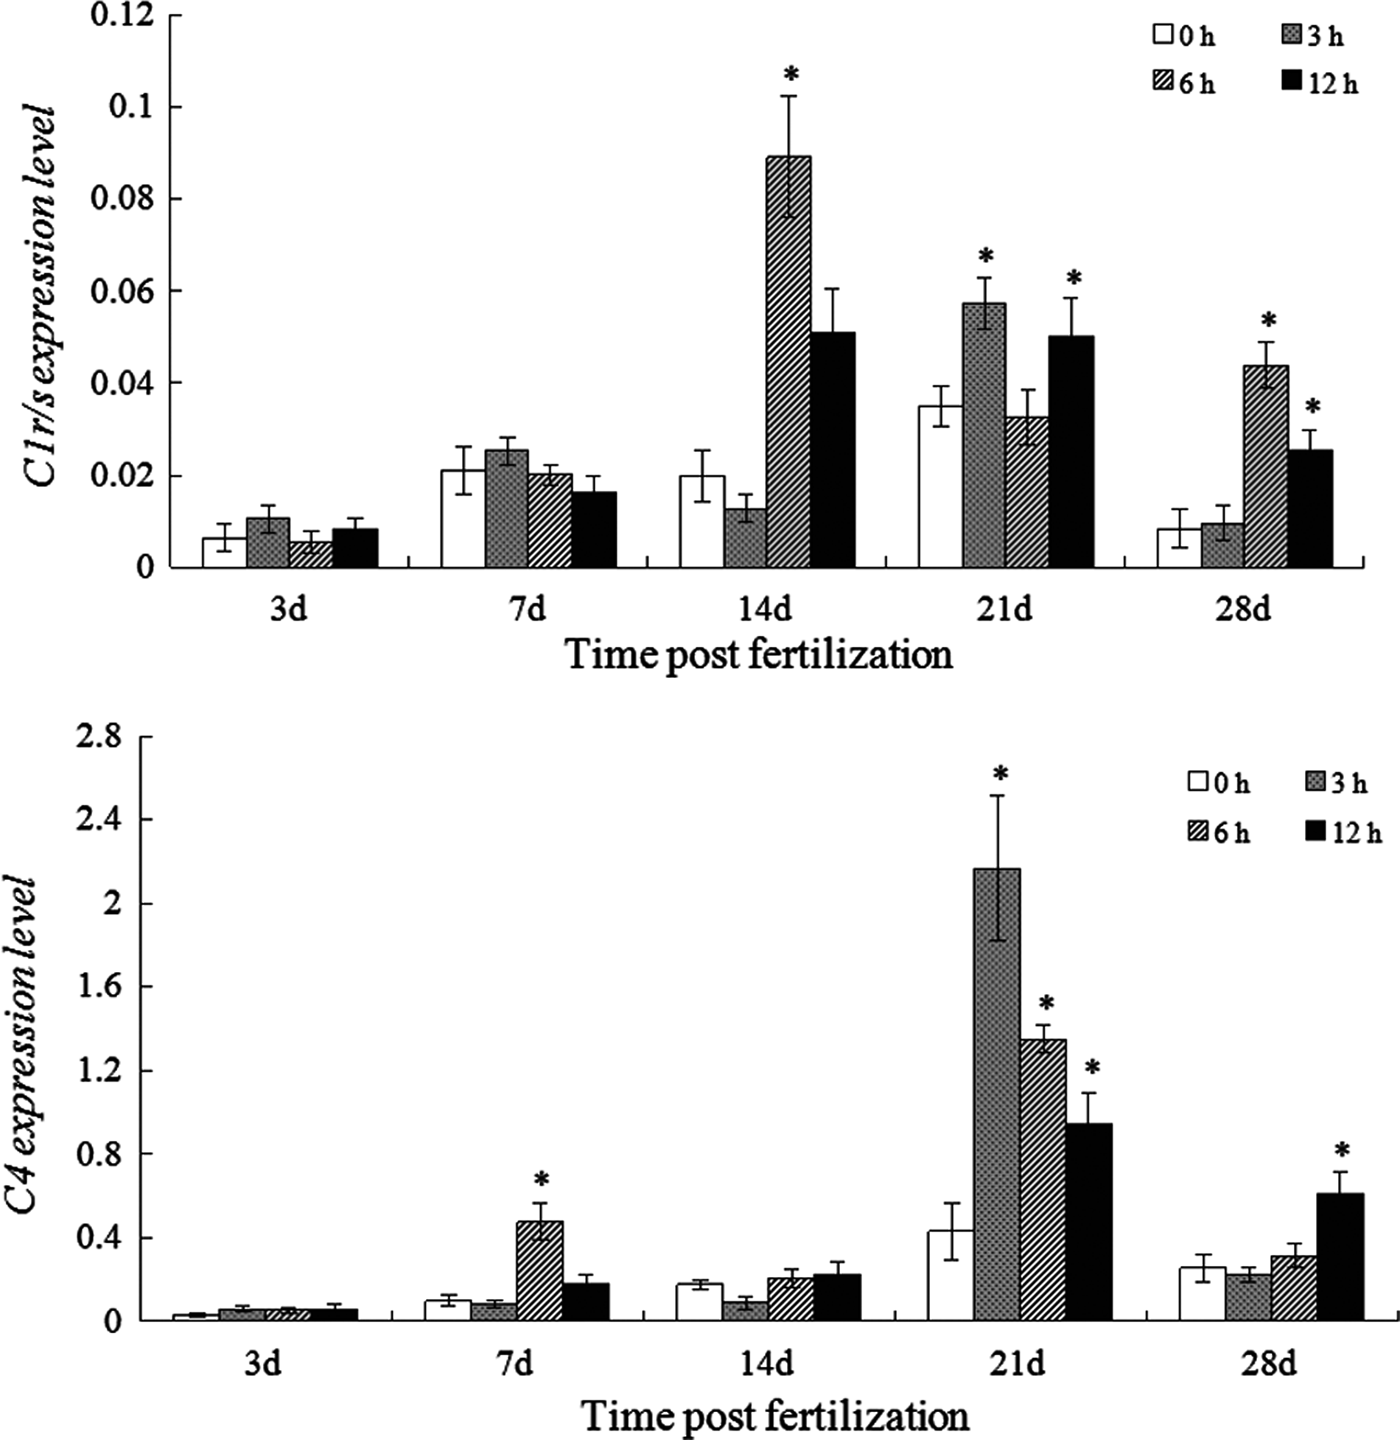
Both C1r/s and C4 expression in the control larvae continuously increased and peaked on 21 dpf, with the maximum of 0.035 and 0.433-fold, respectively. Afterwards, their expression was both followed by a decline (0.008 and 0.257-fold, respectively) at 28 dpf (Figure 4A, B). Figure 4 also showed that the expression levels of C4 greatly exceeded those of C1 r/s in the larvae at any developing stages.

Fig. 4. Expression of C1r/s (A) and C4 (B) in the normal and LPS-challenged larvae. *, means the gene expression was significantly up-regulated after LPS challenge.
Following LPS challenge, no marked change in C1r/s expression was observed in the larvae at 3 and 7 dpf. For the larvae at later development stages (from 14 to 28 dpf), it started increasing at 3 or 6 hpc and still maintained at higher levels at 12 hpc.
The influence of LPS challenge on C4 expression in the larvae from 3 to 14 dpf was limited, although a marked up-regulation was detected at 6 hpc in the larvae at 7 dpf. In the LPS challenged larvae at 21 dpf, C4 expression rapidly increased and peaked at 3 hpc (2.167-fold), which was followed by a decline. The LPS challenge induced a similar influence on the C4 expression in the larvae at 28 dpf and adult fish, the significant elevation was only observed at 12 hpc.
Expression of MBL and MASP and their response to LPS challenge in developing larvae
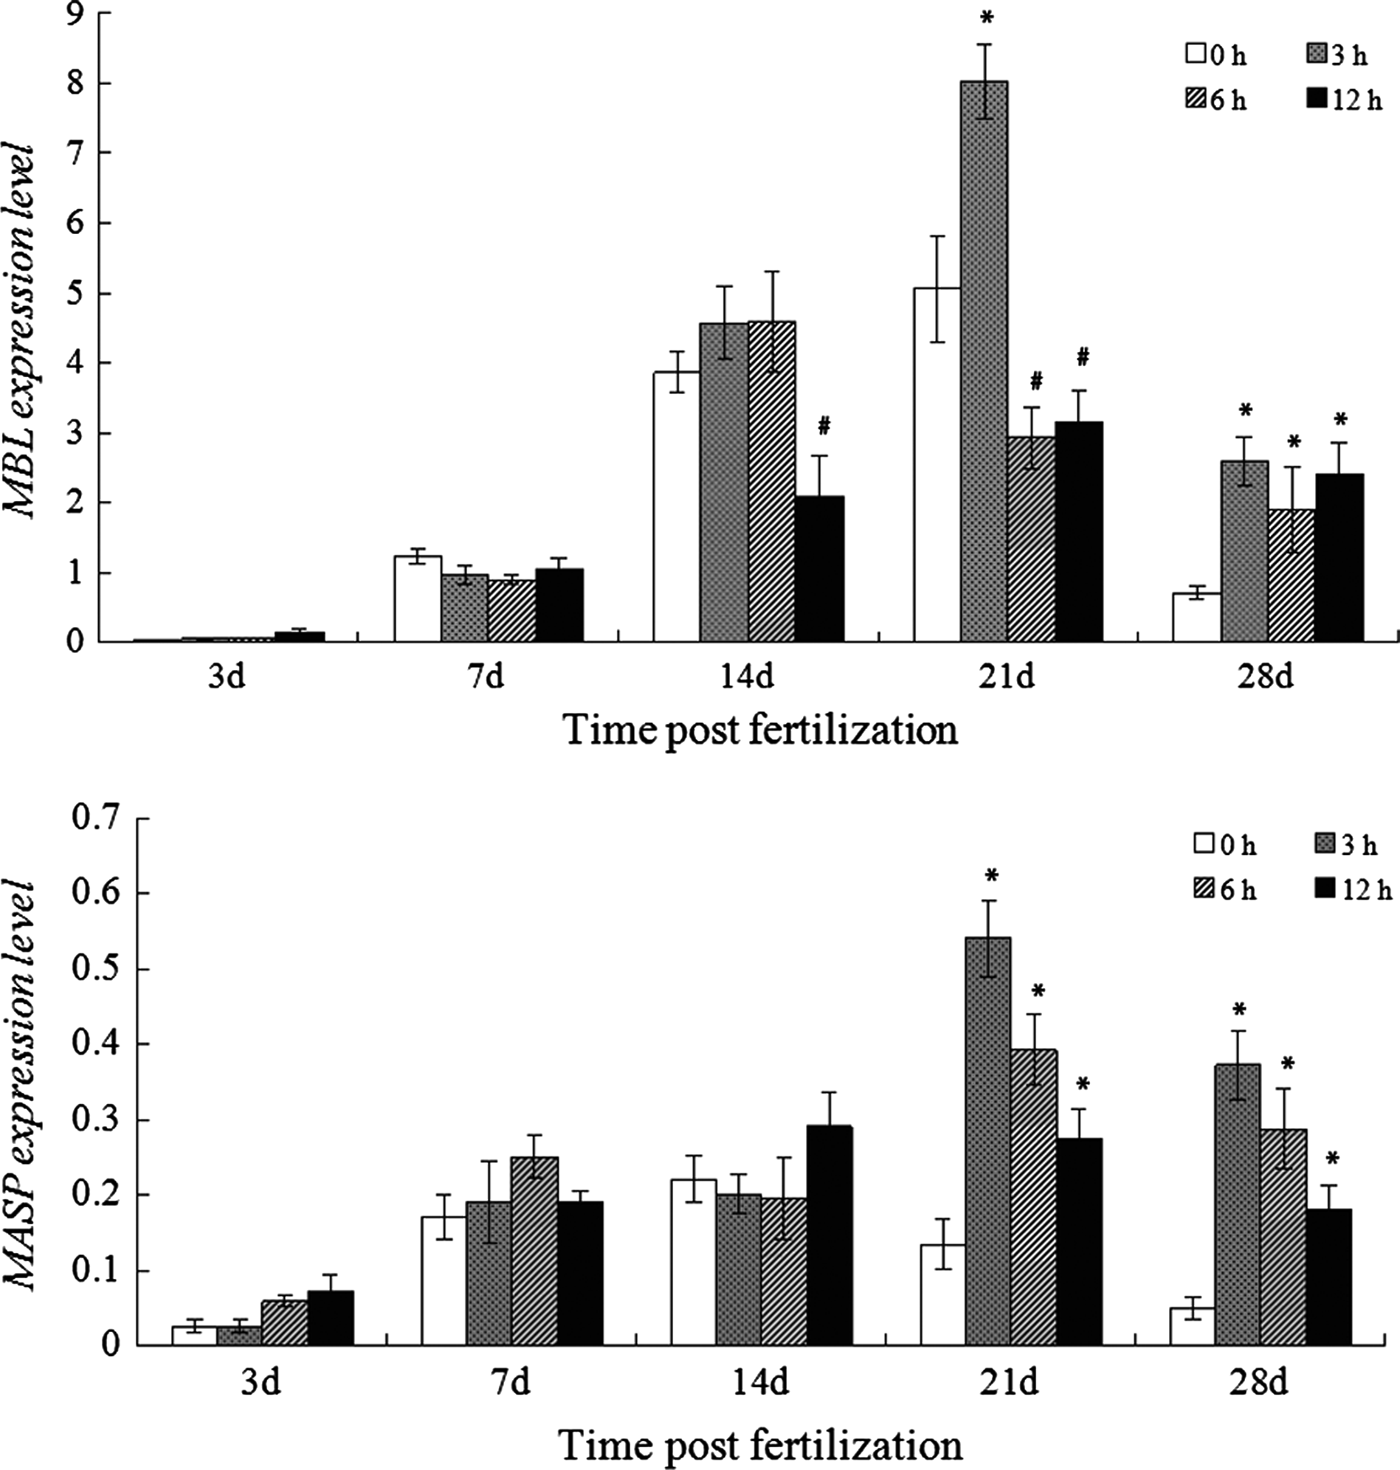
In the normal larvae, MBL and MASP expression increased steadily and peaked (5.060 and 0.191, respectively) at 21 and 14 dpf, respectively, that were both followed by a decline till the end of study period (Figure 5A, B). No obvious change of MBL and MASP expression was caused by LPS challenge in the larvae before 14 dpf, except that a significant decrease of MBL expression was seen at 12 hpc in the larvae at 14 dpf. When the larvae at 21 dpf was challenged with LPS, MBL expression elevated to 8.028-fold at 3 hpc and then rapidly reduced to below the control at 6 hpc and maintained at the low level at 12 hpc. In the LPS challenged larvae at 28 dpf, MBL expression significantly up-regulated (2.594-fold) since 3 hpc and kept at higher levels until 12 hpc (Figure 5A). The MASP expression in the larvae at 21 and 28 dpf showed similar changes after LPS challenge, it fastly increased to the peak at 3 hpc and a decline followed although it still maintained at higher levels compared to that in the control (Figure 5B).

Fig. 5. Expression of MBL (A) and MASP (B) in the normal and LPS-challenged larvae. * or # means the gene expression was significantly up-regulated or down-regulated after challenge.
Expression of C6 and its response to LPS challenge in developing larvae
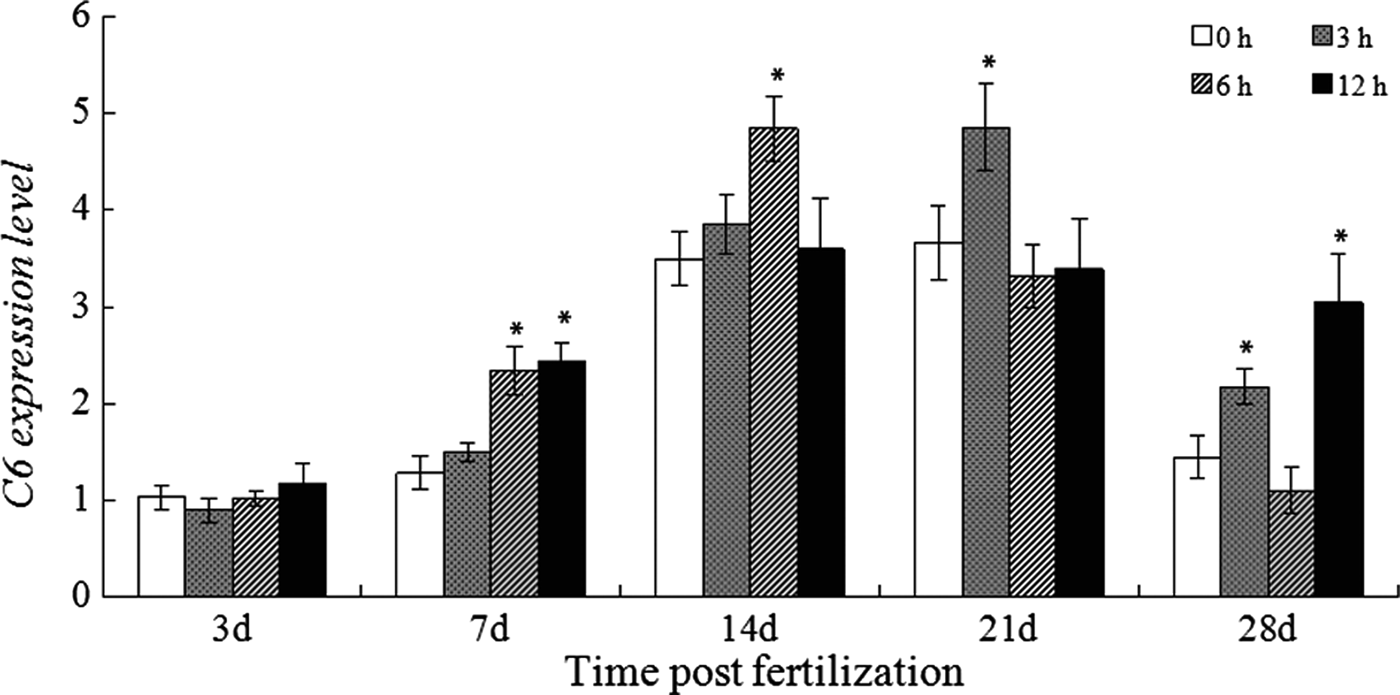
In the control larvae, C6 expression gradually increased up to 21 dpf, reaching the peak of 3.668-fold, and subsequently dropped to 1.448-fold on 28 dpf (Figure 6). After LPS challenge, the expression of C6 in the larvae at 7 dpf started increasing at 6 hpc and remained at the high level at 12 hpc. For the larvae at 14 and 21 dpf, it only increased at 6 and 3 hpc, respectively. It up-regulated from 3 hpc and peaked at 12 hpc in the larvae at 28 dpf.

Fig. 6. Expression of C6 in the normal and LPS-challenged larvae. *, means the gene expression was significantly up-regulated after challenge.
DISCUSSION
Fish depends on innate immunity, including the complement system, much more than higher vertebrates. Here, we studied the expression of key complement genes in the adult Danio rerio and larvae from hatching to 28 dpf and their response to short-term LPS challenge. Similar to the finding of Wang et al. (Reference Wang, Zhang and Wang2008a), the expression of C1r/s, C4 and MASP all increased after hatching and subsequently declined (Figures 4 & 5B), and Bf expression showed fluctuation during the experimental period (Figure 3). It was once demonstrated that the expression of C3, MBL and C6 steadily increased from hatching to 24 dpf (Wang et al., Reference Wang, Zhang and Wang2008a), while an obvious drop was detected on 28 dpf in this work (Figures 2, 5A & 6), which might be caused by the difference of sampling time. Moreover, as is shown in the adult fish (Figure 1), Bf (involved in AP) is expressed at much higher levels than C1r/s (involved in CP), MASP (involved in LP) and C4 (involved in both CP and LP) in the larvae at any development stages, which is also analogous to our earlier finding (Wang et al., Reference Wang, Zhang and Wang2008a) and the observation in rainbow trout (Løvoll et al., Reference Løvoll, Kilvik, Boshra, Bogwald, Sunyer and Dalmo2006). The relatively high expression of MBL in adult fish and the larvae from 7 to 28 dpf might be related to some other function than activating the complement system, such as agglutinating activity. Thus AP may be more significant than CP and LP during the development of D. rerio. This was further supported by the finding that the cytosol prepared from the eggs at 2 hpf showed higher AP activity than CP and LP activity during the antibacterial process (Wang et al., Reference Wang, Zhang, Wang and An2008b). However, the C1r/s expression levels were significantly lower than we once demonstrated (Wang et al., Reference Wang, Zhang and Wang2008a), and a possible reason for this difference could be that the fish used in the two studies have different genetic backgrounds which induced a different contribution of complement pathway to the immunity or other physiological function.
In the LPS-challenged adult fish, the expression of most tested complement genes showed up-regulation only at 12 h, while the marker genes of adaptive immune system (Rag 2, AID, TCRAC, IgLC-1, mIg, sIg, IgZ and DAB) showed increased expression shortly after LPS challenge (at 3 h) (Li et al., Reference Li, Zhang, Wang and Li2011). The different response to LPS challenge might be caused by the difference of gene function, treatment dose and the age of fish.
Among the seven complement genes tested, the expression of Bf (representing the AP), C3 and C6 (participating in all the complement pathways) responded to LPS challenge at earlier developing stages than the others. Both Bf and C3 expression down-regulated on 7 dpf and their up-regulation as that of adult fish was detected in the following development stages, while C6 expression started up-regulating in the larvae from 7 dpf. In contrast, the other selected components of complement system responded to LPS challenge by up-regulating their expression levels at later development stages. C1r/s expression began up-regulating from 14 dpf onwards, C4, MBL and MASP from 21 dpf. (The significant increase of C4 in the larvae at 7 dpf was not considered because no obvious change of its expression was observed in the larvae at 14 dpf.) These findings supported the notion that AP developed faster than CP and LP, and the complement operating via AP was already competent in the early-stage larvae of zebrafish (Wang et al., Reference Wang, Zhang and Wang2008a). It was once shown that the adaptive system is not fully functional in the first three weeks of zebrafish life because no T-cells are detectable in the periphery (Trede et al., Reference Trede, Langenau, Trave, Look and Zon2004) and only a few Rag-positive cells are present in the pronephros (Zapata et al., Reference Zapata, Diez, Cejalvo, Frías and Cortés2006), which further supported our finding that the adaptive immunity-related complement pathway, CP, develops at late development stages. As lower vertebrates, fish are more dependent on innate immunity, thus it is possible that complement system develops early and plays a key role in protecting the early larvae, which is additionally supported by the fact that a recognizable and vascularized liver, the primary organ for the production of complement components such as Bf and C3, has been established in D. rerio by the time of hatching (Ober et al., Reference Ober, Field and Stainier2003).
Moreover, the expression of Bf, C3 and C6 peaked at 3 or 6 hpc in the larvae at early stages, while their maximum expression appeared at 12 hpc in the larvae at 28 dpf, in a similar fashion to that of the adult fish. However, the highest expression levels of C1r/s, MBL and MASP emerged at 6, 3 and 3 hpc, respectively, in the larvae at 28 dpf, which is different to that in the adult fish (all peaked at 12 hpc), suggesting that the AP might be fully developed while the CP and LP is still developing in the first four weeks of zebrafish life.
In summary, the complement system is competent from 2 hpf, and it plays an important protective role in the developing zebrafish larvae. Among the three pathways, AP develops earlier and might be more significant than CP and LP; it showed the ability to effectively respond to LPS challenge from 14 dpf and might mature before 28 dpf.
FINANCIAL SUPPORT
This work was supported by the Natural Science Foundation of China (grant number 31000410) and the grants of Weinan Normal University (grant number 11ykz006).


