


I. Introduction
Many restaurants offer extensive lists of wines in bottles while offering only limited selections of wines by the glass. Upscale restaurants use wine lists, notably extensive ones, as differentiation strategies (Berenguer, Gil, and Ruiz, Reference Berenguer, Gil and Ruiz2009). Because the demands for bottles and glasses are interdependent when setting bottle prices and therefore margins and markups of particular wines, restaurants should account for whether they offer these wines by the glass. We examine the effect of the by-the-glass offering of a wine on its bottle margin and markup.
Offering a particular wine by the glass is an important factor in restaurant wine purchase decisions. For example, Durham, Pardoe, and Vega-H (Reference Durham, Pardoe and Vega-H2004), in an analysis of wine attributes and other factors that affect restaurant wine sales, find that offering wine by the glass is an important determinant of some wine sales. By implication, whether a restaurant offers wine by the glass could influence the restaurant's bottle prices.Footnote 1
Existing studies of price-quantity menus examine the relationship between the price, markup, and quantity of a particular product (see Leslie, Reference Leslie2004; McManus, Reference McManus2007).Footnote 2 Our focus is different; for the prices, margins, and markups of wines, we investigate the relationship between whether a restaurant offers the same wine by the glass and the margin (and markup) of the bottle. In order to make our analysis tractable, we consider the least expensive bottles of four major varietals commonly offered for sale by restaurants. Building on the second-degree price discrimination literature (Mussa and Rosen, Reference Mussa and Rosen1978; Maskin and Riley, Reference Maskin and Riley1984), Anderson and Dana (Reference Anderson and Dana2009) demonstrate that the effect on the price (or margin) of a high-quantity package of introducing a low-quantity package is ambiguous.Footnote 3 Our goal is to resolve this ambiguity for wine bottle margins and markups in the restaurant industry.
Consider two possible package sizes that a firm could offer to consumers. In the case of wines offered by restaurants, they could offer a particular wine by the bottle and by the glass. In the decision of whether to offer a particular wine only in bottles or in bottles and by the glass, a restaurant has three basic bottle pricing options. First, offer the wine in bottles and by the glass. Set the bottle and glass prices so that consumers who have a low willingness to pay for bottles select the wine by the glass and consumers who have a high willingness to pay for bottles select bottles. Second, offer the wine only in bottles and set a high price to attract only high willingness-to-pay consumers. Third, offer the wine only in bottles and set a low price to attract low and high willingness-to-pay consumers.
In the Anderson and Dana (Reference Anderson and Dana2009) model, the price in the first option in which the restaurant offers the wine by the bottle and by the glass is in between the two possible prices in the second and third options in which the restaurant offers the wine only in bottles. Specifically, if the restaurant offers wine in only bottles and sells to only high willingness-to-pay consumers because it does not offer these consumers the option to select the wine by the glass, it sets a high price. If the restaurant offers a wine only by the bottle and sells to high and low willingness-to-pay consumers, it sets a low price. If the restaurant offers wine by the bottle and sells to high willingness-to-pay consumers, it sets the bottle price to attract high willingness-to-pay consumers, but if these consumers have the option to select the wine by the glass, the restaurant sets the bottle price in an intermediate region.
We demonstrate in a simplified version of the Anderson and Dana (Reference Anderson and Dana2009) model, which we present in Section II, that which of the three options and the associated bottle price (and therefore margin and markup) is best for a restaurant depends in part on the proportion of the restaurant's patrons who have a low willingness to pay for bottles and the level of their willingness to pay. The optimal price, margin, and markup have two cutoff lines involving this proportion and willingness to pay—a higher one and a lower one. Above the higher cutoff line, the restaurant offers the wine only by the bottle and sets a low price to attract low and high willingness-to-pay consumers. Below the lower cutoff line, the restaurant offers the wine only by the bottle and sets a high price to attract only high willingness-to-pay consumers. In between the two cutoff lines, the restaurant sets a bottle price in between the high and low prices. Therefore, whether a restaurant sets higher or lower bottle prices for wines that it offers by the glass, compared to wines that it does not, is ambiguous.
Restaurants determine not only bottle prices and therefore margins and markups, but also the wines that they choose to offer by the glass. With an array of wines, a restaurant's decision about which wines to offer by the glass depends in part on the cost of the wines. In our analysis of wine bottle prices, margins, and markups, we account for the relationship between the wholesale price (which we use as a proxy for wine cost) of the least costly bottle of a major varietal on a restaurant's menu and whether the restaurant offers the wine by the glass.
Draganska and Jain (Reference Draganska and Jain2006) analyze product line pricing using yogurt pricing and sales data. In the yogurt market, a producer's products can be differentiated vertically by quality and horizontally by flavors. Just as we analyze wine bottle margins, markups, and pricing, controlling for quality, Draganska and Jain (Reference Draganska and Jain2006) using yogurt data examine retail prices, controlling for quality, and analyze pricing across flavors. However, one fundamental difference between restaurant wine pricing and grocery store yogurt pricing is that the cost to grocery stores across flavors of a producer's yogurt is constant, whereas the cost to restaurants across wines of a particular varietal is not. Furthermore, for all but the basic plain and vanilla yogurt, producers offer flavors in only single-serving packages. With regard to restaurant wine quantity offerings, the opposite is true; restaurants offer more “flavor” varieties in large-quantity packages—bottles.
Our data include New York City restaurant wine bottle and by-the-glass offerings and prices posted in their online menus and a supplemental wine dataset of quality measures and wholesale wine prices. Using price variation across wines offered by the same restaurant, we find that restaurants are more likely to list wines by the glass when they acquire bottles at lower prices. Restaurants also set higher bottle prices, margins, and markups for wines when concurrently selling these wines by the glass.
II. Theoretical Model
We present a simplified version of the Anderson and Dana (Reference Anderson and Dana2009) model to highlight our point that the bottle price of wine when a restaurant offers the wine by the glass could be in between potentially optimal bottle prices when the wine is not offered by the glass. In our model, which informs our empirical analysis, consumers consider only one wine at a monopoly restaurant.
The market for a particular wine at a restaurant has two types of consumers: high value (H) and low value (L). The market has n i type-i consumers, with n H + n L = 1. Each type-i consumer has a willingness to pay for a bottle of $v_B^i$ and a willingness to pay for a glass of $v_G^i$
 . We assume that a high-value consumer has a higher willingness to pay than a low-value consumer for a bottle ($v_B^H > v_B^L$
 ) and a glass ($v_G^H > v_G^L$
 ), and a higher marginal value of changing from a glass to a bottle ($v_B^H -v_G^H > v_B^L -v_G^L$
 ). Each consumer chooses either one bottle, one glass, or neither.
In this setting, the restaurant has three potentially optimal selling strategies: sell only bottles to only high types, sell only bottles to both types, and sell bottles to high types and glasses to low types. The restaurant's optimal price, conditional on its sales strategy, is:

From our assumptions about consumer values, we have that the restaurant's optimal bottle price if it offers the wine by the glass, $p_B = v_B^H -( v_G^H -v_G^L )$ , is in between the two potentially optimal bottle prices if it does not offer the wine by the glass, $p_B = v_B^H$
 or $p_B = v_B^L$
 . That is, $v_B^H > v_B^H -( v_G^H -v_G^L ) > v_B^L$
 . Therefore, whether the restaurant's bottle price if it offers the wine by the glass is higher or lower than its bottle price if it does not depends on whether it optimally sets $p_B = v_B^H$
 or $p_B = v_B^L$
 . The restaurant's profit from selling only bottles is

where c B is the restaurant's cost of the bottle (i.e., the wholesale price of the bottle). Therefore, if the restaurant introduces the wine by the glass, it raises the price of bottles from $p_B = v_B^L$ to $p_B = v_B^H -( v_G^H -v_G^L )$
 if and only if the proportion of high-type consumers in the market is sufficiently small, ${{( {v_B^L -c_B} ) } \over {( {v_B^H -c_B} ) }} > n^H$
 . In this case, if the restaurant does not offer the wine by the glass, then it sets a low bottle price to attract high and low types.
In Appendix A.1, we describe an alternative explanation involving anchoring from the behavioral economics literature for the pricing practice we identify in our empirical model.
III. Data
We draw our estimation sample from 2,961 New York City (NYC) restaurants listed in the 2015 Zagat review. We focus our analysis on a single city to ensure that the restaurants in our sample operate in a similar competitive environment. We then limit the sample to restaurants serving six common cuisines that Zagat designates as providing a good wine tasting experience.Footnote 4 After removing another 349 restaurants that do not post their wine menus online or serve common varietals, we are left with a final sample of 375 restaurants.Footnote 5
From each restaurant's online wine menu, we manually record the producer, vineyard designation, year, and bottle price of the least-expensive wines for each of two common white varietals (chardonnay, sauvignon blanc) and two common red varietals (cabernet sauvignon, pinot noir) (if any). We focus our analysis on the least-expensive wines of each varietal because they are popular among consumers.Footnote 6 Additionally, restricting the sample to the least-expensive bottles may reduce the influence of unobserved heterogeneity in profit potential since there is anecdotal evidence that restaurants tend to markup the least expensive wines the most (Roberts, Reference Roberts2010).Footnote 7 Counting each bottle price as a single observation, our final sample includes 1,372 bottle prices among the 375 restaurants.
The New York State Liquor Authority (NYSLA) mandates wholesale price posting for wines and liquor, which we use in our analysis (as measured in January 2016).Footnote 8 Our use of Wine Spectator ratings as a measure of wine quality follows Landon and Smith (Reference Landon and Smith1998). We include these ratings in our analysis of wine pricing because wine experts’ grades affect the prices set by wine producers (Dubois and Nauges, Reference Dubois and Nauges2010; Coqueret, Reference Coqueret2015).
For our study of the effect of restaurants offering wines by the glass on their bottle pricing, our primary focus is on bottle margins (i.e., the differences between restaurant bottle prices and wholesale prices), which from our simple model of restaurant bottle pricing are key in restaurant bottle pricing decisions. As a robustness check, we also examine bottle retail and wholesale markups as dependent variables.
Finally, from the online wine menus of the restaurants in our sample, we record whether the wine is offered by the glass for the least-expensive wine of each varietal offered in bottles.Footnote 9 For example, a French restaurant Le Relais de Venise New York offered in April 2015 a pinot noir bottle for $48.00 and a cabernet sauvignon bottle for $28.95 (Figure 1). The latter was listed as available by the glass on its online wine menu, while the former was not. Overall, 968 of the 1,372 bottles in our sample have the same wine sold by the glass.
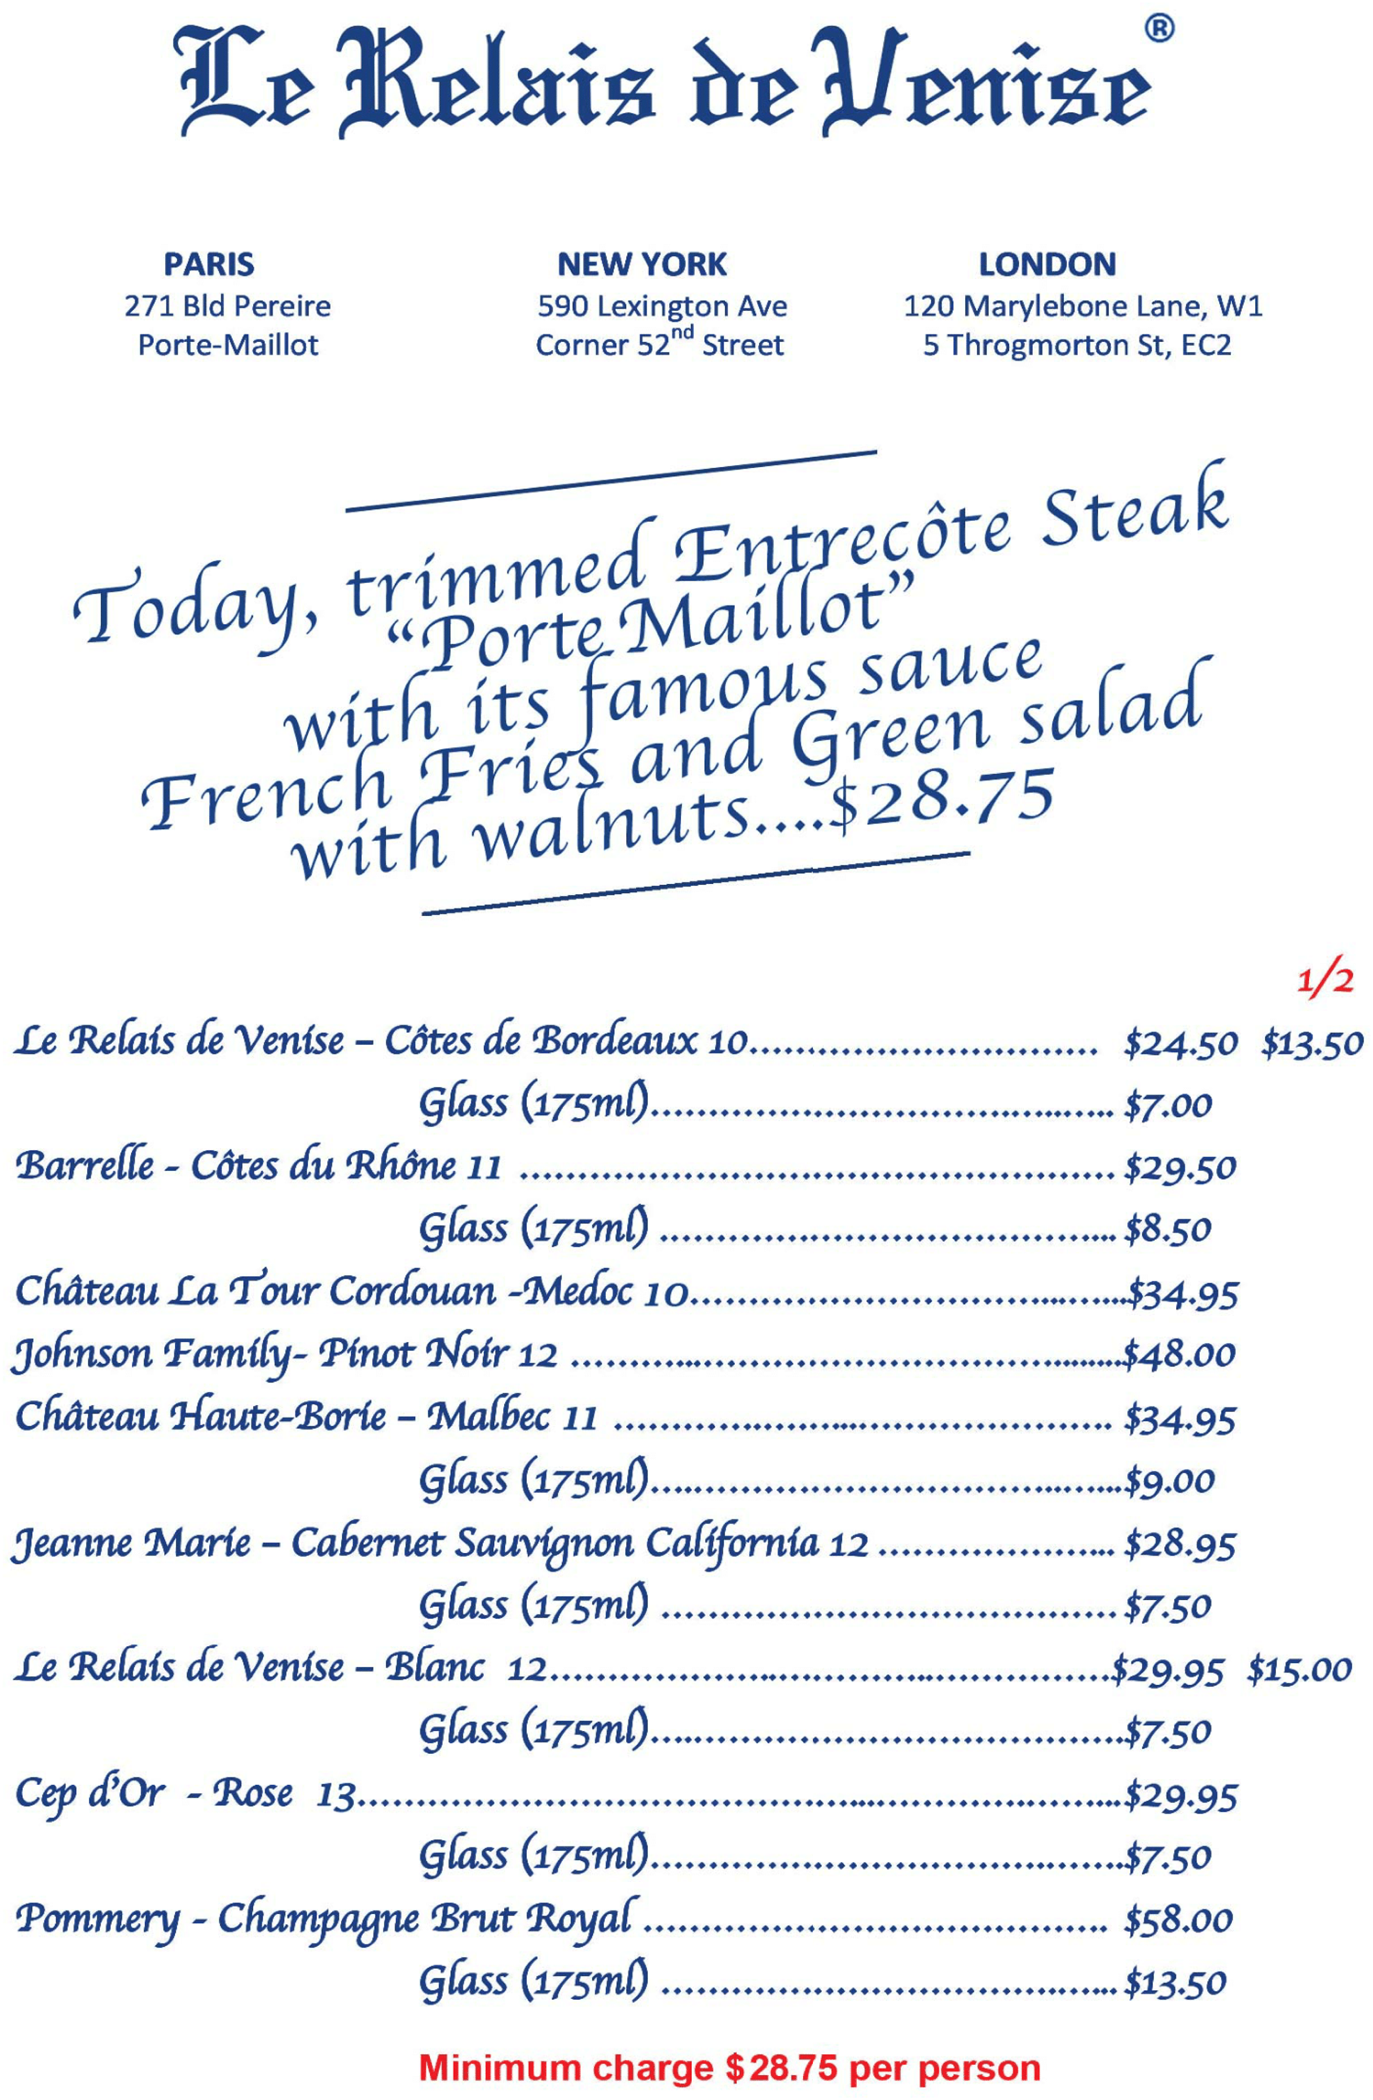
Figure 1 2015 Wine Menu of Le Relais de Venise New York
IV. Methods
We start by examining the relationship between offering wine by the glass and its wholesale price. To account for unobserved characteristics of restaurants that could affect both the probability of offering wine by the glass and its bottle cost, we estimate the following fixed effects, linear probability model:

where Glass ij is an indicator variable coded one if restaurant j offers wine i by the glass and zero otherwise; Wholesale ij is the wholesale bottle price for the wine; X ij is a vector that includes the Wine Spectator rating and indicator variables for varietal; δ j is a restaurant fixed effect that captures restaurant-specific unobservable factors, such as quality, location, and wholesale supply network; and ɛij is an error term. The inclusion of restaurant fixed effects ensures that the parameters are identified using variation across varietals offered by the same restaurant.
We next examine the correlation among restaurant bottle price, wholesale cost, and whether the wine is offered by the glass. Because bottle prices are right-skewed, we use a log-linear regression with restaurant fixed effects, specified as:

We retransform the marginal effects in Equation (2) from the log scale back to the dollar scale using Duan's (Reference Duan1983) nonparametric smearing estimator. Last, we estimate the following regression with the log of restaurant bottle margin as the dependent variable:

We estimate Equations (1)–(3) separately and cluster the standard errors in all regressions at the restaurant level. Estimates from the margin Equation (3) should be less subject to endogeneity problems than the price Equation (2), given that the latter includes the wholesale price, which is an endogenous variable, as a covariate.
V. Results
Table 1 contains descriptive statistics for all analysis variables. Each of the four lowest-priced wines in our sample comprises approximately one-quarter of observations, and collectively, 71% of the wines are offered by the glass. The mean restaurant bottle price is $57.74, and the wholesale price is $14.87, resulting in an average bottle margin of $42.88.
Table 1 Descriptive Statistics of Analysis Variables

Notes: Observations are the wine level. Our regression analysis uses cabernet sauvignon as the omitted category for varietal controls.
Sources: Zagat Survey, New York State Liquor Authority, and wine-searcher.com.
In Table 2, we conduct t-tests and compare the wine score and bottle price measures for wines listed online by the glass and those only listed as bottles. Wines offered in bottles and by the glass have a lower average wine score, but the difference in scores is small and not economically meaningful. Likewise, the difference in restaurant bottle prices between wines offered by the glass and those offered only in bottles is small and not statistically significant. In contrast, the wholesale bottle price is $4.49 lower if the wine is offered by the glass, leading to a margin that is $3.36 higher than for wines that are sold only by the bottle.
Table 2 Comparison of Wine Score and Price Measures between Wines Offered by the Glass and Those Offered Only by the Bottle

Notes: In Columns (1) and (2), we report summary statistics of the main variables of interest, separately for wines offered by the glass and those only listed as bottles. Standard deviations are reported in square brackets. Column (3) tests for equality of means between the two groups. Standard errors of the mean differences are in parentheses and adjusted for clustering at the restaurant level. Asterisks (*,**,***) indicate statistical significance at the 0.1, 0.05, and 0.01 level, respectively.
Table 3 contains the marginal effect estimates for key variables in regression models (1)–(3). As expected, restaurants are less likely to offer the lowest-priced wine of a varietal by the glass when the wine has a higher wholesale bottle price. However, the estimated correlation is relatively small, suggesting that a $5 increase in the wholesale price, which is about one-third relative to the mean, is associated with only a 3.4% decrease in the probability of offering the wine by the glass. Marginal effect estimates from Equation (2) indicate that a $1 increase in the wholesale price is associated with a $1.23 increase in the restaurant bottle price. Holding the wholesale price and wine score constant, offering the wine by the glass is associated with an increase in the bottle price of $2.91, or 5.0%. Estimates of Equation (3) indicate that offering the wine by the glass is associated with a $4.94 increase in the bottle margin, or 12.2% relative to the sample mean. Overall, the descriptive analysis and regression estimates suggest that restaurants offer lower-cost wines by the glass but raise bottle price and margin compared to similar wines that are offered only by the bottle.
Table 3 Associations between Whether the Wine Is Offered by the Glass and Price Measures

Notes: This table reports the marginal effects obtained from separately estimating Equations (1)–(3). In Column (3), the restaurant margin is defined as the difference between restaurant and wholesale bottle prices. All models include restaurant fixed effects, and controls for wine score and varietal. Standard errors clustered by restaurant are reported in parentheses, and the estimated marginal effects in percentage terms are below the standard errors. Asterisks (*,**,***) indicate statistical significance at the 0.1, 0.05, and 0.01 level, respectively.
We conduct several robustness checks of our main findings, which are more fully described in Appendices A.2–A.3. First, we use restaurant rating information provided by Zagat to present suggestive evidence that upscale restaurants with higher-rated décor are more likely to offer wines by the glass (Table A1). We then estimate a log-linear restaurant price regression without restaurant fixed effects while controlling for Zagat restaurant attribute ratings for food, décor, service, and other restaurant characteristics. The marginal effect estimate of the by-the-glass indicator is more than twice as large as the estimate from the restaurant fixed effects model (Appendix A.1 and Table A2, Columns (1) and (2)). We also use the propensity score weighting to adjust for restaurant differences and find a similar result as the ordinary least squares (OLS) estimates (see Column (3) of Table A2). These results provide support for the inclusion of restaurant fixed effects as a strategy to mitigate the confounding influences of unobserved restaurant quality and locational amenities.
Second, we assess the potential for selection bias to affect our qualitative conclusions about the relationship between offering wine by the glass and restaurant bottle price using the approach proposed by Altonji, Elder, and Taber (Reference Altonji, Elder and Taber2005) and Oster (Reference Oster2019). Through this analysis, we find that the level of selection on unobservables in our restaurant fixed effects model would need to be 1.26 times as much as the level of selection on observables to nullify the estimated relationship between offering wine by the glass and bottle price (see Appendix A.3 and Table A2 Column (4)). Oster (Reference Oster2019) suggests equal selection (a factor of 1) as a reasonable upper bound on the relative degree of selection on unobservables. Given that the predictive power of our model is relatively high (R-squared = 0.50), we believe it is unlikely that selection bias affects our qualitative conclusion that offering wine by the glass is associated with a higher restaurant bottle price.
Last, we re-estimate Equation (3) using the retail markup and the wholesale markup as dependent variables. Following Back et al. (Reference Back, Liu, Niklas, Storchmann and Vink2019), we define the retail markup as (restaurant price – wholesale price)/restaurant price. We define the term wholesale markup as (restaurant price – wholesale price)/wholesale price. In Table 4, we report marginal effect estimates for the markup equations side-by-side with the margin equation from Table 3. The association between offering the wine by the glass and the dependent variable is similar, in percentage terms, across all three equations. In particular, offering the wine by the glass is associated with a 14.4% increase in the retail bottle markup and a 14.0% increase in the wholesale bottle markup. These estimates are slightly larger than the 12.2% increase in the bottle margin associated with offering the wine by the glass.
Table 4 Comparison of Associations between Whether the Wine Is Offered by the Glass and Margin to Associations with Retail and Wholesale Markup

Notes: This table reports the marginal effect from Equations (3) in Column (1) and marginal effects from the re-estimation of Equation (3) using retail and wholesale markup in Columns (2) and (3), respectively. The margin is defined as the difference between restaurant and wholesale bottle prices, the retail markup is the ratio of restaurant margin over restaurant price, and the wholesale markup is the ratio of restaurant margin over wholesale price. All models include restaurant fixed effects and the controls for wine score and varietal. Standard errors clustered by restaurant are reported in parentheses, and the estimated marginal effects in percentage terms are below the standard errors. Asterisks (*,**,***) indicate statistical significance at the 0.1, 0.05, and 0.01 level, respectively.
VI. Discussion
Our results suggest that restaurant bottle margins, prices, and markups for wines offered by the glass are higher than for wines that are not offered by the glass. Our results also suggest that the wholesale price is a factor in restaurants selecting the product versions that they offer to consumers. If restaurants offer limited numbers of wines by the glass, then a restaurant's costs of acquiring wines affect its decision about the wines it offers by the glass. However, the relatively small estimated correlation between whether a restaurant offers wine by the glass and its wholesale price suggests that other factors are more important to the restaurant's wine versioning decision.
Our study is subject to several limitations. Given the cross-sectional and limited nature of our data, we interpret our results as conditional correlations rather than causal effects and acknowledge that the results may not generalize to other geographic areas. In addition, our model does not include an analysis of consumer choices among wines. However, our analysis does permit some important aspects of consumer choice involving wines by the glass. Specifically, while our model is agnostic about the source of consumer value of wines by the glass, it permits consumers to have higher glass values due to the reduction in consumer risk associated with choosing an undesirable wine when wines are offered by the glass, and permits the preference for variety seeking by individuals and dining partners (Acuti et al., Reference Acuti, Mazzoli, Grazzini and Rinaldi2020).
In our analysis of bottle margins, we focus on how the cost of bottled wine drives the restaurant's decision to offer wine by the glass. However, this decision depends on other important factors as well. The literature on product versioning addresses the question of which versions of a product should firms offer. Important topics in the product versioning literature include scenarios in which the firm might have better information about consumer preferences than do consumers themselves (Xu and Dukes, Reference Xu and Dukes2019), situations where consumers have the option to purchase multiple versions of a good (Bhargava and Choudhary, Reference Bhargava and Choudhary2008; Calzada and Valletti, Reference Calzada and Valletti2012), or experience consumption externalities (August, Dao, and Shin, Reference August, Dao and Shin2015; Rao Reference Rao2015), and situations where firms set prices of products according to their attributes such as the time and day products are consumed (Gu and Yang, Reference Gu and Yang2010; Ho et al., Reference Ho, Liang, Weinberg and Yan2018) or limit the set of products to simplify the consumer choice set (Kuksov and Villas-Boas, Reference Kuksov and Villas-Boas2010). Each of these investigations could apply to wine offerings at restaurants. For example, waiters and sommeliers frequently have better information than do restaurant patrons about their wine preferences, diners at a table sometimes select a mix of wines in bottles and by the glass, the restaurant experience and wait time often involve consumption externalities, and restaurants frequently price wine according to the day of the week and time of day. Additionally, restaurants might offer limited selections of wines by the glass not only for cost reasons but also to limit the choice set of wine novices (who tend to order wines by the glass). We leave the investigation of these possible mechanisms for a restaurant's decision of whether to offer wines by the glass as future research.
Despite these limitations, we offer evidence of the Anderson and Dana (Reference Anderson and Dana2009) scenario in which a firm, in our case a restaurant, following the introduction of a low-quantity option, increases the margin of its high-quantity package. Put differently, to emphasize this apparent counter-intuitive pricing practice, when introducing a substitute product—wine by the glass—restaurants tend to increase the margin on the original product—wine by the bottle. The apparent explanation for this pricing practice is that when offering wines in bottles only, restaurants set low margins to attract low willingness-to-pay consumers. When offering wines by the glass, low willingness-to-pay consumers select this option, leaving high willingness-to-pay consumers to select bottles. Accordingly, restaurants raise bottle margins and markups.
Appendix
A.1 Anchoring in Restaurant Wine Pricing
The Tversky and Kahneman (Reference Tversky and Kahneman1974) conceptualization of an external anchor in a behavioral model provides a different explanation from the second-degree price discrimination models for the pricing practice that we uncover empirically, namely that restaurants set higher bottle prices for the wines that they offer by the glass. Considering anchoring, consumers might use the bottle price of wine to anchor their estimates of their values of the wine by the glass. Specifically, consumers use the bottle price as a starting point in their estimate of the value of the wine by the glass and then adjust up or down, with the starting point affecting the final estimate. If a restaurant uses a wine's bottle price to anchor consumer values of the wine by the glass, then the restaurant raises the bottle prices of the wines it offers by the glass. In a laboratory experiment, Krishna et al. (Reference Krishna, Wagner, Yoon and Adaval2006) offer evidence that consumer knowledge of an extreme-priced related product affects consumer reservation prices of a product.
Note that if restaurants practice anchoring that the bottle price per ounce might be the same as, or possibly even higher than, the glass price per ounce, and consumers might not purchase the wine in bottles. In contrast, if restaurants practice second-degree price discrimination, then the bottle price per ounce is less than the glass price per ounce, and high-value consumers select the wine in bottles.
A.2 Influence of Unobserved Restaurant Characteristics on Estimates
In this section, we compare the measurable characteristics of restaurants in our estimation sample that post wines by the glass and by the bottle to those that post wines only by the bottle. Our analysis makes use of the restaurant-quality ratings contained in the Zagat database. Based on unsolicited consumer reviews, Zagat constructs scores for food, décor, and service quality that are normalized to between 0 and 30.Footnote 10 Zagat also maps these scores into the following qualitative groups: 0–10 was “poor to fair”; 11–15 “fair to good”; 16–20 “good to very good”; 21–25 “very good to excellent”; and 26–30 “extraordinary to perfection.” To these data, we also add the number of bottled wines listed on each restaurant's online wine menu.
In Table A1, we compare the differences in the Zagat quality measures and the number of wines at restaurants that post at least one wine by the glass to restaurants that only post information about wines in bottles. There are statistically significant differences between the food and décor scores of the two sets of restaurants. Restaurants that post wines only by the bottle have a slightly higher food score, and restaurants that post wines by the glass have a higher décor score. The magnitude of the latter difference is higher than the former. These comparisons provide suggestive evidence that restaurants more upscale in appearance are more likely to post wines by the glass.
Table A1 Comparison of Characteristics between Restaurants with Wines Offered By-the-Glass and Those Offering Only Bottles

In order to gain insight into the potential for unobserved restaurant characteristics to bias our estimates, we re-estimate Equation (2) without restaurant fixed effects and with several observable restaurant-specific characteristics. These characteristics include the three Zagat restaurant-quality ratings, the log of the number of bottled wines, indicator variables for the ethnic cuisine, and indicator variables for the NYC neighborhood where the restaurant is located. The estimated marginal effect of the by-the-glass indicator from the OLS model with observable restaurant characteristics is more than twice as large as the marginal effect from the model with restaurant fixed effects (see Columns (1) and (2) of Table A2). Moreover, in Column (3) of Table A2, we apply propensity score matching (PSM). The OLS estimates are relatively unaffected by the propensity score weighting. This finding is not surprising given the small number of covariates. And the OLS and PSM results suggest that the restaurant fixed effects model reduces the confounding influences of unobserved restaurant quality and locational amenities on the estimates.
Table A2 Robustness Tests of the Bottle Price Equation

A.3 Assessment of Selection on Unobservables
One important concern is that unobservable factors that are not constant within restaurants may bias our estimates. To infer whether selection into posting wine by the glass might affect our qualitative conclusions, we conduct a sensitivity analysis using the approach proposed by Oster (Reference Oster2019) and based on the seminal work from Altonji, Elder, and Taber (Reference Altonji, Elder and Taber2005). This method allows us to estimate how large the degree of selection on unobservable factors relative to the observables must be in order to drive the marginal effect of the by-the-glass variable to a statistical null.
The results of the analysis in Table A2 Column (4) indicate that the level of selection on unobservables would need to be approximately 1.26 times as much as the degree of selection on the observable covariates for the true effect of the by-the-glass variable to be statistically undistinguished from zero in Equation (2). This seems implausible, particularly given the power of the covariates in explaining the outcome variable (R-squared = 0.50). Furthermore, Oster (Reference Oster2019) suggests that equal selection (i.e., 100%) is an upper bound for the expected relative degree of selection on unobserved variables. Overall, this exercise supports our qualitative conclusion that posting a wine by the glass is associated with a higher restaurant bottle price, but it does not provide insight into whether the restaurant fixed effects model accurately measures the magnitude of that correlation.


