NOMENCLATURE
Acronyms
- TADF
turbine accelerated deposition facility
- TuRFR
turbine reacting flow rig
- URANS
unsteady Reynolds-averaged Navier–Stokes
- DPM
discrete phase model
- JBPS
Jim Bridger Power Station
- UDF
user-defined function
Symbols
- A cp
cross-sectional area of the particle
- a
radius of the contact surface
- C p
specific heat
- C D
drag coefficient
- C u
Cunningham correction factor
- d p
particle diameter
- E
composite Young’s modulus
- E p
particle Young’s modulus
- E s
surface Young’s modulus
- F D
drag force of the particle
- F L
fluid lift force acting on the particle
- F po
sticking force of the particle
- K n
Knudsen number
- k
thermal conductivity
- L c
characteristic length scale of the obstacle
- l inlet
stator inlet turbulence length scale
- m p
particle flow rate
- N inj
number of particles injected
- P s,outlet
rotor outlet static pressure
- P t,inlet
stator inlet total pressure
- Rep
Reynolds number of the particle
- T ave,inlet
stator inlet total temperature
- T s
surface temperature
- T g
free stream gas temperature
- Tu inlet
stator inlet turbulence intensity
- U c
characteristic velocity of the flow
- u c
fluid velocity at the centre of particle
- V cr
critical velocity
- W A
work of sticking for particles
- v p
particle Poisson ratio
- v s
surface Poisson ratio
- y+
non-dimensional wall distance
- α
distance from the centre of the sphere to the wall
 $\rho$p
particle density
- μ
dynamic viscosity of the fluid
- $\omega$
rotor rotational speed


1.0 INTRODUCTION
Aero-engines are facing severe challenges of particulate erosion and deposition during flight with prominent environmental problems. Although there is a low concentration of particulates in the atmosphere, the deposits in aero-engine components are considerable because of the large amount of air intake and fuel consumption during the entire service period. Ingested particles, such as volcanic ash, sand, dust, debris and impurities from fuel burning, have detrimental effects on the performance and the service life of turbine components, which can cause flight accidents. Particles accelerated and heated by the gas flow impact on the surfaces, leading to erosion of the blade and deposition on the surface. The change of the blade profile reduces the aerodynamic efficiency, resulting in the degradation of aero-engine performance. The increase of surface roughness enhances the heat transfer between high-temperature fluid and the blade surface(Reference Bons1). Meanwhile, particles deposited near the film cooling hole and in the internal cooling channel prevent the cooling air from removing the heat(Reference Dunn, Baran and Miatech2). Multiple factors cause the blades, especially rotating parts, to be easily ablated as they have a high rotational speed. It is very time consuming and expensive to clean the deposits and replace damaged blades during engine overhaul. Therefore, analysis of the migration and deposition of the particles in turbine for fundamental research of reducing or even removing the deposition is critical.
The most effective way to study the deposition of particles in aero-engines is to analyse full-scale aero-engines under actual conditions. Dunn et al.(Reference Dunn3) tested several military aero-engines with different concentrations of volcanic ash particles with governmental support and illustrated the engine damage mechanisms. Since full-scale engine testing was limited because of its high cost and long period and most experiments could only be carried out with military or corporate funding, there were few public reports in this regard. Laboratory facilities were thus utilised under the simulated conditions of aero-engines. The Turbine Accelerated Deposition Facility (TADF) designed by Jensen et al.(Reference Jensen, Squire, Bons and Fletcher4) accelerated the deposit speed under a high temperature, simulating the actual 1,000h deposition within 4h. The effects of gas temperature, metal temperature, particle size, impingement cooling, hole spacing and blow ratio were investigated in subsequent studies(Reference Crosby, Lewis, Bons, Ai and Fletcher5–Reference Laycock and Fletcher7). Smith et al.(Reference Smith, Barker, Clum and Bons8) developed the Turbine Reacting Flow Rig (TuRFR) to replace the round blade sample in the TADF with a turbine cascade and studied the impact of deposition on an actual turbine nozzle guide vane with film cooling. The effects of the property of particles, film cooling, hot streak and turbulence intensity were analysed through the TuRFR(Reference Webb, Casaday, Barker, Bons, Gledhill and Padture9–Reference Prenter, Whitaker, Ameri and Bons12). To simulate the large flow in the turbine cascade, materials with low melting point were selected as the particles under normal temperature conditions. Thole et al.(Reference Lawson and Thole14,Reference Lawson and Thole15) and Bogard et al.(Reference Albert and Bogard16) used a modelling method in a normal-temperature wind tunnel to carry out an experimental study on the effect of particle deposition on the cooling performance of turbine blades. Since laboratory facilities lacked actual aero-engine operating conditions and detailed information of particle trajectory, numerical simulation, an auxiliary research method referring to experimental measurements, was an attractive alternative for a more comprehensive analysis of the deposition issue. In the past decades, many deposition models have been put forward to simulate the behaviour of rebound, and the adhesion of particles after impacting on a wall. Brach and Dunn(Reference Brach and Dunn17) developed the critical velocity model assuming that particles will rebound if the normal impact velocity exceeds the critical velocity defined by composite Young’s modulus and particle size. Sreedharan and Tafti(Reference Sreedharan and Tafti18) used the critical viscosity model to predict the sticking probability based on the viscosity, which is determined by particles’ chemical properties and temperature. Singh and Tafti(Reference Singh and Tafti19) came up with an elasto-plastic model on the basis of the critical viscosity model and considered the elasto-plastic deformation of particles when they impacted on a wall. Bons et al.(Reference Bons, Prenter and Whitaker20) proposed the Ohio State University (OSU) model to simplify computation via replacing spherical particles with circular cylinder ones. Yang et al.(Reference Yang, Li and Cui21) introduced a criterion combining the critical velocity model with the critical viscosity model to adjust the deposition efficiency under different motions and temperatures of particles.
Since rare works in the published literature focus on the migration and deposition behaviours of particles within the turbine accounting for stator–rotor interaction, the objective of the present study is to obtain general laws of particle migration and deposition with different particle sizes and under various operating conditions, providing further understanding for subsequent research on the flow–heat coupling mechanism of particle contaminant and coolant injection. Ultimately, an optimised cooling design is likely to be proposed which is insensitive to deposition and can simultaneously inhibit the formation of particle deposition on the turbine aerofoils by injecting film coolant. Unsteady Reynolds-Averaged Navier–Stokes (URANS) simulations were conducted under two typical operating conditions, i.e. high temperature take-off and economic cruise, by characterising particles with a diameter of 1, 5, 10, 15 and 25 $\upmu$m, individually. Considering the interaction of fluid flow and particles, through analysing the trajectory of particles in the flow passage and the distribution of deposition on the blade surfaces, further insight into the mechanisms of migration and deposition in a turbine stage passage can be gained, which is expected to provide guidelines regarding the aero-thermal design of a high-pressure turbine that considers the detrimental effects of particle contaminants.
2.0 METHODS
2.1 Computational domain and flow solver
The computational model was constructed based on the first stage of high-pressure turbine in an aero-engine (Fig. 1). The actual number of stators and rotors was 40 and 68, respectively. For the sake of calculation, the stator was scaled down to 34/40 so that the ratio of stators and rotors was 0.5. The model was meshed into an unstructured grid with approximately 6.9 m elements in the stator zone and 11.2m elements in the rotor zone, and a grid independence study was performed. The first layer height of inflation was 0.002mm, meeting the requirement of turbulence model for y+, and 20 prism layers were set in the near-wall zones with 1.2 growth ratio.

Figure 1. Geometry of the first stage of high-pressure turbine.
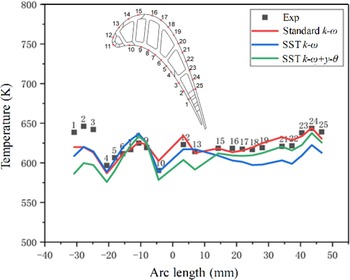
ANSYS Fluent was applied to solve the three-dimensional flow of the first-stage turbine using the URANS method. Three turbulence models, standard k–  $\omega$, Shear Stress Transport (SST) k–
  $\omega$ and SST
  $k-\omega+\gamma-\theta$, were investigated and their calculation result was compared with that of the medium-temperature and medium-pressure coupling heat transfer experiment. The result, shown in Fig. 2, is that the midspan temperature of rotor blade in all three models is consistent with the experimental measurement in terms of distribution. Ultimately, the standard k–
  $\omega$ model was chosen because it can best predict the temperature of the blade surface.

Figure 2. Turbulence model validation results.
The annular characteristic was simulated by implementing periodic boundary conditions, and the stator–rotor interface employed the periodic repeat option to transmit the flow information of the stator outlet to the rotor inlet section. A non-uniform temperature profile was set at the inlet of the vane, and a temperature margin was considered for the high-temperature take-off condition. Total pressure and static pressure were specified at the stator inlet and the rotor outlet, respectively. All walls were set as adiabatic with no slip. Table 1 lists the specified conditions.
Table 1 Simulation boundary condition

2.2 Ash particle injection
In the actual operation condition of an aero-engine, the volume concentration of particles entering the aero-engine is much less than 10%. The Discrete Phase Model (DPM) thus can be applied for numerical simulation. The DPM applies the Euler–Lagrange method to track particles by computing the trajectory of particles through forces on particles induced by the mainstream. The material property of the fly-ash particle refers to the Jim Bridger Power Station (JBPS) subbituminous ash mentioned in Ref. (Reference Whitaker, Prenter and Bons13), and five particle sizes are studied separately, listed in Table 2. Particles are released at the inlet of the stator, and every surface cell is set as an emission source. There are approximately 30,000 particles, considering the turbulent dispersion (random walk model), thermophoretic force, Saffman lift force and pressure gradient force.
Table 2 Particle property and injection condition

The deposition of particles is predicted by the critical velocity model which is achieved through the User-Defined Function (UDF), C language incorporated, in ANSYS Fluent. Behaviours of particles, such as impact, adhesion, rebound, energy loss after rebound and detachment, are considered. Velocity and temperature of the particles at the stator inlet are given by extracting flow field information through the UDF. Generally, the concentration of particles in an aero-engine is about 0.1 parts per million by weight (ppmw)(Reference Barker, Casaday, Shankara, Ameri and Bons22), and the interaction between particles and the turbulence modification for particles in the flow can be negligible(Reference Kulick, Fessler and Eaton23,Reference Kaftori, Hetsroni and Banerjee24) . However, it is unrealistic to form a considerable number of deposits through thousands of hours, and the time step in an unsteady numerical simulation is very short. The concentration of particles is increased to hundreds ppmw to accelerate the deposition and simplify the calculation.
2.3 Critical velocity model
Brach and Dunn(Reference Brach and Dunn17) proposed the critical velocity model to predict whether particles deposit when impacting on a wall by balancing the critical velocity and the normal velocity. If the normal impact velocity exceeds the critical velocity, particles are assumed to rebound from the wall, otherwise stick to it. The critical velocity is defined by composite Young’s modulus and particle size, which is given as
 \begin{equation}{V_{cr}} = {\left[ {\frac{{2E}}{{{d_p}}}} \right]^{10/7}}\end{equation}
 \begin{equation}E=0.51{\left[ {\frac{{5\pi \left( {{k_1} + {k_2}} \right)}}{{4{\rho _p}^{3/2}}}} \right]^{2/5}}\end{equation}
 \begin{equation}{k_1} = \frac{{1 - v_s^2}}{{\pi {E_s}}}\end{equation}
 \begin{equation}{k_2} = \frac{{1 - v_p^2}}{{\pi {E_p}}}\end{equation}
where  ${V_{cr}}\;$is the critical velocity,
  $E$ is the composite Young’s modulus,
  ${E_s}$ is the surface Young’s modulus,
  ${E_p}$ is the Young’s modulus of the particle,
  ${\nu _s}$ is the surface Poisson ratio and
  ${\nu _p}$ is the particle Poisson ratio.
The Young’s modulus is affected by the material properties of the particle and is sensitive to temperature change. A function of the Young’s modulus was developed by Ai and Fletcher(Reference Ai26) based on studies of deposition on a flat plate(Reference Ai and Fletcher25):
 \begin{equation}{E_p}=3 \times {10^{20}} \times {\rm{exp}}\left( { - 0.02365{T_{avg}}} \right)\end{equation}
 \begin{equation}{T_{avg}} = \frac{1}{2}\left( {{T_s} + {T_g}} \right)\end{equation}
where  ${T_{avg}}$ is the average temperature of the surface temperature (
 ${T_s}$) and the free stream gas temperature (
 ${T_g}$).
2.4 Detachment model
The detachment model is applied to determine whether the particles which impact on the wall adhere or not by balancing the shear force and the wall friction. Every individual particle is assumed as a sphere, and its detachment is affected mainly by rolling rather than sliding or lifting. Therefore, a detachment model developed by El-Batsh(Reference El-Batsh27) is given as
 \begin{equation}{F_D}\left( {\frac{{{d_p}}}{2} - \alpha } \right) + {F_L}a \ge {F_{po}}a\end{equation}
where  ${F_D}$ is the drag force of the particle,
  $\alpha $ is the distance from the centre of the sphere to the wall,
  ${F_L}$ is the fluid lift force acting on the particle,
  $a$ is the radius of the contact surface and
  ${F_{po}}$ is the sticking force of the particle. Since
  $\alpha $ and
  ${F_L}$ are neglectable compared with the diameter of the particle and other forces, the formula becomes
 \begin{equation}{F_D}\left( {\frac{{{d_p}}}{2}} \right) \ge {F_{po}}a\end{equation}
The drag force of a spherical particle is defined as
 \begin{equation}{F_D} = \frac{1}{2}{C_D}\rho u_c^2{A_{cp}}\frac{f}{{{C_u}}}\end{equation}
 \begin{equation}{C_D} = \frac{{24}}{{R{e_p}}}\;\;\;\;\;\;\;\;R{e_p} = \frac{{{d_p}{u_v}}}{\nu }\end{equation}
 \begin{equation}{C_u}=1 + {K_n}\left( {1.2+0.41 \times {\rm{exp}}\left( { - \frac{{0.88}}{{{K_n}}}} \right)} \right)\end{equation}
 \begin{equation}{F_{po}} = \frac{3}{4}\pi {W_A}{d_p}\end{equation}
where  ${C_D}$ is the drag coefficient,
  ${u_c}$ is the fluid velocity at the centre of particle,
  ${A_{cp}}$ is the cross-sectional area of the particle,
  $f$ is the correction factor for the particle near the wall,
  ${C_u}$ is the Cunningham correction factor,
  $R{e_p}$ is the Reynolds number of the particle,
  ${K_n}$ is the Knudsen number and
  ${W_A}$ is the work of sticking for particles, which is assumed as 0.0389 J for ash particles.
3.0 RESULTS
The migration and the deposition of particles are determined by the flow characteristics of the continuous phase and the property of particles. Therefore, two different boundary conditions, i.e. high-temperature take-off and economic cruise, and particles with diameters of 1, 5, 10, 15 and 25 $\upmu$m are investigated, respectively. Besides, the calculation results of the stator–rotor interaction are demonstrated through the unsteady simulation.
3.1 Particle migration
To understand the movement of particles in the stator passage, which determines the migration pattern of the particles in the subsequential rotor passage, the migration of particles is analysed in detail from the inlet to outlet of the stator vane, including the entire flow passage. The concentration of particles with 10 $\upmu$m diameter at the plane which is close to the LE of the stator under different operating conditions is shown in Fig. 3 (note that the scales of (a) and (b) are different). Although two operating conditions are disparate, the concentration distribution of particles is similar. The particle concentration at the inlet of the stator vane under high-temperature take-off conditions is approximately twice that of economic cruise conditions. The mainstream flow stagnates at the LE of the stator, where particles are concentrated and impact on the wall. Therefore, there is a high concentration area on the stator inlet plane near the LE.

Figure 3. Concentration of particles at the stator inlet.
Particles with various diameters present different flow characteristics in the stator passage. The trajectory of particles under different operating conditions is documented in Figs. 4 and 5. The flow deflection angle of particles depends on the flow of fluid and the diameter of particles. Compared with the cruise condition, the larger pressure gradient in the stator passage increases the velocity and flow deflection angle of particles under the take-off condition. The particle with smaller diameter has less inertia and is more affected by the fluid flow. Therefore, the particles with 1 $\upmu$m diameter impact on not only the PS of the stator but also the Suction Side (SS) near the Trailing Edge (TE) on account of the pressure gradient force in the passage. As particle size grows, the velocity of particles increases and the flow deflection angle gradually decreases. When particle size reaches 25
 $\upmu$m, particles mainly impact on the PS of the stator, especially the LE, and easily deposit because of a smaller transverse shear force. It is shown in Figs. 6 and 7 that particles with larger diameter are more concentrated at the outlet and have a lower concentration. In addition, due to the lower temperature at the cruise condition, the critical velocity is lower than that of the take-off condition, although particles impact the wall with a smaller normal velocity which is still higher than the critical velocity. Multiple rebounds are thus formed on the surfaces, which contributes to a dispersed concentration distribution of the particles at the stator outlet.

Figure 4. Trajectory of particles with different diameters in the stator passage at take-off condition.

Figure 5. Trajectory of particles with different diameters in the stator passage at cruise condition.

Figure 6. Concentration of particles at the stator outlet under take-off condition.

Figure 7. Concentration of particles at the stator outlet under cruise condition.
The migration of particles in the rotor passage is shown in Figs. 8 and 9. Most particles impact on the PS of the blade because of the incident angle generated after the particles passing through the stator. The impact position gradually moves to the LE because of the influence of the rotation. A few particles are carried away by the leakage flow caused by the tip clearance. Particles with smaller diameter are more dispersed and the impact area is wider, including the LE and the PS of the blade. As the size of particles increases, the impact location approaches the mid-chord of the blade with a more concentrated distribution and a lower velocity. Figure 10 compares in detail the movement of particles with 10 $\upmu$m diameter on the blade surface under two operating conditions. It is shown that the critical velocity at take-off condition is considerable, so that almost all particles deposit after impacting on the surfaces. While in the cruise condition, particles bounce on the blade surface multiple times and ultimately deposit. Furthermore, the particles near the tip move toward the top of the blade under the action of centrifugal force.

Figure 8. Trajectory of particles with different diameters in the rotor passage at take-off condition.

Figure 9. Trajectory of particles with different diameters in the rotor passage at cruise condition.

Figure 10. Migration of particles with 10 $\upmu$m on the rotor blade.
The stator–rotor interaction also plays an important role in the migration of particles in the rotor passage. The concentration of particles with 10 $\upmu$m diameter at the rotor inlet in five different intervals of a rotation period under the take-off condition is demonstrated in Fig. 11. The particles are affected by the bend and twist shape of the stator, forming a concentrated arc strip structure, and move against the rotating direction related to the rotor, due to the function of rotation as time goes by. Different operating conditions determine the reaction when particles impact on the rotor blade. Particles are directly deposited on the blade surface under the take-off conditions while under the cruise conditions particles rebound after impacting because the critical velocity is relatively small. Therefore, the presentation of the particle movement under the cruise conditions is more representative, and the migration of particles with five diameters at different moments of the cruise condition is shown in Fig. 12. The particles first impact on the LE and then gradually move to the mid-chord of the blade with the rotation of the rotor. Because the larger particles have a smaller deflection angle with respect to the flow direction, they first reach the LE of the next rotor and rebound, while the particles with other diameters are then deflected by the next rotor and change their trajectories. Affected by the mutual interference between rotors, particles cannot directly impact on the PS of the blade near the TE. The multiple rebounds, occurring at cruise condition, also gradually move to the position where the curvature of the PS is greatest because of the bend structure of the rotor. What is more, particles with a smaller size have a higher critical velocity so that the number of rebounds and the distance of movement decrease. Finally, the impact location is mainly concentrated on the LE and the front edge of the PS.

Figure 11. Concentration of particles with 10 $\upmu$m diameter at the rotor inlet in different intervals.

Figure 12. Migration of particles with five diameters in rotor passage at different moments.
3.2 Particle deposition
The deposition of particles on blades is directly affected by the migration of particles in the stator and rotor passages. Whether particles deposit on the wall is determined by the critical velocity deposition model through balancing the impact normal velocity and the critical velocity, as well as the shear force and the wall friction on the particles. All these factors are associated with the material property of particles and the characteristics of the flow field. To obtain the distribution of particles on the first-stage blades of the turbine and lay the foundation for finding ways to inhibit particle deposition, this section studies the deposition of particles on the stator vane and the rotor blade under different operating conditions and with various particle sizes.
The deposition of the particles with 10 $\upmu$m diameter on the first-stage high-pressure turbine stator under different operating conditions is shown in Fig. 13. In general, the particles deposit on the PS of the blade, and deposits concentrate on the LE and the PS near the TE. Compared with the cruise condition, the deposits on the stator vane greatly increase with a higher temperature and a larger flow rate of the mainstream under the take-off condition. The LE, straight facing the flow, is the highest temperature area of the blade where particles impact with the highest normal velocity. Consequently, the LE of the stator becomes the area with the largest deposits. In the present cooling design, it is the LE of the stator that the air film holes are most concentrated on. The effect of particle deposition on the cooling design thus should be taken into full consideration. What is more, the mainstream has the largest deflection angle at the TE of the stator so that the PS near the TE also has considerable deposit. The impact of particles and the blockage of air film holes are more likely to cause damage at the TE due to its small cross-sectional area and high heat load. Therefore, attention should be paid to both the cooling and strength design.

Figure 13. Deposits of particles with 10 $\upmu$m diameter on the stator surface.
To explore the effect of different particle sizes on the deposition distribution, Figs. 14 and 15 present the deposits of particles with diameters 1 and 25 $\upmu$m, respectively, on the stator vane under the take-off condition. Similar to Fig. 13, both the LE and the PS near the TE are the places where deposits are concentrated. The difference is that the particles with smaller size have smaller inertia and are easier to move with the fluid flow. Therefore, on one hand, it is difficult for particles to impact on the PS near the endwall under the action of the passage vortex. On the other hand, the particles move towards the SS of the blade under the action of the pressure gradient force. That is why deposits are sparse at the PS near the endwall and concentrated at the mid-back chord area of the blade when the diameter of the particles is 1
 $\upmu$m. Moreover, the particles with smaller size have less wall friction and greater shear force, making it more difficult to deposit on the surface after impacting. The deposits thus are much less than that of particles with the bigger size. When the diameter of particles is 25
 $\upmu$m, the entire area of the PS is directly impacted. Except for the largest deposits on the LE, the deposits in other areas of the blade are relatively uniform. While on the SS of the stator, combined with the trajectory of particles in Figs. 4 and 5, since it is difficult for particles to change the flow direction with the fluid, there are no particles deposited in this area.

Figure 14. Deposits of 1 $\upmu$m particles on the stator vane under the take-off condition.

Figure 15. Deposits of 25 $\upmu$m particles on the stator vane under the take-off condition.
Figures 16 and 17 quantitatively compare the deposits on the stator vane under different particles sizes between the PS and the SS. It is demonstrated that the percentage of deposits under two operating conditions presents similar results. As mentioned above, the particles with 1 $\upmu$m diameter can reach the mid-back chord area of the stator because of the pressure gradient force. The proportion of deposits on the SS, thus, is relatively large. When the diameter of particles is 5
 $\upmu$m, particles can only impact on the LE of the stator on account of the inertia, which contributes to the entire component of the deposits on SS. Therefore, the proportion of the deposits on SS of the stator drops rapidly. However, as the particle size increases, the number of the particles directly impacting on the LE also increases so that the proportion of the deposits on the SS of the stator consequently increases. Overall, most of the particles entering the turbine impact and deposit on the PS of the stator that has the largest deposits. Compared with the take-off condition, the rebound of particles in the cruise condition increases the possibility of particles moving to the SS but also decreases the deposits on the PS, and the proportion of the deposits on the SS thus improves relatively.

Figure 16. Deposit percentage on the stator vane at take-off condition.

Figure 17. Deposit percentage on the stator vane at cruise condition.

Figure 18. Deposit percentage on the stator and rotor at take-off condition.

Figure 19. Deposit percentage on the stator and rotor at cruise condition.

Figure 20. Deposits of particles with different diameter on the rotor blade at take-off condition.

Figure 21. Deposits of particles with different diameter on the rotor blade at cruise condition.
To subsequently study the deposition of particles on the rotor blade, it is necessary to understand the proportion of the deposits in the turbine stage. Figures 18 and 19 quantitatively compare the deposits on the stator and rotor. When the particle size is very small, such as 1 $\upmu$m, the deposits are concentrated mainly on the rotor rather than the stator because the particles with smaller size have greater shear force and less wall friction and are more easily blown off the surface. As the particle size increases, the proportion of the deposits on the stator increases and eventually exceeds that of the rotor under the take-off condition. While in the cruise condition, particles are difficult to deposit and rebound on the stator surface multiple times. The rebound particles then escape the stator passage carried by the fluid flow and enter the rotor passage so that the deposits on the stator decrease, which contributes to the increasing proportion of the deposits on the rotor.
Because of the stator–rotor interaction in the turbine stage, big changes take place in the flow field and the migration of particles in the rotor passage, compared with those in the stator passage, which has great influence on the deposition of particles on the rotor blade. To this end, deposits of particles with various diameters on the rotor blade under different operating conditions are documented in Figs. 20 and 21. The deposits are mainly distributed on the LE and the front chord area of the PS because of the injection angle of particles after passing the stator and the interference between rotors. The particles with the smallest size have the largest deposits on the rotor blade, as mentioned above. However, a distinct difference of the deposition on the rotor blade is shown under two operating conditions. For high-pressure take-off condition, the deposits are distributed in a wide strip structure on the LE and the front chord area of the PS but vary with different particle sizes. The particles with smallest diameter (1 $\upmu$m) have the largest flow deflection angle and are supposed to impact the area closer to the LE. However, the distribution of deposits increases to the mid-chord region under the action of the fluid flow while the particles with 5
 $\upmu$m diameter have the narrowest distribution of deposits due to the inertia that resists the flow. As the particle size increases, the width of the deposition strip structure gradually increases and the effect of centrifugal force on the particles becomes prominent. The deposition area gradually migrates toward the tip of the blade where the deposits are also concentrated. In addition, there is a deposition region on the tip shoulder of the PS when particle size is over 5
 $\upmu$m. As for the economic cruise condition, the deposition distribution is similar to that of the take-off condition when the particle size is 1
 $\upmu$m, since the critical velocity is relatively high and it is easy to deposit. As the particle size increases, rebound occurs when the critical velocity is less than the impact normal velocity, which leads to the migration of particles moving to the position where the curvature of the PS is the greatest. Therefore, the deposits are more concentrated and distributed in a thread form. Besides, it is easier for the rebound particles to enter the tip clearance and deposit on the tip under the action of the leakage flow. The deposits on the tip, thus, are much higher than those of the take-off condition.

Figure 22. Deposit percentage on the rotor blade.
The deposits on the rotor blade under different particles sizes among the PS, the SS and the tip are compared quantitatively in Fig. 22. Different results of the deposits proportion are demonstrated under two operating conditions. For the take-off condition, the proportion of deposits under the five particle sizes is similar. The PS of the blade has the most deposits, and the deposits on the SS increase as the particles gradually impact on the LE with the growth of the particle size. There are few particles entering the tip clearance with the leakage flow since the particles hardly rebound after impacting on the wall under high temperature. The deposits on the tip, thus, are very small. Nevertheless, the multiple rebounds presented in the cruise condition change the proportion of deposits on the rotor blade. As the particle size grows, the number of particle rebounds and the moving distance increase so that it is easier for the particles with larger diameter to enter the tip clearance and deposit on the tip. Meanwhile, the larger particles impacting on the LE of the SS rebound rather than deposit. Therefore, the proportion of deposits on the tip increases while that on the PS and the SS decreases with the increase of the particle size.
To better understand the effect of the operating conditions and particle size on the deposits of the first stage in turbine, two non-dimensional parameters are introduced: capture efficiency and Stokes number. The capture efficiency is defined as the mass of particles depositing on wall versus the total mass of the injected particles, which depends not only on the particle size but also on the characteristics of the flow. At this time, the Stokes number matters, which is defined as the ratio of the particle relaxation time and the characteristic timescale of the flow or an obstacle:
 \begin{equation}St = \frac{{{\rho _p}{U_c}d_p^2}}{{18\mu {L_c}}}\end{equation}
where  ${U_c}$ is the characteristic velocity of the flow,
  $\mu $ is the dynamic viscosity of the fluid and
  ${L_c}$ is the characteristic length scale of the obstacle. In this study,
  ${L_c}$ is the chord of the stator and rotor, respectively. The Stokes numbers of the stator and rotor under different operating conditions are listed in Table 3.
Table 3 Stator and rotor Stokes number


Figure 23. Capture efficiency for the stator and rotor.
The deposition capture efficiency of the stator and rotor is shown in Fig. 23. The capture efficiency on the stator increases rapidly with the growth of the Stokes number at the beginning, and then the range of increase decreases gradually and tends to be flat. Compared with the cruise condition, the capture efficiency declines under the take-off condition because the pressure is much higher, and the particles suffer a stronger shear force so that it is difficult to deposit after impacting on the surface. Meanwhile, on the rotor, when the Stokes number is small, the capture efficiency is almost the same. With the increase of particle size, the change trend of capture efficiency is totally different, and the difference gradually increases. The pressure gradient is greater under the take-off condition and the centrifugal force is stronger because of the faster rotating speed, which makes particles difficult to deposit. Therefore, the capture efficiency decreases gradually with the increase of the particle size. As for the cruise condition, smaller particles directly pass through the tip clearance with the leakage flow, while larger particles need to rebound to the top of the blade and then enter the tip clearance. The larger the size of the particle, the more particles flow away. The capture efficiency, hence, first increases and then declines but varies within a small range with the change of Stokes number.
4.0 CONCLUSION
In this paper, unsteady numerical simulations were performed to investigate the migration patterns and deposition characteristics of the particle contaminant in a one-stage, high-pressure turbine of an areo-engine under the actual operating conditions. The effects of operating conditions and particle sizes on the migration and deposition of fly-ash particles were demonstrated. By comparing the trajectories of particles in the turbine stage passage and deposition distribution on the stator vane and rotor blade, the following conclusions are obtained:
1. The migration of particles in the turbine stage passage is determined by the mainstream temperature and the particle size. The particles with lower temperature and larger size are more likely to rebound on the wall, and the number of rebounds and moving distance increase with the growth of the particle size. The particles with larger diameter have greater inertia to resist the influence of the fluid flow so that the deflection angle is smaller during the flow.
-
2. Particles mainly deposit on the LE and the PS of the stator vane. The quantity of deposits increases as the temperature of the mainstream temperature rises and the particle size increases, which leads to a decrease of deposition on the subsequent rotor blade.
-
3. The rotor blade is subject to stator–rotor interaction and interference between rotors, and the deposits are mainly distributed on the LE and mid-front chord area of the rotor. Compared with the take-off condition, the deposition of particles is more concentrated, and the particles with larger sizes deposit more on the tip of the blade under the cruise condition.
-
4. The deposition capture efficiency of the stator and rotor shows different changing tendency with the growth of particle size. The capture efficiency of the stator under the take-off condition is lower than that of the cruise condition because of a stronger shear force on particles. The difference becomes larger in the rotor because of the effect of pressure gradient.
In summary, the migration patterns and deposition characteristics of particle contaminant in a one-stage, high-pressure turbine of an areo-engine are strongly affected by the operating conditions and the external working environment. The research results offer further understanding of particle–flow interaction for follow-up research on the ‘two-way’ coupling mechanism of particle contaminant and coolant injection, and are expected to provide guidance regarding the development of high-pressure turbine areo-thermal design which is insensitive to the deposition of particles.
Acknowledgements
The authors would like to acknowledge the financial support from the National Nature Science Foundation of China (Grant No. 51906185) and the National Postdoctoral Program for Innovative Talents of China (Grant No. BX20180248).