


The concept of resilience has been used in many disciplines, including the engineering, physical, ecological, and social sciences, and dates back to at least the 1970s.Reference Gordon 1 While its original uses were in physics, economics, and psychology, in recent years resilience has been applied to infrastructure systems and communities, particularly in the context of disasters. The concept has been used to explain the responses of individual, organizational, community, social, ecological, and physical systems to some disturbance. Community resilience is a central feature of Presidential Policy Directive PPD-8 regarding disaster preparedness 2 and of the Department of Homeland Security’s National Infrastructure Protection Plan. 3
There is an existing literature on efforts to operationalize the concept of resilience for communities in the context of disasters, which significantly informed our efforts.Reference Bruneau, Chang and Eguchi 4 - Reference Wells, Tang and Lizaola 12 However, additional work was needed for several reasons. First, we believe that prior efforts to characterize community resilience during disasters were at times incorrectly framed as measurement, for resilience is a latent construct that cannot be directly measured ahead of a disaster; accordingly, we developed a model to predict it. Second, prior efforts at times conflated resilience with baseline community functioning; we have explicitly separated them conceptually and in measurement and prediction. Third, prior computational efforts with real-world data treated resilience and its assessment statically rather than as a dynamic process; we have created a system dynamics model in this work. Finally, our approach explicitly separates resilience into its 2 major components, resistance and recovery, rather than combining the terms into a less actionable single construct.
There have been increasing calls for the application of systems thinking and systems modeling approaches to public health.Reference Maglio, Sepulveda and Mabry 13 - Reference Forrester 16 This set of methods, commonly used in systems science,Reference Mabry, Olster and Morgan 17 , Reference Sterman 18 has application in many areas of public health,Reference Homer and Hirsch 19 including community-based participatory research,Reference Hovmand 20 implementation science,Reference Leischow and Milstein 21 and mental health services.Reference Lyon, Maras and Pate 22 Community functioning and resilience represent a complex and dynamic system amenable to system dynamics modeling, which allows the explicit separation of baseline community functioning from factors that influence resilience, and the evaluation and understanding of the complex dynamic behavior that affects both.
Our focus was on the functioning and well-being of communities over time after a disaster. We termed our approach the Composite of Post-Event Well-being (COPEWELL). It incorporated the knowledge of community resilience generated by previous efforts, along with advances in system dynamics modeling and our understanding of the complex system we sought to represent. This approach allowed the generation of the predicted time course of community functioning during and after a disaster for all US counties, in an explicit and transparent way that enables refinement over time.
METHODS
Overview
In late 2011, the US Centers for Disease Control and Prevention (CDC) asked the authors to develop a “community resilience index” for the entire United States in the context of disaster preparedness for all hazards. We utilized a process to minimize disciplinary barriers to what are inherently multi- and interdisciplinary sets of problems, and assembled a team of experts in behavioral health, civil engineering, criminal justice, community health, computational modeling, education, disaster and emergency management, emergency medicine, environmental epidemiology, environmental health sciences, geography, health behavior, health communication, law, mental health, program evaluation, public health practice, public policy, public safety, risk management, social epidemiology, sociology, systems modeling, urban affairs, and urban health.
This group worked on (1) foundational planning efforts to overcome disciplinary hurdles regarding vocabulary, methods, and priorities among the disciplines; (2) the development of a conceptual model with all domains and connections identified; (3) the development of a corresponding computational model; and (4) the use of expert opinion and published scientific literature to decide how to measure each conceptual domain in the model. Herein we present the methods and results for these 4 tasks and also consider key future tasks such as the evaluation and validation of the model and its candidate uses by policy-makers and practitioners.
Decisions and Realizations From Application of Systems Thinking
During this multi-year process, we arrived at 3 key realizations that had not been fully implemented in prior disaster resilience work: (1) an important conceptual and operational distinction exists between baseline community functioning and resilience; (2) resilience has 2 key components, resistance to a potential perturbation and recovery of function over time after perturbation, that should be separately characterized, because they are influenced by different factors; and (3) the computational modeling should appropriately capture the dynamics of the community as a complex system.
An important decision was made early on regarding the appropriate spatial scale for the model. We selected the county level for 2 primary reasons: (1) many governmental public health and emergency management activities are organized and delivered at this level and (2) this level represents a spatial scale that is smaller than the state level and thus more reflective of “community” in a systems sense but large enough to provide measures that are consistently obtained throughout the country.
Development of the Conceptual Model
The conceptual model was built around community functioning as the primary parameter of interest, through an iterative process involving discussions and review of the literature.Reference Bruneau, Chang and Eguchi 4 - Reference Wells, Tang and Lizaola 12 We used the existing disaster resilience literature to identify all major constructs that influenced resilience and community functioning before, during, and after a disaster, explicitly without regard to the ultimate availability of actual data or measures to represent these constructs. A key assumption was the expectation that communities try to maintain their ability to provide a range of services to inhabitants. We sought to include elements that the literature suggested might impact a community’s response to a disaster and specified the interconnections between these elements. Post-event functioning is the main outcome of interest and is dependent on a number of factors, including pre-event functioning and characteristics of the event. Pre-event prevention and mitigation activities are explicit and directly measurable; they act as modifiers of the relation between the event and post-event functioning. The conceptual model used pre-event surrogates for those domains affecting functioning during and after an event in anticipation of the needs of the computational model. Populating these exclusively with pre-event measures allows the model to be used before a disaster to predict community functioning and resilience during and after a disaster.
Development of the Computational Model
We next translated the conceptual model to a system dynamics computational model. We first developed the model architecture by explicitly including all pre-event concepts, domains, and surrogates in the conceptual model and then identifying the dynamic interconnections between these elements. Our system dynamics model is a standard stock-and-flow model used in public health and engineering.Reference Homer and Hirsch 19 , Reference Lyon, Maras and Pate 22 The stocks represent accumulations that indicate the time-varying state of the system (eg, community functioning). The pipes connected to the stocks represent flows (or activities). The valves represent rate constants that control the flows in the system. Each stock’s time-varying level is represented by a differential equation that incorporates the rate constants (Figure S1 in the online data supplement). Two differential equations include empirical scaling constants, selected to produce a sensible time course.
The systems model includes as an input a time-varying event (ie, the disaster) whose magnitude and time course are modeled herein as a mono-exponential decline because we present results for a natural hazard but which could take other forms (eg, a Gaussian function if our focus had been a pandemic). The event term in the model is a magnitude time course, not a probability (because the model is conditioned on the event occurring). The model’s development was driven by all-hazards thinking, but it became apparent during development that more hazard-specific forms would be helpful, in which certain domains are only included for specific hazards. For demonstration purposes, a hurricane was the event and was applied to all counties with the same magnitude and time course. Distance-to-coast was used to measure the hurricane mitigation services provided by natural systems. We chose a hurricane to illustrate the use of a relevant natural systems measure. For other events, including disease-based events such as a pandemic, the natural systems domain might not be relevant, and the countermeasures domain and corresponding relevant measures would be used instead.
The computational model outputted both single-county and entire-country results. Single-county results are displayed as curves; entire-country results are displayed as color-coded maps. In either case, the primary model output is the predicted time course of community functioning after the start of the disaster event. Two programming environments were used: for the single-county focus we used Vensim (Ventana Systems, Inc, Harvard, MA) and for the entire country focus we used MATLAB (The Mathworks, Inc, Natick, MA).
Selection of Measures to Populate the System Dynamics Model
We conceptualized community functioning as the ability and capacity of a community to provide a range of essential services to its inhabitants, rather than as the health (broadly defined) of the community population. This distinction had critical implications for the domains and measures we chose. We identified candidate measures available at the county level belonging to each domain and selected measures (Table 1) that met the following criteria: (1) judged to have face validity and predictive construct validity for community functioning after an event, (2) routinely available for almost all counties, (3) evidenced reasonable variation across counties, (4) would be relatively easy for others to implement (eg, not expensive to obtain, did not require significant computational or geographic information systems pre-processing), and (5) generally measured structures and processes (eg, number of hospital beds normalized by population) rather than outcomes (eg, mortality rates), except for the well-being domain, for which traditional health outcomes were used. The fifth criterion was applied because of a concern that outcome measures would likely conflate multiple domains within the model.
Table 1 Summary of Conceptual Model Concepts, the Domains Involved in their Measurement, and the Indicators for Each in the System Dynamics ModelFootnote a

a Abbreviations: EMS, emergency medical services; FEMA, Federal Emergency Management Agency. Bold font identifies the primary domains of measurement. See Methods for description of how indicators were selected.
b Positive indicates that the higher the indicator, the better the performance.
c References for the portions of the definitions in quotes available on request.
d Definitions: Community functioning: The ability of a community, measured at the county level, to provide goods and services in the following areas: communication, economy, education, food and water, government, housing, medicine and public health, nurturing and care, transportation, and well-being. Prevention and mitigation: Activities or systems that prevent or reduce the effect of an event on functioning. Population vulnerability, inequality, and deprivation: The panoply of social, political, and economic conditions that reduce a population’s ability to detect risk, to mitigate risk, or to recover from the effects of a hazard agent.
Visual inspection of the frequency distribution histograms of the measures across the 3,142 counties indicated that many had significant non-normal characteristics, including high positive and negative skewness. We used the Box-Cox transformation,Reference Sakia 23 , Reference Box and Cox 24 a parameterized power transformation, to better normalize the distribution of all of the measures. To reduce the influence of outliers, we truncated each measure at 3.5 SDs on both sides of the mean. We then standardized direction by multiplying “negative” measures (those for which a smaller value is better) by -1 (so that a positive increase in a measure was always “better”) and min-max scaled the measures so that the minimum and maximum were 0 and 1, respectively. Measures were then combined as a simple unweighted average, ignoring missing values within domains, to obtain a value for each domain.
RESULTS
Conceptual Model
The conceptual model (Figure 1) incorporates the accepted notion that disasters arise when events, populations, engineered infrastructures, ecosystems, and pre-event preparedness and mitigation activities interact over time. It incorporates factors thought to contribute to community functioning over time after an event, including natural systems, engineered systems, and countermeasures, which together reflect prevention and mitigation factors; population vulnerability, inequality, and deprivation; pre-event preparedness activities; social cohesion as a surrogate for emergent collective behaviors during and after the event; characteristics of the event itself; external resources after the event; formal emergency management activities, both planned and improvised, during and after the event; and community activities, both planned and emergent. Some components are pre-event components and can be directly measured; others are peri- or post-event components and are indirectly measured via proxies.
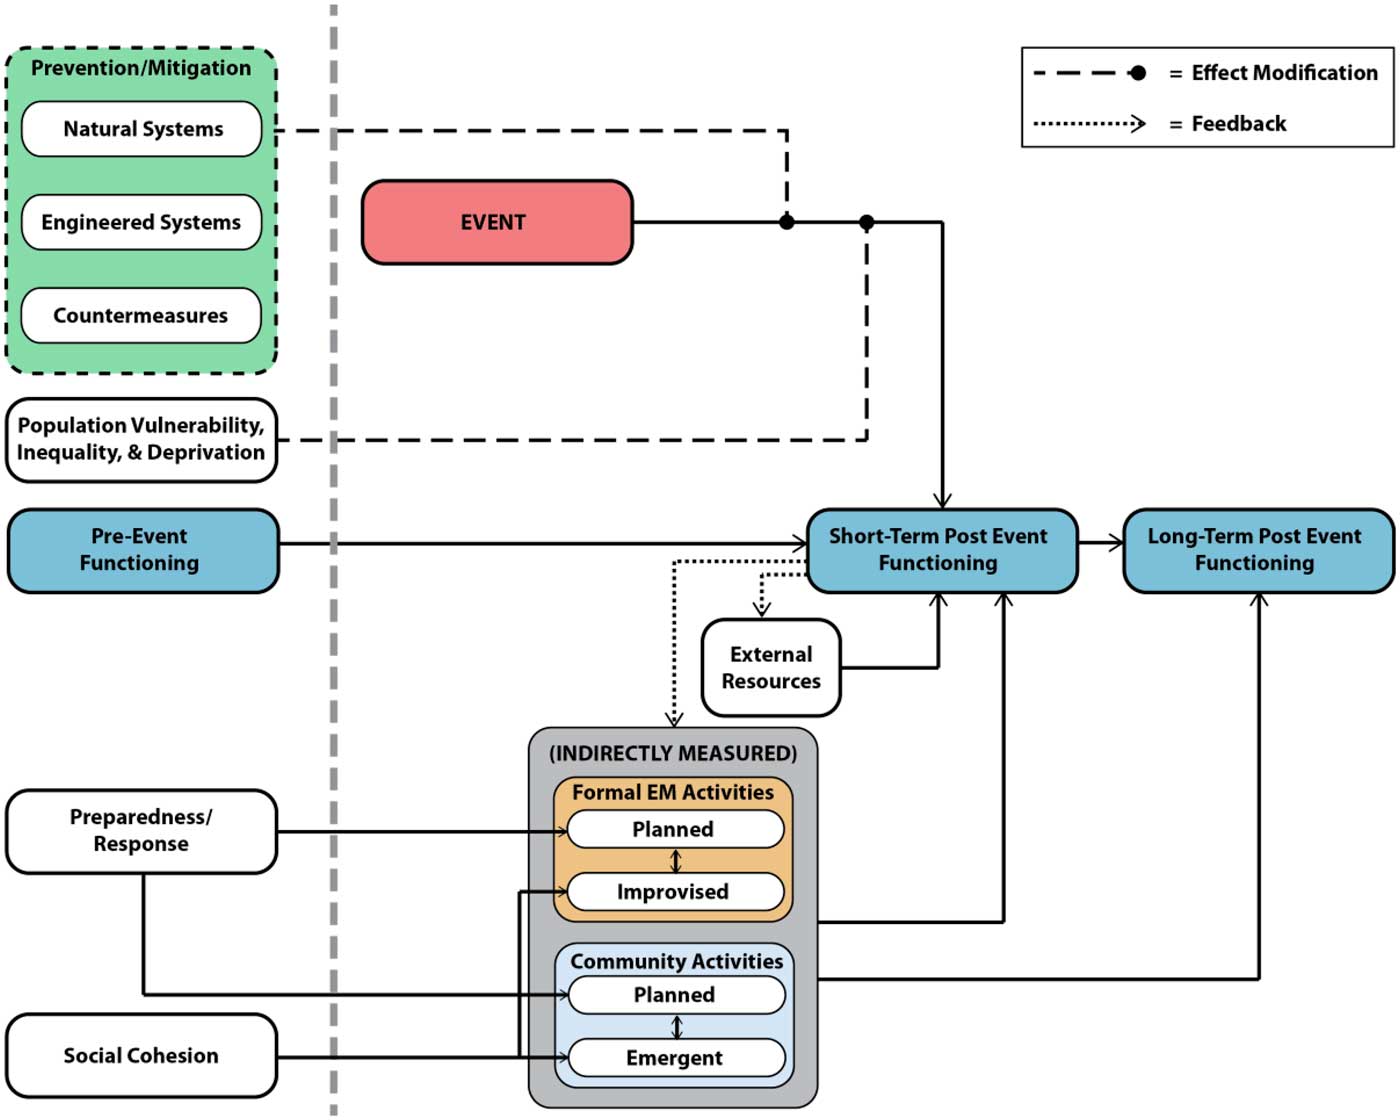
Figure 1 Conceptual Model of Key Components of Community Functioning After an Event. Abbreviation: EM, emergency management. All components to the left of the vertical dotted gray line are measured before the event. Nothing to the right of this line is directly measured; these are either measured with proxies before the event (eg, social cohesion as a surrogate for community activities) or predicted by the output of the computational model. The dashed lines represent moderation (ie, factors that modify the relation between the event and the time course of community functioning).
System Dynamics Computational Model
The system dynamics model that represents the conceptual model (Figure 2) makes explicit the recognition that the extent to which a community is functioning after an event is determined by a set of system structures, multiple feedback loops in the system,Reference Meadows and Wright 15 and their reactions to and modification of the event’s effects. The key stock is community functioning, whose initial condition (baseline pre-event functioning, CF0) is specified by domains and associated measures, and which is depleted after an event. Event modifiers vary by county, based on the corresponding measures. Community functioning can be replenished by 3 stocks (preparedness/response, social cohesion, and external resources).
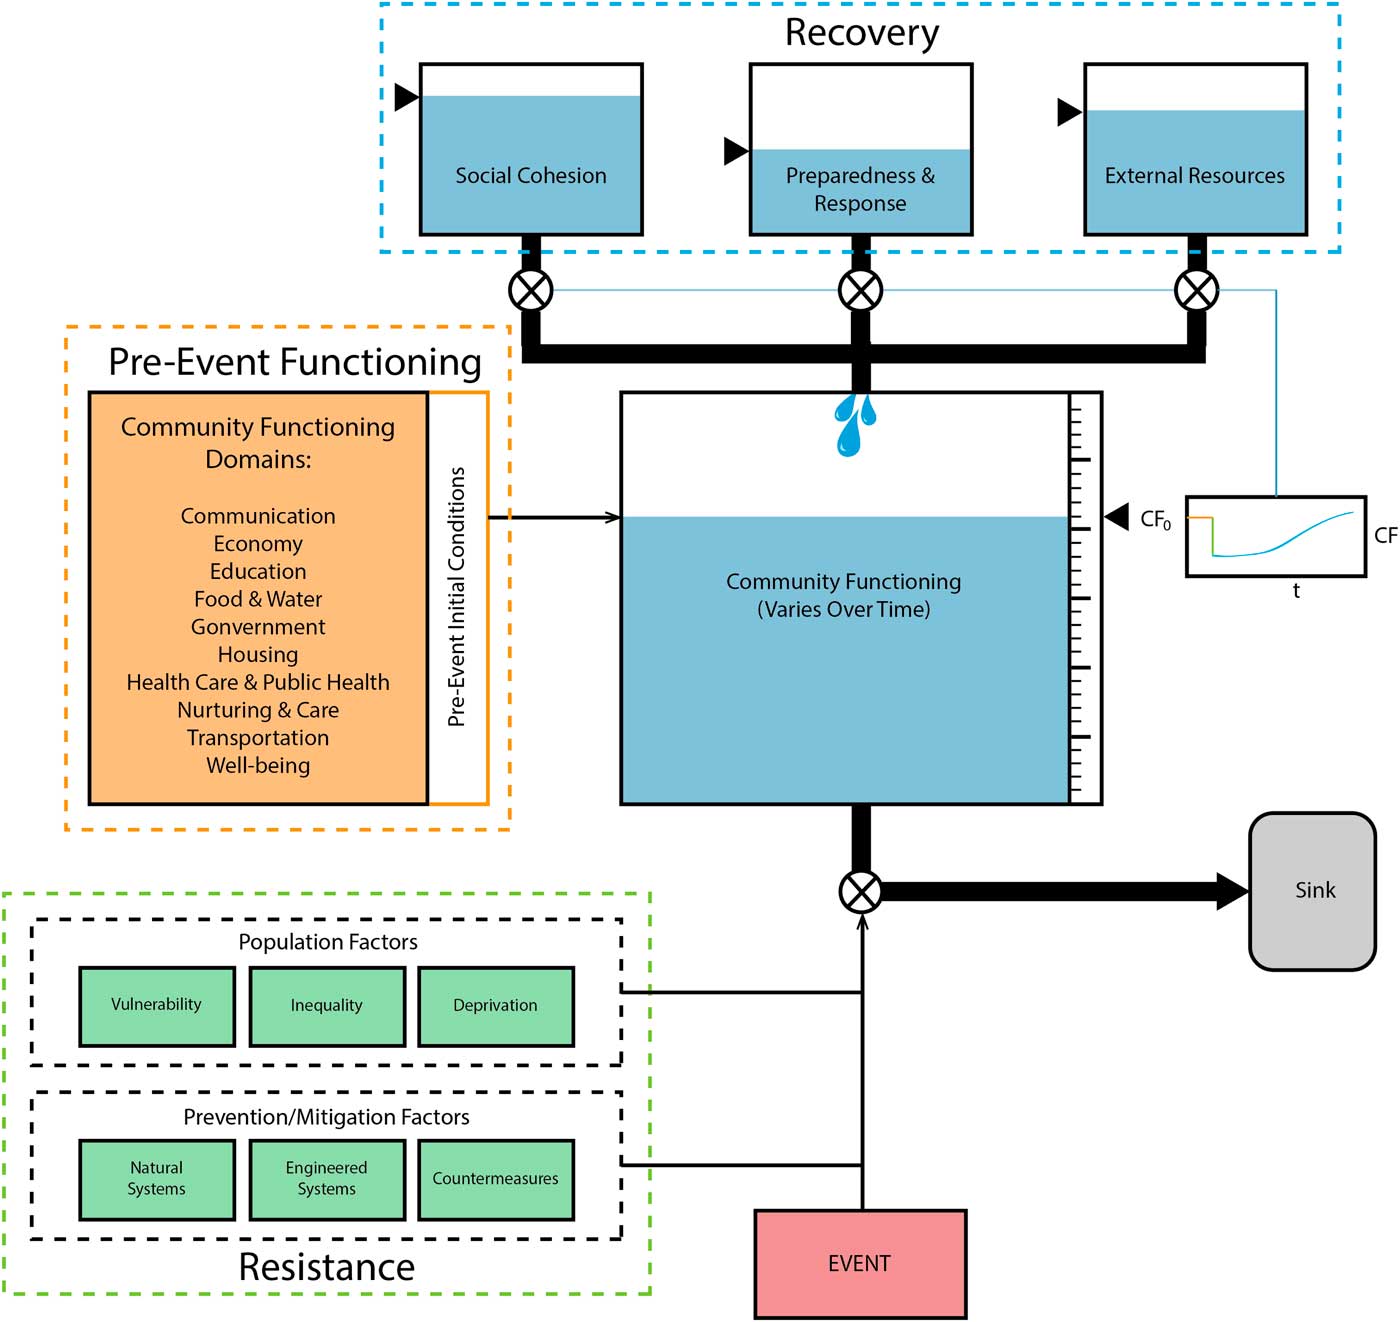
Figure 2 System Dynamics Model, Using Standard Symbols From the System Dynamics Literature, Showing the Depletion of the Community Functioning Stock Due to the Event and the Replenishment of Community Functioning From the Social Cohesion, Preparedness and Response, and External Resources Stocks. Abbreviations: CF, community functioning; CF0, baseline community functioning. Natural systems, engineered systems, countermeasures, population vulnerability, inequality, and deprivation serve to moderate the influence of the event.
Computational Model Output
The model outputs the time course of community functioning after an event, which is then used to calculate resistance, recovery, and resilience for each county. The output from the model showed that community functioning declined from baseline and returned in a pattern consistent with prior hypotheses and real-world observations (Figure 3). From that time course, resistance (the relative decline from baseline to the minimum of community functioning), recovery (the inverse of time to recovery from minimum to half of baseline community functioning), and resilience (the area under the curve of community functioning over time) could be calculated.

Figure 3
Output From the System Dynamics Model for an Actual County: Community Functioning Over Time After a Hurricane Event. Abbreviations: CF, community functioning; CF0, baseline community functioning. The plot identifies the 3 primary metrics that can be derived from the community functioning time course:
 $\eqalignno{ & {\bf CF}_{{{\bf middle}}} \, {\equals}\, {{{\bf CF}_{\bf 0} {\plus}{\bf CF}_{{{\bf min}}} } \over {\bf 2}} \cr & {\bf Resistance} \, {\equals}\, {{{\bf CF}_{{{\bf min}}} } \over {{\bf CF}_{\bf 0} }} \cr & {\bf Recovery}\,{\equals} \, {{\bf 1} \over {{\mib t}_{{{\bf half}}} }} \cr & {\bf Resilience}\, {\equals}\, {\bf area \ under \ the \ curve} \cr} $
The model’s county-by-county output was used to produce color-coded maps for all US counties for baseline community functioning and the predicted resistance, recovery, and resilience values after the hurricane event was applied equally to all US counties. Baseline community functioning showed reasonable variation across counties, with geographical clustering as would be expected (Figure S2 in the online data supplement). Similarly, resistance and recovery (Figures S3 and S4 in the online data supplement) and overall resilience (Figure 4), divided into quartiles, showed geographical patterning and clustering as would be expected from a hurricane. The different patterns apparent in the baseline community functioning and resilience (resistance and recovery) maps support our initial conclusion that these 2 should not be conflated.

Figure 4 Output from the System Dynamics Model: Resilience Across the United States by County Immediately After a Hurricane of Standardized Magnitude Applied to all Counties. The mean, SD, range, and interquartile range for resilience across all US counties were 0.901, 0.011, 0.862-0.937, and 0.895-0.909, respectively. On the plot, values were divided into quartiles, with Q1 to Q4 represented by purple, light blue, light green, and red, respectively. Natural systems (distance-to-coast) were included as a continuous variable from 0 to 250 miles from the coast; at larger distances it did not contribute to the Prevention/Mitigation domain.
DISCUSSION
We believe we have added 3 important results to the disaster resilience literature: (1) a transparent conceptual model that distinguishes between baseline community functioning and factors driving resilience, thereby making key components explicit, which facilitates discussion and supports improvement; (2) a highly visualizable dynamic computational model whose architecture further distinguishes between factors driving resistance versus recovery; and (3) initial results from the system dynamics model that predicted the time course of community functioning during and after a hurricane and the variation in resilience across the country. An important conclusion is that resilience should be separately characterized from baseline community functioning; communities may appear resilient when they simply have a high level of pre-event functioning.
This work is an example of what has been increasingly called for in public health: the application of modeling and simulation.Reference Maglio, Sepulveda and Mabry 13 Our work quantitatively represents, in silico, the behavior of a complex dynamic system and its components over time; it explicitly connects natural, engineered, and social systems.Reference Maglio, Sepulveda and Mabry 13 With further refinement, validation, and evaluation, such a model could improve decision-making by revealing “plausible futures” after disasters and helping to evaluate individual and combined effects and trade-offs of programs or policies to optimize community functioning after disasters.Reference Maglio, Sepulveda and Mabry 13
Our work built on the many significant prior efforts on community resilience that date to 2003, when Bruneau et al presented a framework to quantitatively assess the seismic resilience of communities, defined as a system’s ability to reduce the chances of experiencing an earthquake, absorb the shock once it has occurred, and recover quickly from it.Reference Bruneau, Chang and Eguchi 4 Starting in 2007, Norris et alReference Norris, Stevens and Pfefferbaum 25 and Pfefferbaum et alReference Pfefferbaum, Pfefferbaum and Van Horn 5 , Reference Pfefferbaum, Pfefferbaum and Van Horn 6 presented a conceptual model of resilience, characterized as a process linking a network of 4 primary sets of networked adaptive capacities (economic development, social capital, information and communication, and community competence). In 2008, Cutter et alReference Cutter, Barnes and Berry 7 proposed a “disaster resilience of place” (DROP) model for understanding community resilience to natural disasters; DROP included the antecedent conditions, the event, coping responses, and adaptive resilience. In 2010, they used the “inherent resilience” portion of their model to create a composite indicator of baseline community resilience for 736 counties in the southeast United States. All of these efforts emphasized, in concept, the dynamic and latent nature of resilience—important ideas that we then operationalized in a dynamic computational model that predicts resilience based exclusively on pre-event measures.
In 2010, RAND published a literature review of community resilience in the context of national health securityReference Chandra, Acosta and Meredith 8 in which they proposed that the core components of community resilience include the physical and psychological health of the population; its social and economic well-being; the ability of the community to use risk communication effectively; the involvement and integration of government and nongovernment organizations in planning, response, and recovery; and the social connectedness of the community. In 2011, RAND proposed 8 “levers” of community resilience,Reference Chandra, Acosta and Stern 9 and Los Angeles County subsequently implemented a program based on this work.Reference Plough, Fielding and Chandra 10 - Reference Wells, Tang and Lizaola 12 It is important to note that the 2 RAND documents explicitly distinguish, in concept, between resistance (or “withstanding”) and recovery. In 2011, the Community & Regional Resilience Institute published the Final Report of the Community Resilience System Initiative, which represented the culmination of several years of effort (www.resilientus.org). The product of this effort was the Community Resilience System, which helps communities understand their specific vulnerabilities and guides them in prioritizing mitigation efforts that will strengthen their resilience through 6 stages.
Our work differs from these past conceptualization and modeling efforts in several important ways. Broadly speaking, past computational modeling efforts fall into 1 of 2 categories: static models of real places with real dataReference Cutter, Barnes and Berry 7 or dynamic models of virtual places with simulated data with a focus on socioeconomic recovery.Reference Miles and Chang 26 We have combined the best elements of both approaches to produce a dynamic model and results based on real places and data.
One key conclusion from this work was the inadequacy of existing measures available to populate the computational model. We had to make several compromises and do not consider the model output to be the best, final estimates of resilience at the county level. Measures were particularly lacking for engineered systems, preparedness, public health services, and natural systems. An important goal of future work will be to identify or develop better measures and a more systematic process for selecting and incorporating them into COPEWELL. Other important areas of future effort include the roles of emergence/improvisation, leadership, governance, and risk perception and how the model should change for different types of hazards. Finally, while the current computational model output can be used to compare between counties, the absolute values of resistance, recovery, and resilience require calibration of key model parameters (Figure S1 in the online data supplement) before attaching quantitative meaning to them.
Our model strongly suggests that communities can improve community functioning over time after an event by activities pre-event that go beyond traditional preparedness activities, such as reducing population vulnerability, improving access to social capital, fostering organizational networks and relationships, improving community social support, and planning for adaptation after events.Reference Norris, Stevens and Pfefferbaum 25 , Reference Burby, Deyle and Godschalk 27 There are a number of specific interventions in the literature to address these domains, which could be repurposed in the context of building disaster resilience.
The model’s domains and their dynamic interconnections represent what has been referred to as a network in the resilience literature, and the resulting dynamic system embodies the adaptive capacities also identified in the literature.Reference Norris, Stevens and Pfefferbaum 25 Of importance, the model incorporates emergent collective behavior,Reference Aguirre, Wenger and Vigo 28 , Reference Simpson and Willer 29 which is usually highly coordinated, effective, rational, and common after disasters. Such behavior manifests as the appearance of group-level creativity and efficacious improvisation peri- and post-event.Reference Kendra and Wachtendorf 30 - Reference Kendra and Wachtendorf 32 Any accurate model of community functioning in the disaster context needs to reflect such behavior. We used social cohesion as a predictive surrogate of this behavior, since it is generally recognized that community social cohesion facilitates the emergence of collective behavior.
Our approach overcomes several limitations of prior work. One flaw in dominant disaster planning models is the assumption that disasters are purely physical events, rather than understanding that disasters are also social events that impact different communities in different ways.Reference Jacob, Mawson and Payton 33 , Reference Wisner, Blaikie and Cannon 34 Risk of exposure and vulnerability to hazards varies depending on social system factors in addition to physical system factors.Reference Wisner, Blaikie and Cannon 34 Our conceptual model (like those of some others)Reference Norris, Stevens and Pfefferbaum 25 incorporates these social features of community, such as population vulnerability, inequality, and deprivation and social cohesion.
In our approach, community functioning is conceptualized as the organized, population-level services provided by the jurisdiction, which naturally leads to a characterization of higher baseline (pre-event) functioning for those counties that provide more services. This results in what some may see as a bias toward more urban compared with more rural counties; this bias taints discussions of urban versus rural resilience, especially when the functioning and resilience of individuals in rural communities is high. In our case, however, this seeming bias is not necessarily inaccurate or misleading, because of our focus on community-provided services, functioning, and resilience.
Limitations
This work had several limitations. First, as previously mentioned, is the paucity of adequate county-level measures collected nationwide and frequently enough to optimally represent the domains in our model. As an alternative, an expert-opinion-driven standardized scoring rubric for the domains could be considered, allowing a community to self-assess and enter values into the model. We also did not do any spatial smoothing, which could account for cross-jurisdictional aid and minimize the influence of arbitrary boundaries imposed by a county-level spatial scale. Such factors could be either positive (eg, regional hospitals, mutual aid compacts) or negative (eg, co-occurring events in multiple neighboring jurisdictions). The model also bundled targeted interventions into much broader terms (eg, flood insurance as an external resource). The model is not ready for all hazards, as we anticipate that specific components will be different for different events (eg, natural disasters vs pandemics).
There is a need for comprehensive model validation (ultimately, in the context of predictive accuracy) and evaluation of practical utility. Of note, the conceptual and computational models have been presented to the public health practice community in several settings and participating members agreed they had face validity for the stated goals. With respect to accuracy, our plan is to include both qualitative (case study-based) and quantitative assessments; the quantitative assessments will use historical disasters for which we can obtain data both before and after the event. With respect to utility, we have developed a candidate set of “use cases” that can be tested with policy-makers and practitioners.
CONCLUSIONS
We have described the development and initial results of a system dynamics model of community resilience. When complete, the goal is that the products of this work will address the needs of practitioners and policy-makers by providing: (1) a framework to facilitate consideration of resilience, (2) an assessment of the current state of community resilience across the nation, and (3) a decision-support tool to help identify effective and efficient interventions that build resistance and recovery.
SUPPLEMENTARY MATERIAL
To view supplementary material for this article, please visit https://doi.org/10.1017/dmp.2017.39


