


Central-line–associated bloodstream infections (CLABSIs) are a leading cause of healthcare-associated infections (HAIs).Reference Magill, O’Leary and Janelle1 They are associated with increased mortality, length of stay, and healthcare costs.2–Reference Ziegler, Pellegrini and Safdar6
The Centers for Medicare and Medicaid Services (CMS) require some types of healthcare facilities to report HAIs, including CLABSIs, to the Center for Disease Control and Prevention (CDC) National Healthcare Safety Network (NHSN), the largest HAI surveillance system in the United States, which then reports to CMS on behalf of the healthcare facilities. These requirements have expanded over time. On January 1, 2011, CMS mandated CLABSI reporting as a condition of participation in the CMS Hospital Inpatient Quality Reporting Program in both adult intensive care units (ICUs) and pediatric ICUs (PICUs).7 On January 1, 2015, CMS mandated CLABSI reporting for all adult and pediatric medical, surgical, and combined medical-surgical wards.8
Adoption of evidence-based infection prevention measures and other best practices, often rolled into bundles, and summarized in guidelinesReference Marschall, Mermel and Fakih9, Reference O’Grady, Alexander and Burns10 have resulted in decreased CLABSI incidence rates at individual facilities.Reference Blot, Bergs, Vogelaers, Blot and Vandijck11–Reference Pronovost, Goeschel and Colantuoni14 These decreases were reflected nationwide by a 50% decrease in CLABSIs from 2008 to 201415and a further 9% decrease from 2016 to 2017.16 However, ~24,000 CLABSIs were still reported by acute-care hospitals in 2017,16 showing that continued efforts to prevent CLABSIs are needed, including ensuring adherence to established prevention strategies as well as development of new interventions. Developing CLABSI prevention interventions targeting specific causative pathogens may be one such approach.
A better understanding of how CLABSI pathogen distribution has changed over time in different locations and the current predominant pathogens could inform prevention efforts. We analyzed nationwide CLABSI data from acute-care hospitals collected via the CDC NHSN to evaluate these questions.
Methods
CLABSI surveillance and reporting
Detailed descriptions of NHSN CLABSI surveillance methods are available.17 As currently defined, a bloodstream infection (BSI) is a positive blood culture growing a recognized pathogen (eg, Staphylococcus aureus) or at least 2 positive cultures (from separate blood draws collected on the same or consecutive days) growing a common commensal organism (eg, coagulase-negative staphylococci [CNS]) with at least 1 sign or symptom consistent with a BSI. Before 2013, 2 blood cultures drawn with no more than a single gap day between them could be used to classify a primary BSI associated with a common commensal organism. A primary BSI is a BSI event that is not secondary to infection at another body site. A CLABSI is a primary BSI occurring in a patient with a central venous catheter (CVC) in place on the day of or the day before the date of infection and the CVC has been in place >2 consecutive calendar days. In 2015, NHSN made changes to some HAI definitions including the urinary tract infection (UTI) and secondary BSI definitions that might impact the classification of BSIs as CLABSIs.18 These changes include excluding yeast, mold, dimorphic fungi and parasites as possible UTI pathogens, requiring a colony count of at least 100,000 CFU/mL for UTIs and utilizing a secondary BSI attribution period to determine the period during which a BSI can be considered secondary to another site.
For each CLABSI, facilities report the date of event and location to which the event is attributed. The definition of date of event has changed over time, primarily to quantify time frames during which all criteria must be met and reduce the opportunities to misclassify BSIs as secondary to another site of infection. Locations are classified according to the characteristics of patients present.19 Typically, 80% of the patients in a given location must match the typical patient population for it to be classified into a particular category. If not, then it is categorized as a more generalized location for a given acuity level. Up to 3 causative pathogens can be reported for each CLABSI.
Statistical analysis
We used data from CLABSIs that occurred from 2011 to 2017, were reported by acute-care locations, and met NHSN CLABSI surveillance definitions in place at the time of the date of event.
The NHSN acute-care locations were divided into 5 mutually exclusive patient care location groups: adult ICUs, PICUs, adult wards, pediatric wards, and oncology wards. Adult ICUs and PICUs included all critical care locations reporting to NHSN: medical, surgical, medical/surgical, and specialty ICUs, such as burn ICUs. Adult and pediatric wards included all wards reporting to NHSN (ie, medical, surgical, medical/surgical, and specialty wards such as neurology). Oncology wards included both pediatric and adult wards but not oncology ICUs. Critical access hospitals were included. We excluded data from locations that did not correspond to one of the aforementioned patient care location groups including neonatal intensive care units, step-down units, mixed acuity units, inpatient rehabilitation facilities, rehabilitation wards, specialty care areas, and long-term acute-care hospitals.
We divided pathogens into the following 6 categories based on prior literature showing they were a leading cause of CLABSIs or hypothesized modes of transmission: Enterobacteriaceae, gram-negative bacteria that originate primarily from environmental reservoirs (eg, Pseudomonas aeruginosa and Serratia marcescens), Enterococcus spp, S. aureus, CNS, and Candida spp/yeast. All pathogens that were not included in the prior 6 categories were grouped as “other” pathogens.
For CLABSIs with >1 pathogen, we counted each pathogen as a separate CLABSI event. For the pathogen categories, we calculated the distribution by year in each acute-care location group and reported these as percentages. We calculated the annual pooled mean pathogen-specific CLABSI incidence density rate per 1,000 central-line days by acute-care location group. Annual pooled mean CLABSI rates were reported for descriptive and referential purposes. To examine, temporal changes we used 3 different end-point comparisons, pathogen-specific CLABSI rates in 2011 and 2017 (beginning to end of time period), 2011 and 2014 (beginning of time period to NHSN 2015 definition changes), and 2015 and 2017 (time after NHSN 2015 definition change to the end of the study period). We calculated incidence rate ratios and 95% Wald confidence intervals (CIs). Statistical analyses were performed using SAS version 9.3 software (SAS Institute, Cary, NC).
To evaluate whether our findings could be explained, at least in part, by migration into or out of the surveillance network, a sensitivity analysis was conducted using data from continuous reporters, defined as units that participated in CLABSI surveillance for at least 1 month in each analysis year (2011–2017).
The CDC Ethical Review Board has previously determined that the reporting of HAI data to NHSN is surveillance and not research; therefore, it is not subject to institutional review board requirements. Our report was within the scope of routine surveillance activities and therefore was not subject to further institutional review.
Results
Participating facilities and locations
In 2011, 3,624 facilities participated in NHSN CLABSI surveillance for at least 1 month during the year, increasing to 4,502 in 2017 (Table 1). Adult ICUs and wards have the highest number of reporting locations with 3,313 and 4,325, respectively, in 2017. Between 2014 and 2015, the number of adult, and pediatric, wards increased corresponding to new reporting mandates. Central-line days reported from these locations increased correspondingly. From 2011 to 2017, 136,264 CLABSIs were reported to the NHSN; adult ICUs and wards reported the most CLABSIs: 59,461 (44%) and 40,763 (30%), respectively.
Table 1. Acute-Care Facilities and Locations Participating in National Healthcare Safety Network (NHSN) Central-Line–Associated Bloodstream (CLABSI) Surveillance, 2011–2017
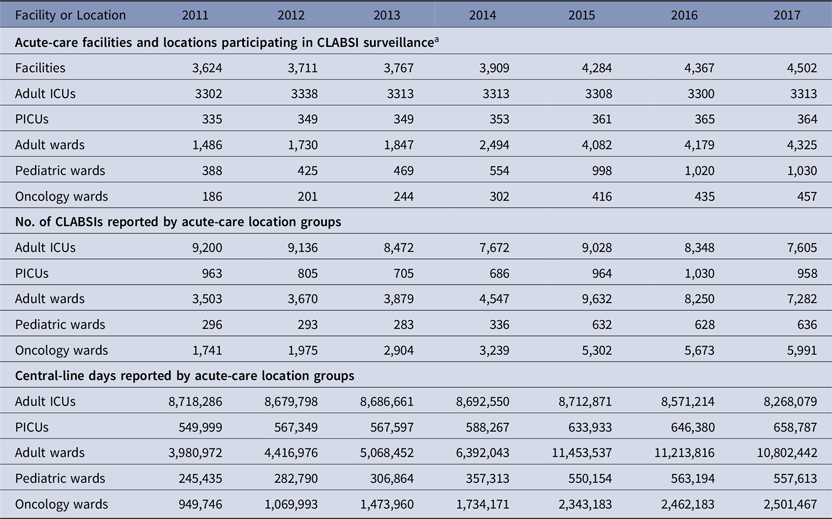
Note. CLABSI, central-line–associated bloodstream infection; ICU, intensive care unit; PICU, pediatric intensive care unit; NHSN, National Healthcare Safety Network.
a Reported at least 1 month of central-line days during given year.
ICU location groups
Adult ICUs. The percentage of CLABSIs for which each of the pathogen groups was reported is shown in Figure 1. In 2017, Candida spp/yeast made up the largest proportion, followed by Enterococcus spp and then Enterobacteriaceae. Candida spp/yeast and CNS accounted for a larger proportion of CLABSIs in adult ICUs than any other location group.

Fig. 1. Central-line–associated bloodstream infection (CLABSI) pathogen categories by acute-care location groups, 2017. Note. CNS, coagulase-negative staphylococci; Env, environmental; ICU, intensive care unit; PICU, pediatric intensive care unit.
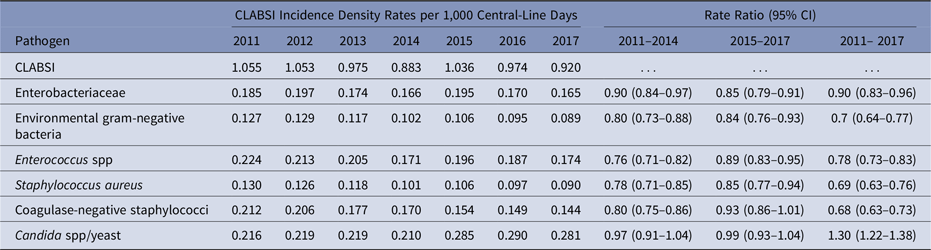
Among unadjusted pathogen-specific CLABSI rates, Candida spp/yeast was the only pathogen group to increase from 2011 to 2017 (rate ratio [RR], 1.30; 95% confidence interval [CI], 1.22–1.38) (Table 2). Rates for the other pathogen groups decreased, and the greatest reductions were identified for S. aureus, CNS, and environmental gram-negative bacteria.
Table 2. Yearly Pathogen-Specific Central-Line–Associated Bloodstream Infection (CLABSI) Incidence Density Rates per 1,000 Central-Line Days (2011–2017) and Incidence Rate Ratios in Adult Intensive Care Units
PICUs. Enterobacteriaceae were reported from the largest proportion of CLABSIs, ~25% in 2017 (Fig. 1), followed by Enterococcus spp, environmental gram-negative bacteria, and S. aureus. Enterococcus spp and environmental gram-negative bacteria each made up a larger proportion of CLABSIs in the PICU than in any other location group.
Unadjusted rates of CNS and Candida spp/yeast fell from 2011 to 2017 (Table 3). The greatest reductions were identified for CNS.
Table 3. Yearly Pathogen-Specific Central-Line–Associated Bloodstream Infection (CLABSI) Incidence Density Rates per 1,000 Central-Line Days (2011–2017) and Incidence Rate Ratios in Pediatric Intensive Care Units

Ward location groups
Adult wards. In 2017, Enterobacteriaceae made up the largest proportion of CLABSIs (23%) (Fig. 1). The pathogen group with the second-highest proportion was S. aureus (16%). From 2011 to 2017, unadjusted CLABSI rates decreased for all pathogen groups and CNS had the largest decrease (Table 4).
Table 4. Yearly Pathogen-Specific Central-Line–Associated Bloodstream Infection (CLABSI) Incidence Density Rates per 1,000 Central-Line Days (2011–2017) and Incidence Rate Ratios in Adult Wards

Pediatric wards. In 2017, Enterobacteriaceae were reported from a larger percentage of CLABSIs than any other pathogen group (31%) (Fig. 1). No other pathogen group accounted for >14% of CLABSIs. Enterobacteriaceae also made up a larger proportion of CLABSIs from pediatric wards than from any other location (except oncology wards where the proportion remained the same). Unadjusted pathogen-specific rates were all unchanged (Table 5).
Table 5. Yearly Pathogen-Specific Central-Line–Associated Bloodstream Infection (CLABSI) Incidence Density Rates per 1,000 Central-Line Days (2011–2017) and Incidence Rate Ratios in Pediatric Wards

Oncology wards. In 2017, Enterobateriaceae accounted for the largest proportion of CLABSIs (31%) (Fig. 1). “Other” pathogens were the second-highest group at 25%. Among the “other” pathogens, 42% were viridans group streptococci (VGS). From 2011 to 2017, Enterobacteriaceae rates increased (RR, 1.55; 95% CI, 1.40–1.71) (Table 6). Rates of other pathogen groups remained unchanged except VGS, which also increased (RR, 2.33; 95% CI, 1.91–2.84).
Table 6. Yearly Pathogen-Specific Central-Line–Associated Bloodstream Infection (CLABSI) Incidence Density Rates per 1,000 Central Line-Days (2011–2017) and Incidence Rate Ratios in Oncology Wards

Continuous reporters
Our sensitivity analyses limited to continuous reporters were consistent with the findings reported above, including pathogen percentage and pathogen-specific CLABSI rates in adult and pediatric location groups.
Discussion
This report describes CLABSI pathogen distribution in 2017 and rates in acute-care location groups from 2011 to 2017. Overall, the pathogen distribution varied by location group; Enterobacteriaceae was the most commonly reported pathogen group in all locations except adult ICUs, for which the most commonly reported pathogen group was Candida spp/yeast. Incidence density rates also varied over the study period. Most pathogens in adult locations decreased; exceptions include Candida spp/yeast in adult ICUs and Enterobacteriaceae in oncology wards, which both increased. In PICUs, only CNS and Candida spp/yeast decreased, and in other pediatric locations, pathogen groups did not change.
This evaluation yielded several notable findings. First, this analysis reinforces the important role that Enterobacteriaceae have as a cause of BSIs. Enterobacteriaceae made up the largest pathogen group in all location groups except adult ICUs. In addition, only 1 of 2 pathogen group and location combinations increased between 2011 and 2017; the rate ratio for Enterobacteriaceae CLABSIs from oncology wards increased 50% during that time. This finding is particularly concerning in light of the emergence and spread of highly resistant Enterobacteriaceae, including extended-spectrum β-lactamases (ESBL)–producing and carbapenemase-producing strains.
Novel interventions targeting resistant gram-negative bacteria are being evaluated including selective decontamination of the digestive tract (SDD); however, recent data have suggested that this method might be less effective than originally thought.Reference Wittekamp, Plantinga and Cooper20 Other interventions designed to reduce the carriage of gram-negative bacteria in the gastrointestinal tract, including manipulation of the patient’s microbiome, may have potential for reducing Enterobacterial infections. Colonization with these organisms has been shown to increase the risk of subsequent HAIs including gram-negative bacteremias.Reference Frencken, Wittekamp and Plantinga21 Although some studies have shown chlorhexidine gluconate (CHG) bathing to be effective in reducing gram-negative HAIs,Reference Cassir, Thomas and Hraiech22 if done poorly, this intervention might have less effect on gram-negative bacteria due to suboptimal levels of CHG on the skin as well as the potential for reduced susceptibility of some of these bacteria to this antiseptic.Reference Lin, Lolans and Blom23 A recent meta-analysis concluded CHG bathing had no effect on gram-negative infections.Reference Patel, Parikh and Dunn24 More information is needed to better define why some patients are at risk and to develop prevention strategies targeted at Enterobacteriaceae.
A second notable finding is the substantial contribution of Candida spp/yeast to CLABSIs, particularly in adult ICUs. The rate of Candida spp/yeast CLABSIs in adult ICUs has increased since 2011, and this increase is, at least in part, related to the 2015 NHSN urinary tract infection definition changes. BSIs that were previously classified as secondary to another source (ie, the urinary tract) became reclassified as primary BSIs and potentially CLABSIs because yeast are no longer considered eligible organisms for UTIs. However, other evaluations have identified Candida spp as an important cause of BSIs, including a CDC-led 2015 point prevalence survey of acute-care locations that found Candida spp to be the second most common cause of primary BSIs.Reference Magill, O’Leary and Janelle1 In our analysis, Candida spp/yeast were reported from >25% of CLABSIs in the ICU but smaller proportions of CLABSIs from the other locations (6%–11%). Rates fell in adult wards and PICUs and were unchanged in oncology and pediatric wards.
Historically, Candida BSIs have often been thought to be related to translocation from a gastrointestinal sourceReference Nucci and Anaissie25 in which case interventions aimed at CVC insertion and maintenance practices might be expected to have less of an effect. Notably, the emergence of Candida auris, which has been shown to persist in the healthcare environment, has raised the possibility that the environment might play a role in spread and subsequent HAIs for other non-albicans Candida spp.Reference Piedrahita, Cadnum, Jencson, Shaikh, Ghannoum and Donskey26 The CDC has recognized improved environmental cleaning in healthcare as a critical area for addressing HAIs and spread of resistant organisms and has instituted several important initiatives designed to improve these processes.27
Prior reports showed a decrease in S. aureus CLABSI rates in the early 2000s, primarily in adult ICUs,Reference Fagan, Edwards, Park, Fridkin and Magill28–Reference Li, Fortin and Tremblay30 largely due to the widespread uptake of evidence-based central-line care bundles that focus mainly on insertion practices. However, PICUs did not see the same improvement.Reference Fagan, Edwards, Park, Fridkin and Magill28 Rates continued to decline from 2011 to 2017 in adult locations, but rates in pediatric and oncology locations did not change. Reasons for this are unclear and might be related to limited infection prevention and control practices evidence-base in the pediatric populationReference Bender, Virgallito and Newland31–Reference Klieger, Potter-Bynoe, Quach, Sandora and Coffin34 and differential uptake of practices such as CHG bathing across different patient groups and in different locations (eg, wards vs ICUs).
Rates of CLABSIs due to CNS decreased in all locations except for pediatric wards, and the decreases over the entire period were larger for CNS than any other pathogen in 3 of the 4 locations where rates decreased. This might be, at least in part, due to increased attention to CVC insertion and maintenance practices. In addition, increased use of CHG bathing could also have contributed to declines in CLABSIs due to skin commensals like CNS; however, reductions occurred even outside of adult ICUs, the setting where CHG bathing has been most widely recommended. In the REDUCE MRSA trial, the reductions in BSIs in the group undergoing universal decolonization were, in large part, due to reductions in gram-positive skin commensals.Reference Huang, Septimus and Kleinman35 In a subanalysis of that project, the largest reduction in blood culture contamination rates was seen in the CHG bathing group.Reference Septimus, Hayden and Kleinman36 Notably, CLABSIs due to S. aureus did not decrease in the same locations; other interventions may have played a larger role in the reduction in CNS CLABSIs in some locations. For example, a renewed focus on blood culture collection practices might have played a role in this result. Implementing practices like phlebotomy teams with specialized training for blood culture collection has resulted in reductions in contamination from skin commensals like CNS.Reference Boyce, Nadeau and Dumigan37, Reference Snyder, Favoretto and Baetz38
Finally, environmental gram-negative bacteria were associated with a sizable proportion of CLABSIs. The proportion in most locations was similar to that seen with S. aureus, which is a more commonly recognized cause of CLABSI. These organisms can often be associated with exposure to water.Reference Kanamori, Weber and Rutala39 Interventions aimed at improving water quality in healthcare settings through the development and implementation of water management programs have the potential to impact this proportion of CLABSIs.40 In addition, decreasing environmental contamination through improved cleaning and disinfection of surfaces around sinks and sink bowls and by keeping supplies outside of the sink splash zone are important ways to minimize exposure to these pathogens.
This analysis was subject to several important limitations. Small numbers of facilities reported CLABSIs in some acute-care location groups, particularly earlier in the surveillance period. We cannot exclude that migration into or out of the surveillance system impacted our findings. However, our sensitivity analysis of continuous reporters revealed the same predominant pathogens and rates over time as the primary analysis. We did group pathogens and locations, which may have obscured or amplified some pathogen rankings. We reported raw frequencies, distributions, and rates; we did not control for some factors that might influence particular pathogens, such as hospital type, bed size, and teaching status. We were unable to describe adherence to evidence-based CVC insertion and maintenance practices or to analyze the impact of particular practices such as blood culture collection site selection or water management programs on CLABSI reduction. We did not make statistical comparisons of pathogen differences between locations. Only the absolute differences in pathogen percentages were reported, so this report does not provide definitive conclusions regarding pathogen differences between locations. Finally, changes in surveillance definitions and reporting mandates over time may have affected the number of CLABSIs and types of pathogens ultimately classified as CLABSIs.
Great strides have been made in reducing CLABSIs over the last decade, but further reductions in these serious infections are needed including work to ensure implementation of proven interventions around CVC insertion and maintenance. In locations that are adhering routinely to these interventions but are still having higher than expected CLABSIs, additional novel solutions for CLABSI prevention may be needed. Better understanding the pathogen distribution can help identify emerging trends and issues that might inform more targeted pathogen-specific prevention strategies leading to further reductions in these highly morbid infections. Prevention strategies for some pathogen groups are not currently well defined. For some pathogen groups, such as Enterobacteriaceae and Candida spp/yeast, we need to better understand why patients are at risk for CLABSIs from these pathogens and work toward more targeted prevention strategies that could augment current prevention efforts.
Acknowledgments
We thank the NHSN participants for their efforts to monitor infections and improve patient safety. The findings and conclusions in this article are those of the authors and do not necessarily represent the official position of the US Centers for Disease Control and Prevention.
Financial support
No financial support was provided relevant to this article.
Conflicts of interest
All authors report no conflicts of interest relevant to this article.


