


Introduction
Although psychiatric diagnostic systems (e.g. DSM-IV; APA, 1994) conceptualize mania and associated bipolar disorder phenomenology as categorical, there have been no appropriate latent structure investigations conducted to support or refute this conceptualization. In contrast to the DSM, most influential theories of mania and bipolar disorders have suggested a dimensional conceptualization of these constructs. For example, Kraepelin (Reference Kraepelin1921) proposed that affective temperaments form the constitutional foundation for manic-depressive illness, and observed that non-disordered relatives of manic-depressive patients frequently exhibited these temperaments. Intellectual descendants of Kraepelin have subsequently provided empirical evidence to support the validity of a continuous conceptualization of manic-depressive illnesses (e.g. Judd & Akiskal, Reference Judd and Akiskal2003; Merikangas et al. Reference Merikangas, Akiskal, Angst, Greenberg, Hirschfeld, Petukhova and Kessler2007). Aside from the theoretical importance of identifying the latent structure of mania, there are concerns associated with potentially incorrectly conceptualizing mania as a categorical construct, including statistical problems (e.g. attenuated statistical power; Cohen, Reference Cohen1983), spurious psychiatric co-morbidity (Haslam, Reference Haslam2003) and inappropriate denial of treatment services.
Appropriate statistical methodologies for determining whether mania is a categorical or dimensional construct include taxometrics (Waller & Meehl, Reference Waller and Meehl1998) and information-theoretic latent distribution modeling (ITLDM; Markon & Krueger, Reference Markon and Krueger2006). Using multiple latent structure methodologies to investigate the continuous versus discrete nature of a construct has long been recommended, but is rarely done in practice (Lenzenweger, Reference Lenzenweger2004). No taxometric or ITLDM studies have examined mania or bipolar disorders, although Meyer & Keller (Reference Meyer and Keller2003) have conducted a taxometric investigation of hyperthymic temperament. Their study had several methodological issues (e.g. use of a single taxometric procedure) but nonetheless found evidence for a continuous latent structure.
Although ITLDM and taxometric analyses are crucial to determining whether mania is a categorical or dimensional construct, the results from such analyses can be misleading due to flaws in study design (Grove, Reference Grove, Cicchetti and Grove1991) or limitations of the analytic procedures (Ruscio et al. Reference Ruscio, Ruscio and Keane2004). Consequently, researchers have argued that latent structural findings are provisional until their meaning has been clarified through construct validation (Waldman & Lilienfeld, Reference Waldman and Lilienfeld2001; Watson, Reference Watson2003), and have provided examples of structural findings that do not survive such scrutiny (e.g. schizoid taxon; Nichols & Jones, Reference Nichols and Jones1985; dissociative taxon; Watson, Reference Watson2003).
One approach to evaluating the construct validity of taxometric and ITLDM findings is to compare the relative abilities of multiple discrete and continuous models of mania to predict theoretically relevant constructs. If mania is continuous, it should demonstrate superior predictive ability relative to a discrete model because of the loss of statistical power associated with dichotomizing a continuous variable (Cohen, Reference Cohen1983). Alternatively, if mania is discrete, then discrete models of the construct should out-predict continuous models because the extra variability afforded by continuous models would represent measurement error that would attenuate statistical relationships (Ruscio et al. Reference Ruscio, Haslam and Ruscio2006). Two previous studies have used this methodology to examine the construct validity of discrete and continuous models of depression (Aggen et al. Reference Aggen, Neale and Kendler2005; Prisciandaro & Roberts, Reference Prisciandaro and Roberts2009). Both studies found that discrete models of depression did not significantly predict relevant outcomes once continuous models of depression were statistically controlled.
The present study is the first to properly evaluate whether mania is a discrete or continuous construct. Given the various criticisms that have been raised regarding using taxometrics as a standalone methodology (e.g. lack of agreement over implementation decisions), the present investigation used an expanded, comprehensive approach to examine the latent structure of mania. In Part I of the present study, both taxometric and ITLDM analyses were conducted on the manic symptom data from the Epidemiologic Catchment Area (ECA) program (Eaton & Kessler, Reference Eaton and Kessler1985). In Part II of this study, an examination of the construct validity of taxometric and ITLDM findings was performed by testing the relative predictive abilities of various discrete and continuous models of mania.
Part I Method
Sample and measure
Data from the ECA program (Eaton & Kessler, Reference Eaton and Kessler1985) were obtained from a representative group of over 20 000 individuals by probability sampling of five geographic catchment areas. Participants were administered the Diagnostic Interview Schedule (DIS; Robins et al. Reference Robins, Helzer, Croughan and Ratcliff1981) in the first wave of the ECA program, which included an assessment of manic symptoms (in accordance with DSM-III criteria; APA, 1980) over various recall periods (e.g. past 2 weeks, lifetime). Symptoms assessed from 2 weeks prior to participants' interviews were used because these data are minimally affected by long-term recall biases, and because it is clear that reported symptoms occurred during the same time period. The DIS contained nine dichotomous questions designed to assess symptoms of mania. These questions were collapsed into the eight diagnostic criteria of a Manic Episode [elevated or expansive mood (‘elevated mood’)Footnote 1Footnote †, increased activity or physical restlessness (‘increased activity’), increased talkativeness or pressured speech (‘talkativeness’), flight of ideas or racing thoughts (‘racing thoughts’), inflated self-esteem or grandiosity (‘grandiosity’), decreased need for sleep (‘decreased sleep’), distractibility, and excessive involvement in activities with high potential for painful consequences (‘risky behavior’); APA, 1980] using syntax provided with the ECA data. Because of the probing structure of the DIS, an affirmative response to each symptom question indicated that the symptom did not only occur following drug or alcohol use. Test–retest reliability of diagnoses of Manic Episodes made using the DIS have been found to be acceptable (κ=0.56; Semler et al. Reference Semler, Wittchen, Joschke, Zaudig, Vongeiso, Kaiser, von Cranach and Pfister1987). Concordance between diagnoses of Manic Episodes made by lay interviewers and psychiatrists using the DIS have also been found to be acceptable (κ=0.65; Robins et al. Reference Robins, Helzer, Croughan and Ratcliff1981, Reference Robins, Helzer, Ratcliff and Seyfried1982). Finally, concordance between DIS diagnoses of Manic Episodes and diagnoses based on semi-structured clinical interviews have been found to be good in clinical populations (κ=0.63; Helzer et al. Reference Helzer, Robins, McEvoy, Spitznagel, Stoltzman, Farmer and Brockington1985; κ=0.86; Wittchen et al. Reference Wittchen, Semler and von Zerssen1985).
Although all ECA participants were administered all manic symptom questions, a subsample (n=10 105) was selected from the ECA data for methodological reasons. Included participants belonged to the community sample (institutionalized individuals were excluded because their inclusion could have produced a spurious taxon; Grove, Reference Grove, Cicchetti and Grove1991), were assessed for past 2-week symptoms, and completed the interview. The remaining sample contained more females than males [unweighted (weighted): 58.6% (53.2%) v. 41.4% (46.8%)], was predominantly White [unweighted (weighted): 56.8% (54.1%), 25.8% (22.7%) Black, 13.3% (17.3%) Hispanic, 1.7% (2.7%) Asian, 0.8% (0.9%) American Indian, and 1.6% (0.5%) other], and ranged in age from 18 to 96 years, with a mean age of 46 (unweighted; weighted=41.9) years. The base rate of Manic Episodes was: lifetime (observed n=50) 0.49% (unweighted; weighted=0.46%); past 2 weeks (observed n=15) 0.15% (unweighted; weighted=0.16%). Missing data were negligible (2.2%) and were list-wise deleted (Kline, Reference Kline2005).
Analytic strategy
Taxometric analyses were conducted using Ruscio's taxometric programs (Ruscio et al. Reference Ruscio, Haslam and Ruscio2006) for the R platform (R Development Core Team, 2009). All other analyses were conducted using MPlus version 5.1 (Muthén & Muthén, Reference Muthén and Muthén2007).
Preliminary dimensionality analyses
Incorrectly specifying mania as unidimensional versus multidimensional can create difficulties in interpreting ITLDM results (Markon & Krueger, Reference Markon and Krueger2006). To address this potential difficulty, factor analyses were conducted. The sample was randomly divided into two equal subsamples. Exploratory factor analysis (EFA) was conducted on the first subsample, using the weighted least squares mean and variance adjusted (WLSMV) estimator (Muthén, Reference Muthén1989). A sample weight was applied to adjust for systematic non-response and differential selection probabilities. The number of factors to extract was determined by parallel analysis (Horn, Reference Horn1965) with 1000 sets of random data. The results from the EFA model were used to construct a confirmatory factor analysis (CFA) model in the second subsample using WLSMV estimation. In addition to the above-mentioned sample weight, information regarding the stratification and clustering of the data was also modeled (Muthén, Reference Muthén2004). CFA model fit was evaluated according to Hu & Bentler's (Reference Hu and Bentler1999) guidelines [Comparative Fit Index (CFI) >0.95, Tucker–Lewis Index (TLI) >0.95, root mean square error of approximation (RMSEA) <0.05].
Taxometrics
Taxometric statistical methods have consistently demonstrated their ability to determine whether a construct has a discrete or a continuous latent structure (Meehl, Reference Meehl and Meehl1973; Meehl & Yonce, Reference Meehl and Yonce1994, Reference Meehl and Yonce1996; Ruscio, Reference Ruscio2000). Rigorous taxometric investigations include multiple non-redundant procedures, additional consistency checks, and simulation techniques (Ruscio et al. Reference Ruscio, Haslam and Ruscio2006). Although the ECA data have several strengths for taxometrics (e.g. large sample size, unselected sample), they also present several challenges. Specifically, the items available for the present analysis were dichotomous with sparse endorsement, and the hypothesized manic taxon had a very low base rate. Regarding the former concern, research has demonstrated that, given a large sample size (Ruscio, Reference Ruscio2000) and proper implementation of analytic techniques (e.g. use of simulations and the inchworm consistency test; Waller & Meehl, Reference Waller and Meehl1998; Ruscio et al. Reference Ruscio, Ruscio and Keane2004; Ruscio & Marcus, Reference Ruscio and Marcus2007), taxometric procedures are able to validly distinguish between discrete and continuous structures. Regarding the latter concern, simulation research has demonstrated that, with sufficient inclusion of taxon members along with a large sample size, taxometric procedures can detect base rates as low as 0.1–0.3% (Ruscio & Ruscio, Reference Ruscio and Ruscio2004 b). Ultimately, suitability for taxometric analysis was determined by simulating many sets of taxonic and dimensional data (Ruscio & Kaczetow, Reference Ruscio and Kaczetow2008); if the taxometric results from simulated taxonic and dimensional data could be distinguished from one another, then the data were suitable for analysis.
MAXCOV (MAXimum COVariance; Meehl & Yonce, Reference Meehl and Yonce1996) was conducted on all possible input/output indicator configurations. Summed input indicators were not used because recent evidence suggests that using them for MAXCOV results in significantly less accurate results (Walters & Ruscio, Reference Walters and Ruscio2009). Subsamples were created by dividing the sample into a large number of overlapping windows (i.e. 986 to 3944; derived using formula 6.5 in Ruscio et al. 2006, p. 138), with 90% overlap to allow for the inchworm consistency test and to provide more interpretable results (Ruscio et al. Reference Ruscio, Haslam and Ruscio2006). Ten internal replications were implemented in each run, and all MAXCOV curves were combined by averaging the covariance estimates for each subsample. The MAMBAC (Means Above Minus Below A Cut; Meehl & Yonce, Reference Meehl and Yonce1994) was also conducted. Summed input indicators were used, and the first and last cuts were made 25 cases from each input indicator's distributional tails (Ruscio & Ruscio, Reference Ruscio and Ruscio2004 a). Internal replications were implemented as described above. To improve interpretability (Ruscio et al. Reference Ruscio, Haslam and Ruscio2006), the number of cuts for MAMBAC was held equal to the maximum number of overlapping windows used for MAXCOV (i.e. 3944). MAMBAC was repeated until all indicators had served as output, and curves were combined by averaging mean-difference estimates at each cut along the input indicators.
Supplementary consistency tests included base rate divergence (Ruscio & Ruscio, Reference Ruscio and Ruscio2004 b) and the case removal consistency test (Ruscio, Reference Ruscio2000). The inchworm consistency test was also conducted by repeating MAXCOV analyses several times with each successive run containing an increased number of overlapping windows (Waller & Meehl, Reference Waller and Meehl1998). Finally, the comparison of simulated taxonic and dimensional data and observed data was used as an interpretational tool in addition to a consistency test (Ruscio & Kaczetow, Reference Ruscio and Kaczetow2008). Taxonic data were simulated using a modification to the base rate classification method (Ruscio, Reference Ruscio2009); individuals with the highest total item scores were assigned to the taxon based on the observed base rate of past 2-week Manic Episodes in the present sample. One hundred sets of taxonic and dimensional data were generated and submitted to the same analyses as the research data. Results from the research data were compared to results from simulated taxonic and dimensional data both visually and using fit indices (i.e. the comparison curve fit index; CCFI). CCFI values >0.60 support taxonic structure, values <0.40 support dimensional structure, and values between 0.40 and 0.60 are interpreted as ambiguous (Ruscio et al. Reference Ruscio, Ruscio and Meron2007 a).
ITLDM
ITLDM (Markon & Krueger, Reference Markon and Krueger2006) consists of estimating a variety of latent class (LCM) and latent trait (LTM) models using logistic modeling, and subsequently comparing their parsimony-adjusted fit using Bayesian Information Criteria (BIC). Specifically, (nominal) LCMs with between 2 and k classes (where k=8=number of indicators); LTMs (i.e. ‘discrete metrical’) with between 2 and k latent values [with each model distributed according to a binomial distribution, B(k−1, 0.5), rescaled to a mean of 0 and a standard deviation (s.d.) of 1]; and a continuous normally distributed LTM were estimated. In addition to information regarding the stratification and clustering of the data, a sample weight was included to properly model the complex sample design of the data. Comparisons between LTMs with few versus many latent values evaluated the relative fit of discrete metrical and continuous models, respectively. Furthermore, comparisons between LTMs and LCMs with the same number of values/classes evaluated whether the target construct consisted of ordered or unordered categories. For each comparison, the exponential of 0.5 times the negative BIC difference between the two models was interpreted as the posterior odds of one model over the other (Raftery, Reference Raftery1995). Descriptively, a BIC difference of 0–2 equals ‘weak’ evidence, 2–6 equals ‘positive’ evidence, 6–10 equals ‘strong evidence’, and >10 equals ‘very strong’ evidence in favor of the model with the lower BIC value (Raftery, Reference Raftery1995).
Part I Results
Preliminary dimensionality analyses
Parallel analysis suggested that only one interpretable factor could be extracted from the data. Thus, a one-factor model was estimated in the first subsample, which provided a good fit to the data (χ2=9.79, df=11, p=0.55; RMSEA=0.00). The unidimensional CFA model constructed from these findings in the second subsample provided a good fit to the data (χ2=20.25, df=11, p=0.04; CFI=0.96, TLI=0.96, RMSEA=0.01). All factor loadings were statistically significant (mean loading=0.58, mean r 2=0.37).
Taxometrics
Indicator validity was excellent (mean indicator validity=5.26; Meehl, Reference Meehl1995) and within-class correlations were low (mean absolute value of r=0.04; Meehl, Reference Meehl1995). MAXCOV and inchworm consistency test plots are presented in Fig. 1. MAXCOV results were all consistent with a dimensional solution: in all cases, the line representing the results from the research data fit within ±1 s.d. from the average results for simulated dimensional data, and fell on or outside of the boundaries of ±1 s.d. from the average results for simulated taxonic data. CCFI values confirmed this superior fit, ranging from 0.26 to 0.30 (mean 0.28). Averaged MAMBAC results are presented in Fig. 2, along with averaged results from simulated taxonic and dimensional data. The averaged research curve resembles both the simulated dimensional and taxonic curves. The associated CCFI value was also ambiguous (CCFI=0.45).
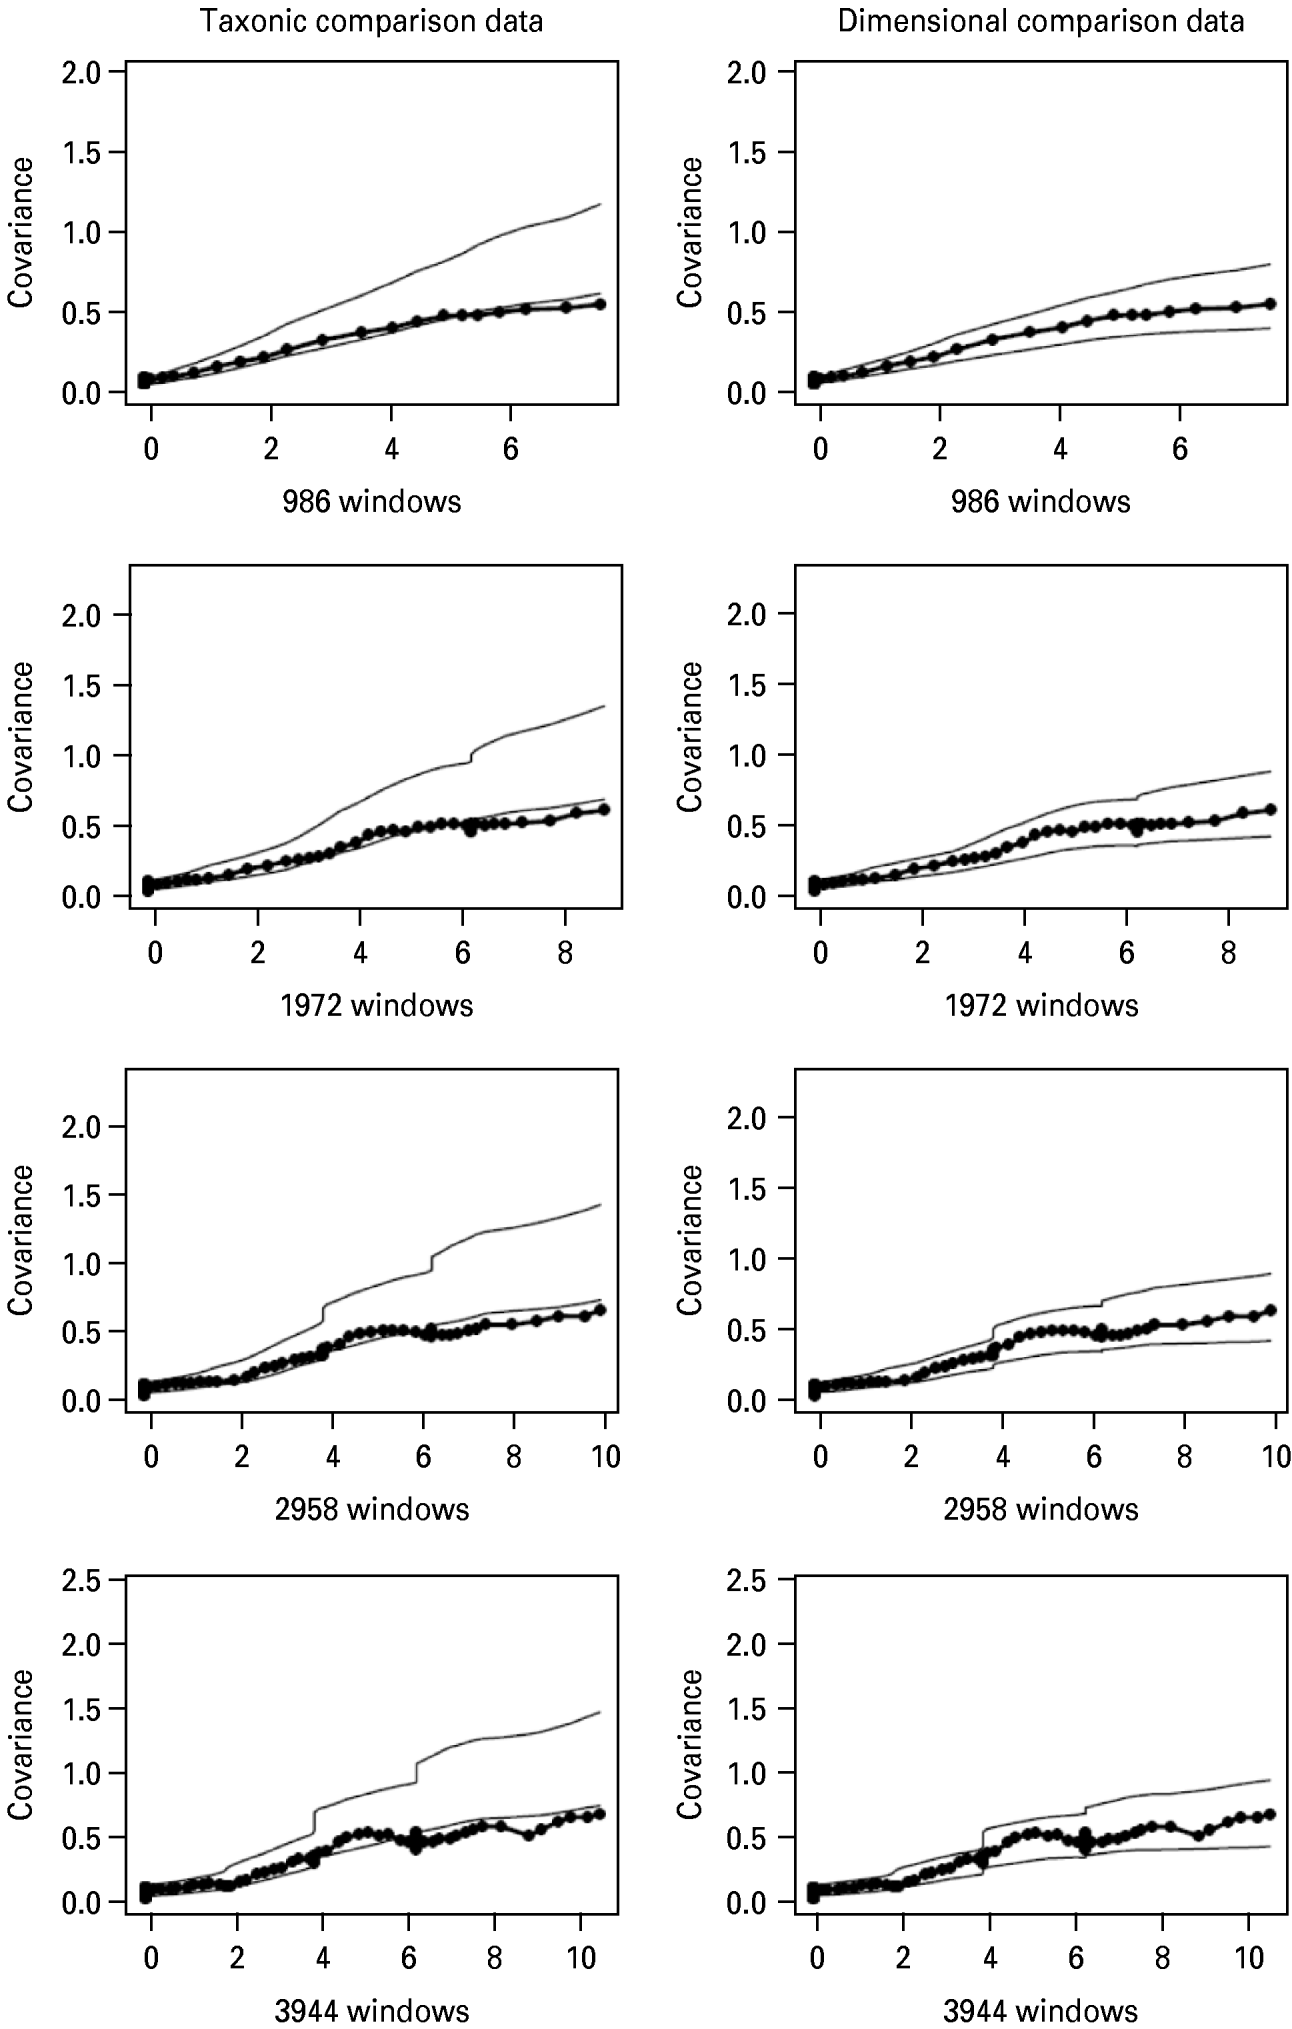
Fig. 1. Averaged maximum covariance (MAXCOV) results overlaying lines that represent ±1 s.d. from the average results for simulated taxonic (left) and dimensional (right) data. Plots in each successive row contain an increased number of overlapping windows: 986, 1972, 2958, 3944.
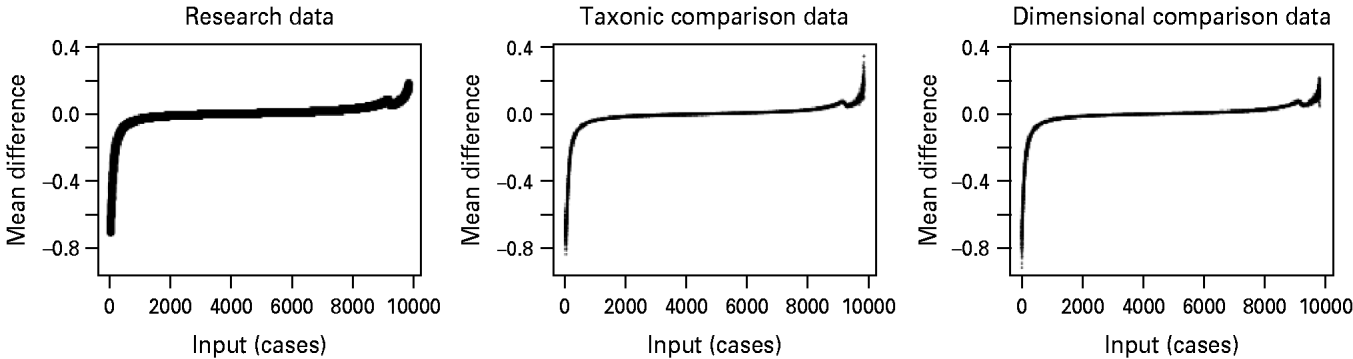
Fig. 2. Averaged means above minus below a cut (MAMBAC) results from research data (far left), simulated taxonic data (center), and simulated dimensional (far right) data.
Consistent with a dimensional interpretation, mean base rate estimates produced by MAXCOV (mean=0.24, s.d.=0.30) and MAMBAC (mean=0.77, s.d.=0.43) analyses were divergent. Further suggesting a dimensional interpretation, following targeted case removal, deviations from predicted base rate increases were substantial (MAXCOV deviation=0.10; MAMBAC deviation=0.77) and in the opposite direction than would be predicted by the presence of a taxonFootnote 2.
ITLDM
ITLDM results are presented in Table 1. The two estimated models with the best relative fit to the data were the standard normal LTM (BIC=9531.07) and the two-class LCM (BIC=9534.82). The BIC difference between the two-class LCM and the standard normal LTM (3.75) corresponded to ‘positive’ evidence in favor of the LTM. In other words, the odds of the LTM over the two-class LCM were 6.52:1.
Table 1. Fit criteria for discrete and continuous models of mania

k, Number of parameters; ln(L), log likelihood; BIC, Bayesian Information Criterion.
To guard against the possibility of spurious continuous findings, all analyses were repeated for lifetime symptom data that contained a larger number, and higher base rate, of hypothesized taxon members. These analyses also supported a continuous conceptualization of maniaFootnote 3. In sum, all taxometric and ITLDM results supported a dimensional interpretation of mania in the ECA data.
Part II Introduction
Part II of the present study evaluated the relative predictive abilities of discrete and continuous models of mania using the methodology detailed in Prisciandaro & Roberts (Reference Prisciandaro and Roberts2009). Two sets of model comparisons were made across outcomes: (1) between empirically derived discrete and continuous models from Part I of the present study and (2) between rationally selected discrete and continuous models. For the rationally selected continuous model, we created a single additive scale of mania with each manic symptom contributing 1 point. For the discrete model, we chose the predominant diagnostic model of mania: DSM Manic Episodes.
Three types of outcomes (i.e. dependent variables) were selected for predictive analyses: (1) psychiatric health service utilization, which is elevated among individuals with bipolar disorders (Weissman et al. Reference Weissman, Bruce, Leaf, Florio, Holzer, Robins and Regier1991; Merikangas et al. Reference Merikangas, Akiskal, Angst, Greenberg, Hirschfeld, Petukhova and Kessler2007); (2) psychiatric disorders, which are highly co-morbid with bipolar disorders (Kessler et al. Reference Kessler, Rubinow, Holmes, Abelson and Zhao1997; McElroy et al. Reference McElroy, Altshuler, Suppes, Keck, Frye, Denicoff, Nolen, Kupka, Leverich, Rochussen, Rush and Post2001); and (3) suicidal behavior, which is elevated among individuals with bipolar disorders (Sharma & Markar, Reference Sharma and Markar1994; Kessler et al. Reference Kessler, Borges and Walters1999; Kallner et al. Reference Kallner, Lindelius, Petterson, Stockman and Tham2000).
The main criterion used to evaluate models' relative predictive abilities was whether the discrete model of mania predicted unique variance in outcomes once the continuous model was statistically controlled (and vice versa).
Part II Method
Sample
The sample for Part II of the present study was the same as for Part I. Missing data were negligible (4.2%) and were list-wise deleted (Kline, Reference Kline2005).
Discrete and continuous models of mania
Empirically derived models
The best-fitting continuous and discrete models of mania from Part I ITLDM analyses were selected for subsequent predictive analyses (see Table 2 for model parameters). As reported in Part I, the best-fitting continuous model was the unidimensional, standard normal LTM (BIC=9531.07). All factor loadings were statistically significant (mean loading=0.69, mean R 2=0.48). This model was represented as a manifest continuous variable for regression analyses by computing factor scores from the standard normal LTM. The best-fitting discrete model was the two-class LCM (BIC=9534.82). Class 1 (n=9474, ‘symptom free’) consisted of individuals with near-zero response probabilities across all symptoms (mean probability=0.01) and class 2 (n=406, ‘potentially symptomatic’) consisted of individuals with at least minimal response probabilities across all symptoms (mean probability=0.16). This model was represented as a manifest discrete variable for regression analyses by calculating participants' posterior probabilities for each class, assigning participants to the class to which they were most likely to belong, and creating a dichotomous variable to reflect these class assignments.
Table 2. Standard normal LTM factor loadings and R2 values, and two-class LCM item response probabilities for the eight DSM criteria of a manic episode

LTM, Latent trait model; LCM, latent class model.
Rationally selected models
The rationally selected continuous model of mania was a single additive scale of manic symptoms, with each symptom contributing 1 point. The empirically derived and rationally selected dimensional models of mania were strongly associated (r=0.97, p<0.001). The rationally selected discrete model was past 2-week DSM-III diagnoses of Manic Episodes (n=15). The association between the empirically derived and rationally selected categorical models of mania was minimal but statistically significant (r=0.08, p<0.001).
Outcome variables
Outcome variables reflecting psychiatric diagnoses and suicidal behavior were assessed as part of the DIS. Health service utilization outcomes were assessed using a supplementary structured interview (Shapiro et al. Reference Shapiro, Tischler, Cottler, George, Amirkhan, Kessler, Skinner, Eaton and Kessler1985). Psychiatric diagnoses were assessed on a lifetime basis and were coded ‘0’=absent, ‘1’=present. Consistent with recommendations (e.g. Boyd et al. Reference Boyd, Burke, Gruenberg, Holzer, Rae, George, Karno, Stoltzman, McEvoy and Nestadt1984; Meyers et al. Reference Meyers, Weissman, Tischler, Holzer, Leaf, Orvaschel, Anthony, Boyd, Burke, Kramer and Stoltzman1984), DSM-III (APA, 1980) hierarchy rules were not observed. To reduce diagnostic outcomes, Krueger's (Reference Krueger1999) dimensional model of common mental disorders was estimated using CFA. Suicidal behavior variables were assessed on a lifetime basis and were coded ‘0’=no, ‘1’=yes. Items covered: (1) thoughts of death; (2) desire to die; (3) thoughts of committing suicide; and (4) suicide attempts. Health service utilization variables (17 total) were assessed on a lifetime basis and were coded ‘0’=no, ‘1’=yes. Participants were asked if they had ever gone to a wide variety of people and places where ‘someone might get help for problems with emotions, nerves, drugs, alcohol, or their mental health’, including spiritual and natural healers, mental health and medical professionals, friends and relatives, and support groups.
Analytic strategy
Factor analyses
As described above, Krueger's (Reference Krueger1999) model of common mental illnesses was estimated using CFA. Factor scores were computed for the two superordinate factors (internalizing and externalizing), and the resulting variables were used as outcomes in subsequent predictive analyses. Additionally, two separate unidimensional CFA models were estimated from the suicidal behavior and health service utilization variables, respectively; outcome variables were created by computing factor scores from each of these models. CFAs were conducted using the WLSMV (Muthén, Reference Muthén1989), and each incorporated the ECA sample weight in addition to information regarding the stratification and clustering of the data (Muthén, Reference Muthén2004).
Regression analyses
Regression models were estimated using the %sregsub macro (SAS Institute Inc., 2002) in SAS version 9.1.3 (SAS Institute Inc., USA), which allows for the analysis of subpopulations of complex survey data and includes information regarding the weighting, stratification and clustering of the data into parameter and variance estimations. Separate sets of predictive comparisons were conducted for the empirically derived and the rationally selected models of mania. Within each set of comparisons, separate stepwise regression models were estimated for each of the four outcome variables. Step 1 included a set of continuous or discrete predictors, whereas step 2 added the set of predictors not included in step 1. Each stepwise model was estimated twice for each outcome: once with the continuous predictor entered at step 1, and once with the discrete predictor entered at step 1. The improvement in model fit from step 1 to step 2 represented the degree to which one model of mania provided unique predictive validity beyond that of the alternative model. Of particular interest were the unique relationships between predictor variables and outcomes in step 2 models. β values involving predictors with meaningful scales of measurement (i.e. both of the rationally selected models and the discrete empirically derived model) were Y standardized. Alternatively, β's involving the continuous empirically derived model were fully (XY) standardized. Separate Bonferroni corrections were applied to significance tests of ΔR 2 and β to control experiment-wise α inflation. With a desired α of 0.05 for each type of test, Bonferroni corrections suggested an α of 0.0016 for individual ΔR 2 (0.05/32) and β (0.05/32) significance tests.
Part II Results
Factor analyses
Krueger's (Reference Krueger1999) model of common mental illnesses provided a good fit to the data (χ2=134.02, df=19, p<0.001; CFI=0.95, TLI=0.95, RMSEA=0.02), and all factor loadings were statistically significant (mean loading=0.74, mean R 2=0.56). Internalizing and externalizing factors were significantly correlated (r=0.43, p<0.001). The suicidal behavior CFA model provided an acceptable fit to the data (χ2=142.21, df=2, p<0.001; CFI=0.98, TLI=0.95, RMSEA=0.07), and all factor loadings were statistically significant (mean loading=0.83, mean R 2=0.70). Finally, the health service utilization CFA model provided a good fit to the data (χ2=126.83, df=26, p<0.001; CFI=0.95, TLI=0.97, RMSEA=0.02), and all factor loadings were statistically significant (mean loading=0.71, mean R 2=0.51). The four outcome variables that were created from these models (by computing factor scores for all participants) had acceptable levels of skew and kurtosis (<3 and <10 respectively; Kline, Reference Kline2005).
Regression analyses
Empirically derived models
The results regarding the empirically derived models' abilities to predict outcomes are presented in Table 3. This table shows that the inclusion of the discrete model at step 2 did not result in a statistically significant improvement in R 2 for any of the four outcomes. In addition, the discrete model did not uniquely predict any of the four outcomes when the continuous model was considered simultaneously. Table 3 also shows that the inclusion of the continuous model at step 2 resulted in a statistically significant improvement in R 2 for each of the four outcomes (mean ΔR 2=0.02, mean increase in R 2=89%). Furthermore, the continuous model significantly uniquely predicted each of the four outcomes when the discrete model was considered simultaneously (mean β=0.20). In sum, the continuous model demonstrated unambiguously superior predictive validity relative to the discrete model; the latter model had no incremental validity over the former model.
Table 3. Multiple regression analyses with empirically derived continuous or discrete models of mania alone predicting four outcomes, followed by analyses with both models of mania simultaneously predicting outcome

Regression coefficients involving the standard normal LTM were XY standardized. Coefficients involving the two-class LCM were Y standardized.
LTM, Latent trait model; LCM, latent class model; ΔR 2, change in proportion of variance accounted for; β, regression coefficient.
* p<0.0016.
Rationally selected models
The results regarding the rationally selected models' abilities to predict outcomes are presented in Table 4. This table shows that the inclusion of the discrete model at step 2 led to a statistically significant improvement in R 2 for internalizing, externalizing and suicidal behavior (mean ΔR 2=0.003, mean percentage increase in R 2=7%), but not for health service utilization. However, the discrete model only uniquely predicted one of the four outcomes (suicidal behavior: β=0.16) when the continuous model was considered simultaneously. Table 4 also shows that the inclusion of the continuous model at step 2 resulted in a statistically significant improvement in R 2 for each of the four outcomes (mean ΔR 2=0.04, mean percentage increase in R 2=2296%). Furthermore, the continuous model significantly uniquely predicted each of the four outcomes when the discrete model was considered simultaneously (mean β=0.07). In sum, although the discrete model demonstrated some incremental predictive validity relative to the continuous model, the increase in R 2 associated with the inclusion of the discrete model was very small, and the discrete model only uniquely predicted one outcome when the continuous model was considered simultaneously.
Table 4. Multiple regression analyses with rationally selected continuous or discrete models of mania alone predicting four outcomes, followed by analyses with both models of mania simultaneously predicting outcomes

LTM, Latent trait model; LCM, latent class model; ΔR 2, change in proportion of variance accounted for; β, Y standardized regression coefficient.
* p<0.0016.
Taken together, findings from Part II provide strong and consistent support for continuous models of mania, and weak and inconsistent support for discrete models of mania. To guard against the possibility of spurious continuous findings, all analyses were repeated for lifetime symptom data that contained a larger number, and higher base rate, of diagnosed Manic Episodes. These analyses also supported a continuous conceptualization of maniaFootnote 4.
Discussion
The present study is the first to examine whether mania is a discrete or a continuous construct using appropriate methodologies. In an unselected epidemiologic sample of approximately 10 000 individuals, the manic symptom questions from the structured DIS were submitted to a wide variety of taxometric procedures and consistency tests, in addition to ITLDM. The relative predictive validities of various continuous and discrete models of mania were also examined. The results all converged on a continuous solution.
These results provide support for prominent theories of bipolar disorders that conceptualize mania as an extreme variant of human functioning (e.g. Kraepelin, Reference Kraepelin1921; Depue et al. Reference Depue, Krauss, Spoont, Magnusson and Ohman1987). They are also consistent with studies demonstrating the validity of subthreshold mania (e.g. Merikangas et al. Reference Merikangas, Akiskal, Angst, Greenberg, Hirschfeld, Petukhova and Kessler2007). Taxometric studies that have investigated other bipolar mood constructs, such as depression (e.g. Ruscio & Ruscio, Reference Ruscio2000; Prisciandaro & Roberts, Reference Prisciandaro and Roberts2005; Slade & Andrews, Reference Slade and Andrews2005) and hyperthymic temperament (Meyer & Keller, Reference Meyer and Keller2003), have also found these constructs to be continuousFootnote 5. However, the latent structures of key bipolar mood constructs (e.g. mixed mania, mood cycling) have not yet been examined using appropriate statistical methodologies. Future studies should examine the reliability of the present study's findings, and also conduct similar investigations on related bipolar constructs.
The present study had several methodological strengths (e.g. large sample size, high indicator validity) that allowed it to overcome challenging aspects of the data (e.g. sparse, dichotomous data). Although unselected community samples are generally preferred in structural investigations because they minimize the likelihood of spurious dimensional or categorical findings (Ruscio et al. Reference Ruscio, Haslam and Ruscio2006), the present study's extremely low number of currently manic individuals potentially increased the likelihood of spurious dimensional findings. However, all analyses were repeated on lifetime manic symptom data, with an increased number of manic individuals, and these results converged on a continuous interpretation. Nevertheless, future research should evaluate the structure of mania in samples that are more likely to contain currently manic individuals.
The present study's support for a unidimensional representation of mania is not entirely consistent with previous factor analytic studies, which have found between two and seven latent factors (Murphy & Beigel, Reference Murphy and Beigel1974; Cassidy et al. Reference Cassidy, Forest, Murry and Carroll1998; Swann et al. Reference Swann, Janicak, Calabrese, Bowden, Dilsaver, Morris, Petty and Davis2001; Sato et al. Reference Sato, Bottlender, Kleindienst and Moller2002; Akiskal et al. Reference Akiskal, Azorin and Hantouche2003). However, these studies have extracted factors reflecting depression and psychosis, suggesting that symptoms unrelated to mania were included. Nonetheless, future factor analytic studies of DSM mania should include more than one item for each DSM criterion to ensure sufficient coverage. Although the present study used indicators created from DSM-III (APA, 1980) criteria, present-day Manic Episode criteria (APA, 1994) are nearly identical to those in DSM-III. Finally, because irritable mood was only assessed in a highly selected group of individuals in the ECA, the absence of irritable mood as a symptom indicator in the present study was an additional limitation; the results of our study are thus more applicable to euphoric mania than to a conceptualization of mania that accepts irritable mood in the absence of euphoric/elevated mood.
If the results from the present study are supported by future investigations, this may argue for the use of a continuous representation of mania. If continuous conceptualizations of mania are more valid than discrete representations, categorical selection methods for research (e.g. selecting participants diagnosed with DSM Manic Episodes) would reduce statistical power (Cohen, Reference Cohen1983), prevent proper investigation of dimensional theoretical models of mania (e.g. Depue et al. Reference Depue, Krauss, Spoont, Magnusson and Ohman1987), disguise potential non-linear relationships between mania and other variables (Ruscio et al. Reference Ruscio, Ruscio and Keane2004), and create spurious statistically significant effects (Maxwell & Delaney, Reference Maxwell and Delaney1993). Instead, correlational research designs that sample individuals at all levels of manic symptom severity should be used. To sample individuals at all levels of symptom severity, continuous measures of manic symptoms must be further developed as existing measures may not reflect the true latent structure of mania.
As Akiskal and colleagues have demonstrated (e.g. Judd & Akiskal, Reference Judd and Akiskal2003), the issue of clinical significance needs to be revisited for bipolar disorders; it is clear that subthreshold expressions of mania can result in pervasive impairment. The findings from the present study further support Akiskal and colleagues' reasoned arguments for expansion of the bipolar spectrum. It is important to recognize, however, that support for a continuous conceptualization of mania suggests that there are no points at which a certain number of symptoms or a certain level of symptom severity inherently denotes the presence of a manic disorder. Instead, a continuous conceptualization of mania necessitates that empirical associations between mania and important outcomes (e.g. functional impairment) form the primary basis for determining treatment resource allocation. For example, if the relationship between mania and impairment is non-linear, treatment efforts could be directed at individuals whose levels of manic symptoms place them at the cusp of a substantial increase in functional impairment. If, instead, the relationship between mania and impairment is linear, a graded continuum of care could be provided to affected individuals, such that different degrees of manic severity are met with concordant levels of treatment intensity (e.g. ranging from psycho-education to hospitalization). Cost–benefit analyses could be used to determine which specific treatments are most effective at particular levels of severity. Before such a plan can be instituted, however, research is needed to determine the form of the relationship between mania and functional impairment, and to further investigate the cost–benefit ratios of specific treatments at varying levels of manic symptom severity.
Acknowledgments
We thank C. Colder and L. Simms for their helpful comments on an earlier draft of this manuscript. We are also grateful to J. Ruscio and L. Simms for their statistical advice.
Declaration of Interest
None.


