


Introduction
Sorghum bicolor (L.) Moench (sorghum) is widely cultivated in the Sahelian areas of West and Central Africa and in India, where it covers the food needs of a substantial proportion of the human population (Ng'uni, 2011; Vigouroux et al., Reference Vigouroux, Barnaud, Scarcelli and Thuillet2011a). Five major sorghum races (bicolor, caudatum, durra, guinea and kafir) and ten intermediate races, corresponding to pairwise combinations of the major races, are identified according to the panicle and spikelet morphology (Harlan and de Wet, Reference Harlan and de Wet1972). The local landraces of sorghum have diversified over time to adapt to climatic variations and human needs.
The genetic diversity of sorghum has been assessed so far at the regional level (Teshome et al., Reference Teshome, Baum, Fahrig, Torrance, Arnason and Lambert1997; Ghebru et al., Reference Ghebru, Schmidt and Bennetzen2002; Deu et al., Reference Deu, Sagnard, Chantereau, Calatayud, Hérault, Mariac, Pham, Vigouroux, Kapran, Traore, Mamadou, Gerard, Ndjeunga and Bezançon2008; Barro-Kondombo et al., Reference Barro-Kondombo, Sagnard, Chantereau, Deu, Vom Brocke, Durand, Gozé and Zongo2010; Rabbi et al., Reference Rabbi, Geiger, Haussmann, Kiambi, Folkertsm and Parzies2010; Ng'uni, 2011; Bhosale et al., Reference Bhosale, Stich, Rattunde, Weltzien Rattunde, Haussmann, Hash, Melchinger and Parzies2011) and only a few papers have addressed the genetic diversity of sorghum at a local scale (Djè et al., Reference Djè, Heuertz, Ater, Lefèbre and Vekemans2004; Barnaud et al., Reference Barnaud, Deu, Garine, McKey and Joly2007; Barnaud et al., Reference Barnaud, Deu, Garine, Chantereau, Justin, Koïda, McKey and Joly2009). Barnaud et al. (Reference Barnaud, Deu, Garine, McKey and Joly2007) have shown that Duupa farmers in northern Cameroon have agricultural practices that affect the patterns of genetic variation of sorghum. In this ethnic group, 59 named sorghum taxa were represented. A genetic analysis of 21 of these landraces showed that they are grouped into four genetic entities.
Farmers in the Lake Chad Basin cultivate sorghum in both the rainy and dry seasons. Dry-season landraces are grown during the post-rainy season and allow a second cropping that enables farmers to endure the lean period more easily (De Garine, Reference De Garine1993). Dry-season sorghum is grown on clay soils flooded during the rainy season (vertisols); these soils have a high water-holding capacity and a strong shrinking–swelling dynamic. Landraces adapted to this cultivation period are phenotypically different from the usual rainy-season landraces. This crop represents an alternative way for cereal production that uses different soils and takes place at a different period compared with the other cultivated crops. There are two different types of dry-season sorghum: an early-sown type (Baburi) and a late-sown type (Muskuwaari), which are cultivated on different soils.
Northern Cameroon population is known for its large cultural diversity. The two cultural groups considered in this study are Tupuri and Wina (from the villages of Bouzar and Djongdong, respectively). Tupuri and Wina people cultivate both types of dry-season sorghum but with different traditional farming practices. The Wina farming system for dry-season sorghum consists of large fields with several landraces cultivated together. Instead, Tupuri farmers plant a single landrace per field. The plant density of dry-season sorghum is only about one plant per square meter for Tupuri and two plants per square meter (two plants in the same hole) for Wina farmers. Wina and Tupuri people have different matrimonial systems and social networks (De Garine and De Garine, Reference De Garine and De Garine2001), which are likely to have an impact on their cultivation practices, their seed exchange networks and the genetic structure of the cultivated sorghum landraces (Wencelius, 2009; Violon, 2011).
We present here the first analysis of the genetic diversity of dry-season sorghum landraces at a local scale. The objectives of our work were: (1) to characterize the diversity and genetic structure of dry-season sorghum landraces from both Muskuwaari and Baburi types; (2) to assess the link between farmers' taxonomy and molecular data-based population structure and (3) to discuss the impact of farmers' practices and cultural differences on this genetic structure.
Materials and methods
Inventory and collection of landraces
We sampled dry-season landraces in two villages in northern Cameroon (see Supplementary Fig. S1, available online only at http://journals.cambridge.org), Bouzar (Tupuri village) and Djongdong (Wina village). Sampling was carried out between January and March 2010. We first performed an inventory of landraces in each village (see Supplementary Table S1, available online only at http://journals.cambridge.org), including information on: (1) landrace names, (2) the uses of each landrace, (3) the origin of the seed (family, neighbour, markets and friends) and (4) agricultural systems (mono- or polyvarietal fields, sowing dates in nurseries, chemical treatments and agricultural calendar). Interviews with nine farmers were carried out. For each farmer, we recorded the number of landraces observed in the field and (for the farmers from Djongdong) the size of the fields.
Interviews with farmers were carried out in the vernacular languages with the help of local research assistants. Fifteen and five different landraces of dry-season sorghum were collected in Djongdong and Bouzar, respectively. For each landrace, the sample consisted of 30 spikelets collected from 30 different plants in a farmer's field (the choice of the plants and of the spikelets were performed by each farmer in his field). We then categorized the landraces into four groups based on the type to which they belonged and the village in which they were collected: Muskuwaari from Djongdong (Ms_Dj, n= 327), Baburi from Djongdong (Ba_Dj, n= 56), Muskuwaari from Bouzar (Ms_Bz, n= 75) and Baburi from Bouzar (Ba_Bz, n= 79).
Racial characterization was carried out in the laboratory in accordance with Harlan and de Wet's (Reference Harlan and de Wet1972) classification. We used seed and spikelet traits and photographs of the panicles (Table 1).
Table 1 Classification, origin and code of landraces

a The type of each landrace in the traditional classification (Baburi or Muskuwaari).
b The village where the sample was collected (Bouzar/Tupuri ethnic group or Djongdong/Wina ethnic group).
c Its local name and the race to which it belongs (D = durra; C = caudatum; G = guinea).
d The code associated with each landrace, as used in the figures. This code follows a XX_YY_ZZZZ format, where XX represents the type of dry-season sorghum (Ms = Muskuwaari or Ba = Baburi), YY represents the village were the sample is collected (Dj = Djongdong or Bz = Bouzar) and ZZZZ represents the abbreviation of the local name of the landrace.
e Numbers indicate the identification of the farmer from whom the landraces were collected. Note that some landraces were collected from the same farmer.
f Letters indicate the identification of the field where each landrace was collected (some landraces were collected in the same field).
g The values indicate the number of individuals analysed.
DNA extraction and genotyping
Three seeds per spikelet were germinated on a wet blotting paper and only one of them was used for genotyping. DNA was extracted from seedlings using the QIAamp DNA Mini Kit (QIAGEN). Twenty pairs of primers (see Supplementary Table S2, available online only at http://journals.cambridge.org) were tested for genotyping microsatellite loci. The polymerase chain reaction amplification protocol involved 10 min denaturation at 95°C, then 35 cycles of 30 s denaturation at 95°C, 1 min 30 s annealing at 57°C, 1 min 30 s extension at 72°C and a final extension of 15 min at 72°C. Genotyping was carried out using an Applied ABI Prism 3130 XL 16 capillary (Applied Biosystems). Genotypes were scored using the program GeneMapper (ABI).
A subsample of four individuals per landrace was used to test the primers (leading to a total of 80 individuals). Twelve markers from this set were successfully amplified and were polymorphic in this subset of individuals. We retained these markers for the molecular analysis of the whole sample of landraces. A total of 30 seed lots per landrace were sown (leading to an expected number of 600 seed lots); however, 63 seed lots were discarded due to the low level of germination or insufficient yield during DNA extraction. Thus, the analysed whole sample was composed of 537 individuals. After genotyping all seeds, we re-evaluated the quality of the loci based on genotype profiles (GeneMapper) and verified non-ambiguity in allele assignment. We had difficulties in assigning alleles for the loci GPSB_067, GPSB_123, XTXP_136 and XTXP_10. They were therefore excluded, resulting in a final set of eight loci (see Supplementary Table S2, available online only at http://journals.cambridge.org). The proportion of missing simple sequence repeat (SSR) data was 3.5%.
Genetic analysis
The mean number of alleles per loci (A), the population fixation index (F IS) and the expected heterozygosity (He) were estimated for each landrace with GENETIX software, version 4.04 (Belkhir et al., Reference Belkhir, Castric and Bonhomme2002). It was adjusted for small sampling size using Nei's (Reference Nei1978) equation:
 $$\begin{eqnarray} He = 2 n ((1 - \Sigma _{ j }\Sigma _{ i } x _{ ij }^{2})/ r )/(2 n - 1), \end{eqnarray}$$
where x ij is the frequency of the allele of individual i at locus j, r is the number of loci and n is the sample size. We calculated allelic richness (Rs) using the rarefaction method (Petit et al., Reference Petit, El Mousadik and Pons1998) with FSTAT 2.9.3.2 software (Goudet, 2002). The selfing rate (s) is given by the formula: s= (2 × F IS)/(1+F IS). We also calculated the pairwise F ST matrix among the samples and determined the significance of estimations with 1000 permutations using the method of Weir and Cockerham (Reference Weir and Cockerham1984). A genetic dissimilarity matrix was computed from the F ST values using the simple matching index. From these F ST values, an analysis of molecular variance (AMOVA) was conducted to assess the variance components and the significance of variation within and among populations. AMOVA was performed with ARLEQUIN software version 3.5 (Excoffier et al., Reference Excoffier, Laval and Schneider2005). Pairwise significance tests for F ST were estimated by permutation and resampling of multilocus genotypes among the pairs of samples (10,000 permutations). The analysis was carried out by considering two factors of classification (landrace name and village).
The dissimilarities between all pairs of individual plants were estimated based on simple matching. Robustness was estimated by using 500 bootstrap resamplings. A genetic dissimilarity matrix was computed using the simple matching index. A dendrogram was then generated on the dissimilarity matrix with the neighbour-joining (NJ) algorithm implemented in DARWIN V5 software (Perrier et al., Reference Perrier, Flori, Bonnot, Hamon, Seguin, Perrier and Glaszmann2003).
We used the Bayesian method implemented in the software STRUCTURE version 2.3 (Pritchard et al., Reference Pritchard, Stephens and Donnelly2000) to assess the population structure. STRUCTURE infers genetic clusters based on a considered number of clusters (K). The method estimates the proportion of the genome of each individual plant derived from each respective cluster (ancestry). We used the admixture model with the possibility of correlated allele frequencies, and we allowed K to vary from 1 to 20 with ten replicates per K. Admixture models are more flexible than models without admixture, and are useful in interpreting population structure when the timing of divergence or admixture events is not known (Francois et al., Reference Francois and Durand2010). The Markov chain length was set to 105 iterations preceded by a burn-in period of 105 iterations. The most likely number of clusters was assessed using the method of Evanno et al. (Reference Evanno, Regnaut and Goudet2005), based on the second-order rate of change of the log likelihood.
An alternative clustering method, discriminant analysis (DA) of principal components (DAPC; Jombart et al., Reference Jombart, Devillard and Balloux2010), was used for the analysis of population structure. DAPC is a multivariate method that relies on data transformation using principal component analysis as a prior step to the DA (DA). This prior transformation ensures that variables subjected to the DA are uncorrelated, and that the number of variables is minimized compared with the number of analysed individuals. DA yields synthetic variables for which the between-group variation is maximized while the within-group variation is minimized (Jombart et al., Reference Jombart, Devillard and Balloux2010). The method achieves discrimination of genotypes into predefined groups. We defined the number of optimal groups and the prior assignment of individuals to these groups independently of farmers' classification. Following the procedures implemented in DAPC, we used sequential K-means to infer groups (Legendre et al., Reference Legendre and Legendre1998) and we performed model selection to infer the optimal number of genetic clusters (Jombart et al., Reference Jombart, Devillard and Balloux2010). K-means clustering was run with K= 1 to K= 20, and the Bayesian information criterion (BIC) was used to assess the optimal number of clusters. Once the optimal number of clusters was identified, we ran DAPC using as many components as needed to obtain at least 95% of the total variation. This method also allows for a probabilistic assignment of genotypes to each group using linear discriminant functions, as in Bayesian clustering methods. DAPC was performed using the Adegenet package (Jombart, Reference Jombart2008) implemented in the software R (R Development Core Team, 2009).
Comparison of genetic parameters between the sorghum groups
STRUCTURE was run with an admixture model (Falush et al., Reference Falush, Stephens and Pritchard2003). The ancestry matrix yielded by this model estimates the proportion of the genome that each individual inherited from each inferred population. This ancestry q ik varies from 0 to 1 for each individual i with respect to the kth population, and Σkq ik= 1. We used the maximum value of the ancestry of each individual across the K clusters (q i.max) as a proxy for the level of admixture. We made the assumption that low values of q i.max corresponded to high admixture, and vice versa. We also calculated for each of the 537 individuals the number of clusters N admix to which each individual is assigned with respect to a given ancestry threshold q 0. An individual was considered assigned to a cluster when its ancestry for this cluster was greater than q 0. We varied q 0 from 0.01 to 0.4. We used the Kruskal–Wallis (KW) test and the Wilcoxon (WX) test to assess the differences in the distribution of q i.max and N admix with regard to classification factors (village of origin and sorghum type). Both methods are non-parametric (Sokal and Rohlf, Reference Sokal and Rohlf1995). KW was used to test the differences between more than two levels of a factor. The WX test was used for pairwise comparison between two samples.
We also used KW to test for global differences of allelic richness between the sorghum groups. We then used the WX paired test (WXp) to compare allelic richness between all respective pairs of the sorghum groups (Sokal and Rohlf, Reference Sokal and Rohlf1995). Values of allelic richness were paired with respect to a microsatellite locus (n= 8).
Results
Farming systems
The number of landraces collected from the studied area was 15 in the Wina group (at Djongdong) and five in the Tupuri group (at Bouzar). The most common landraces were Wun Fiokna Habaïna in the Wina group and Gueleting in the Tupuri group. We classified the collected landraces following Harlan and de Wet's (Reference Harlan and de Wet1972) criteria (Table 1). The race durra was the most prevalent race in the sample (n= 15; 75% of the sample). We also identified four landraces with an intermediate morphology between durra and caudatum. One Muskuwaari landrace from Djongdong (Pakayna) was classified as an intermediate between durra and guinea.
Our survey indicates that the seed origin for 65% of the landraces is traced back to the father of the farmer at the time of his installation in both ethnic groups (data not shown). The other seeds come either from the market (26%) or from neighbours and friends (9%). Moreover, in Djongdong, farmers consider that the landrace Pakayna is derived from a given farmer's local rainy-season sorghum landrace, with which it shares its name. Wina farmers cultivated dry-season sorghum always in polyvarietal fields, contrary to Tupuri farmers, who usually cultivated dry-season sorghum in monovarietal fields (see Supplementary Table S1, available online only at http://journals.cambridge.org).
Genetic diversity
A total of 90 alleles were observed in the whole sample (Table 2). The average number of alleles per locus varied among the landraces, ranging from 1.88 (Ms_Dj_Hunz) to 4.00 (Ms_Dj_Daml). The mean allelic richness per locus varied from 1.54 (Ms_Bz_Madj) to 3.16 (Ms_Dj_Gela). Expected heterozygosity ranged from 0.07 (Ms_Bz_Madj) to 0.49 (Ms_Dj_Daml). F IS varied from 0.52 to 0.96 (with an exception of 0.31 for the landrace Ms_Dj_Djak) and selfing frequency was high (s>0.8 for 17 landraces out of 20).
Table 2 Estimates of genetic diversitya

a For each landrace, the following statistics were calculated: number of samples analysed (N); number of alleles per locus (A); allelic richness for each landrace (Rs); expected heterozygosity (He); F IS, selfing rate (s) and mean of Rs and He by each combination type × village. A, F IS and He are computed with GENETIX version 4.04 (Belkhir et al., Reference Belkhir, Castric and Bonhomme2002). Rs is computed with FSTAT 2.9.3.2 (Goudet, 2002). Selfing rate is given by s= (2 × F IS)/(1+F IS).
Pairwise estimates of F ST among the landraces varied from 0.17 to 0.87 (see Supplementary Table S3, available online only at http://journals.cambridge.org) and all estimates were statistically different from zero (P< 0.0001), indicating that each landrace was different from all others. To better understand the relationship between the landraces, across the villages or types, two hierarchical AMOVA were performed (Table 3). The partition of genetic variance showed that 56% of the total genetic variation was accounted for by the variation among the landraces. The within-landrace variation represented one-third of the total variation. The variation among the villages is 3.8%, and the variation among the types is 1.6% of the total variance. These results indicate that a variation occurred mainly between the landraces. However, the NJ dendrogram (see Supplementary Fig. S2, available online only at http://journals.cambridge.org) reveals a differentiation between the Baburi type and the Muskuwaari type.
Table 3 Analysis of genetic variance of dry-season sorghuma
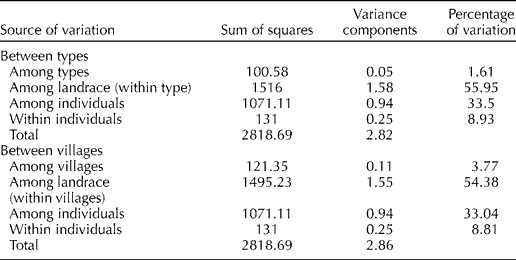
a Two independent AMOVA were conducted to assess the variance components and their significance for different factors (Excoffier et al., Reference Excoffier, Laval and Schneider2005). We used a hierarchical model with landrace and individual nested in sorghum type (Muskuwaari vs. Baburi, between types) or nested in village (Bouzar vs. Djongdong, between villages). Results are based on average estimates from eight loci. All variance components were significant for each of the eight loci based on 10,000 permutations (data not shown).
Inference of the number of clusters
The number of genetic clusters supported by molecular data was inferred using STRUCTURE and DAPC approaches, independently from the classification of landraces by farmers. The log-likelihood estimates given by STRUCTURE increased until K= 5, and continued increasing weakly until K= 20 (see Supplementary Fig. S3(a), available online only at http://journals.cambridge.org). We examined the second-order change in this log likelihood using the method of Evanno et al. (Reference Evanno, Regnaut and Goudet2005). This method showed a multimodal distribution with different picks (K= 4 and K= 12; for example, see Supplementary Fig. S3(b), available online only at http://journals.cambridge.org). For DAPC, the BIC suggested the value of K= 14 as the optimal number of clusters (see Supplementary Fig. S3(c), available online only at http://journals.cambridge.org).
We analysed the structure of the sample supported by STRUCTURE and DAPC, considering both K= 4 and K= 14. Each individual was assigned to a single cluster based on the maximum ancestry (STRUCTURE) or the probability of membership (DAPC). For K= 4, the clusters did not correspond to the taxonomical units and those inferred by STRUCTURE and DAPC were not consistent (see Supplementary Fig. S6, available online only at http://journals.cambridge.org and Fig. 1(a)). For K= 14, the clustering provided by both methods was consistent (Table 4). In this case, it was possible to identify similar clusters constituted by the same set of individuals. Due to this consistency and the non-ambiguity in the choice of K in DAPC compared with the method of Evanno et al. (Reference Evanno, Regnaut and Goudet2005), we considered K= 14 as the most likely number of genetic clusters.

Fig. 1 Population structure of dry-season sorghum. The analysis of population structure in the landraces (n= 537 samples analysed) was performed using (a) DAPC (Jombart et al., Reference Jombart, Devillard and Balloux2010) plotted for K= 14 and (b) the Bayesian method STRUCTURE (Pritchard et al., Reference Pritchard, Stephens and Donnelly2000) plotted for K= 14. Each genetic cluster is represented by a different colour. The bars represent individual ancestry. Landraces having more than five individuals in each genetic cluster are noticed (the number in brackets is the number of observed individuals). See the text for details about landrace coding (a colour version of this figure can be found online at http://journals.cambridge.org/pgr).
Table 4 Assignment of the 537 sampled individuals from the 20 landraces into K=14 genetic clusters, using STRUCTURE and DAPC

For each landrace, the number of individuals assigned to the clusters is given. Clusters containing more than five individuals from the same landrace are italicized. The identifiers (1–14) of the clusters are given automatically by the software, and they are consistent with those in the remaining figures of the paper.
Genetic structure
We analysed the consistency for landrace assignment between DAPC and STRUCTURE by considering the runs at K= 14 (Table 4). In the graphical analysis, we considered that a landrace is assigned to a cluster when at least five individuals from this landrace are attributed to this cluster (Fig. 1(b)). The genetic clusters identified by the Bayesian method STRUCTURE clearly separated the Muskuwaari type (15 landraces distributed in ten genetic clusters) and the Baburi type (five landraces distributed in four genetic clusters). Each of the five landraces (Ms_Dj_Arch, Ms_Dj_Wfha, Ms_Dj_Bour, Ba_Bz_Bada and Ms_Dj_Djak) corresponded to a single genetic cluster (Fig. 1(b)). Two landraces of Djongdong village (Ms_Dj_Daml and Ms_Dj_Djak) were distributed in one cluster by DAPC and in two clusters by STRUCTURE (Table 4). The landrace Borgoïda Hloada is distributed in two clusters by STRUCTURE and in three clusters by DAPC (Table 4).
The first axis of DAPC showed a strong separation between three Muskuwaari landraces from Djongdong (Ms_Dj_Gela, Ms_Dj_Golg and Ms_Dj_Guer) and the others (Fig. 2). The landraces share a similar panicle shape (ovoid and compact) but share neither the stem form (Ms_Dj_Gela and Ms_Dj_Golg have a curved stem, whereas Ms_Dj_Guer has a straight stem) nor the grain colour (white for Ms_Dj_Gela and yellow grain for the others). STRUCTURE and DAPC suggest that each landrace corresponds to a well-defined genetic population and this can fit with some morphological traits.

Fig. 2 DAPC for the sample of sorghum landraces. The two first axes of DA are shown. Individuals appear as dots; landraces are depicted by colours. Each landrace is identified by a number. The circle delimits distinct genetic cluster (a colour version of this figure can be found online at http://journals.cambridge.org/pgr).
Assessment of population admixture
Maximal ancestry varied between 0.27 and 0.97 over all samples. We performed an overall comparison of the maximal ancestry q i.max across the four groups of landraces (Ms_Dj, Ba_Dj, Ms_Bz and Ba_Bz). The KW test indicated a significant difference in the distributions of q i.max across these groups (P= 0.026). We performed the WX test between all pairs of groups to detect which groups were different with respect to this maximal ancestry. Baburi from Djongdong showed a significant difference compared with Baburi from Bouzar (WX, P= 2.9 × 10− 3) and Muskuwaari from Djongdong (WX, P= 6.14 × 10− 3). It should be noted that Baburi from Djongdong also showed a P-value near to the threshold compared with Baburi from Bouzar (P= 0.05). No other significant difference was found based on this WX test (P< 0.05). These results indicate that the most different group with regard to q i.max was Baburi from Djongdong (see Supplementary Fig. S4, available online only at http://journals.cambridge.org). This group showed a shift towards the low values of q i.max. No overall difference was observed between the whole landrace samples of Djongdong and Bouzar (WX, P= 0.40). However, a significant difference was found between Baburi and Muskuwaari across the two villages (WX, P= 3.1 × 10− 2). The median of q i.max was 0.87 for Baburi and 0.93 for Muskuwaari.
We also computed the number of genetic clusters to which each individual is linked based on its ancestry (or populations of origin). As expected, this number of clusters was dependent on the value of the threshold for membership into a cluster. Among the values of the threshold tested (q 0= 0.01 to q 0= 0.5), only the lowest (q 0= 0.01) led to a significant difference in the number of clusters of origin between the four groups of sorghum (KW, P< 0.01). Thus, with respect to the assignment based on this threshold, Baburi from Djongdong showed the highest number of associated clusters of origin, with a median number of four clusters, compared with three or two clusters for the other sorghum groups.
Diversity comparison between the groups
We compared allelic richness between the four sorghum groups (Ms_Dj, Ba_Dj, Ms_Bz and Ba_Bz). This parameter significantly discriminates the groups (KW χ2= 8.671, P= 0.034). Based on WXp, we observed the differences between Muskuwaari from Djongdong and Baburi from Djongdong (P= 0.02), and Muskuwaari from Bouzar (P= 0.03), respectively. There were no overall significant differences in allelic richness between the landraces from Bouzar and Djongdong (WXp, P= 0.45). The overall median allelic richness per village was about 4 in both villages.
Discussion
Consistency of the two clustering methods: DAPC and STRUCTURE
The use of different methods to analyse the same molecular dataset can lead to different conclusions about the genetic structure (Blair et al., Reference Blair, Weigel, Balazik, Keeley, Walker, Landguth, Cushman, Murphy, Waits and Balkenhol2012; Bouchet et al., Reference Bouchet, Pot, Deu, Rami, Billot, Perrier, Rivallan, Gardes, Xia, Wenzl, Kilian and Glaszmann2012). We compared two methods used for the inference of genetic structure (STRUCTURE and DAPC) with data on dry-season sorghum landraces from northern Cameroon (Table 4). STRUCTURE uses a Bayesian algorithm based on models of population genetics (Pritchard et al., Reference Pritchard, Stephens and Donnelly2000). One assumption of the underlying genetic model is Hardy–Weinberg equilibrium within populations. Even though this method could be robust to deviations from the assumptions to a certain extent, it could produce biased results according to the analysed data. For instance, Gao et al. (Reference Gao, Williamson and Bustamante2007) showed that high inbreeding or selfing could produce a bias towards spurious signals of admixture using the classical STRUCTURE algorithm. They proposed an extension of this method (INSTRUCT) that eliminates the assumption of Hardy–Weinberg equilibrium within clusters and takes inbreeding or selfing into account. INSTRUCT is thus expected to be more adequate for selfing species (Gao et al., Reference Gao, Williamson and Bustamante2007). STRUCTURE and INSTRUCT were empirically compared based on pearl millet inbred lines (Saïdou et al., Reference Saïdou, Mariac, Luong, Pham, Bezançon and Vigouroux2009) and sorghum landraces (Deu et al., Reference Deu, Sagnard, Chantereau, Calatayud, Vigouroux, Pham, Mariac, Kapran, Mamadou, Gérard, Ndjeunga and Bezancon2010). In these two datasets, slight differences were observed between the two methods but the pattern of genetic structure was generally consistent. In the current study, we compared STRUCTURE with DAPC, which is a more recently proposed method (Jombart et al., Reference Jombart, Devillard and Balloux2010). One fundamental interest in this comparison is that DAPC is based on traditional statistical approaches (DA and principal component analysis), and does not assume any explicit genetic model. Besides the absence of explicit genetic assumptions, running DAPC is also less time consuming than a Bayesian approach. Our study provides a comparison of these two methods for the inference of the number of clusters and for the assignment of individuals to clusters. STRUCTURE results did not allow a straight inference of the number of clusters (multiple local maxima were detected for the criterion of Evanno et al. (Reference Evanno, Regnaut and Goudet2005)), while DAPC provided a non-ambiguous result based on BIC (see Supplementary Fig. S3(c), available online only at http://journals.cambridge.org). A previous simulation study showed that DAPC is more powerful in the inference of the number of clusters (K) compared with STRUCTURE (Jombart et al., Reference Jombart, Devillard and Balloux2010). This reinforces our confidence in the number of clusters given by DAPC (K= 14). At K= 14, DAPC and STRUCTURE led to consistent clustering, i.e. clusters from both respective methods were composed globally of the same set of landraces. However, we found slight differences between the two methods. For instance, DAPC classified all individuals of the landrace Ms_Dj_Daml in a single genetic cluster (cluster 3), while STRUCTURE split this landrace into two clusters (Table 4).
What genetic structure underlies local taxonomy?
The farmers' classification of landraces takes into account different taxonomical levels. In the case of dry-season sorghum, the first level of taxonomy distinguishes early-sown landraces (Baburi) from late-sown landraces (Muskuwaari). The AMOVA (Table 3) showed that the majority of the genetic variation (56%) occurs among the landraces, with little variation between the types (1.6%) and between the villages (3.7%). Despite the low amount of variation explained by sorghum type in AMOVA, the Bayesian analysis showed that Baburi and Muskuwaari are clearly separated into differentiated genetic clusters. The same result was observed in the NJ dendrogram (see Supplementary Fig. S2, available online only at http://journals.cambridge.org). This differentiation confirms, at this local scale, the different historical patterns of Baburi and Muskuwaari. Indeed, ethnological studies have stated that Baburi was cultivated in Bouzar long before the adoption of Muskuwaari at the end of the 19th century (Seignobos and Iyebi-Mandjek, Reference Seignobos and Iyebi-Mandjek2000). Furthermore, a barrier to gene flow due to the shift in the period of growth and flowering between these two types of sorghum may have maintained the differentiation. Selection by farmers when renewing their seed lots could also act in this direction; for instance, Tupuri farmers maintain separated seeds from each of these two compartments.
The second level of farmers' taxonomy consists in the distinction of landraces within Baburi and Muskuwaari. A landrace corresponds to the smallest taxonomical unit handled by farmers. We aimed to assess the genetic structure underlying such a taxonomical unit in the case of dry-season sorghum in northern Cameroon. We found a high and significant level of differentiation between the landraces across both villages (F ST= 0.52; see Supplementary Table S3, available online only at http://journals.cambridge.org). We also showed that most landraces correspond to one or two genetic clusters (Table 4). Previous studies on landraces have highlighted different patterns of genetic structure across species and across traditional farming systems. For instance, pearl millet landraces showed no signal of genetic structure throughout the cultivation area in Niger (Vigouroux et al., Reference Vigouroux, Mariac, De Mita, Pham, Gérard, Kapran, Sagnard, Deu, Chantereau, Ali, Ndjeunga, Luong, Thuillet, Saïdou and Bezançon2011b). Another Bayesian analysis on rainy sorghum at a local scale (northern Cameroon) clustered 21 landraces into four genetic clusters (Barnaud et al., Reference Barnaud, Deu, Garine, McKey and Joly2007). Each of these genetic clusters corresponded to a set of morphologically similar landraces and, as far as sorghum was concerned, genetic clustering broadly fitted the racial classification. The congruence of racial classification with genetic structure was nonetheless reported in sorghum by different studies (Deu et al., Reference Deu, Rattunde and Chantereau2006; Reference Deu, Sagnard, Chantereau, Calatayud, Vigouroux, Pham, Mariac, Kapran, Mamadou, Gérard, Ndjeunga and Bezancon2010). Deu et al. (Reference Deu, Sagnard, Chantereau, Calatayud, Vigouroux, Pham, Mariac, Kapran, Mamadou, Gérard, Ndjeunga and Bezancon2010) also examined how landraces (as taxonomical units defined by local names) are distributed in genetic clusters. In some cases, individuals from the same landrace were dispersed among different clusters. On the contrary, in other cases, individuals from a given landrace corresponded to the same genetic cluster. Our data support the latter pattern. Most dry-season sorghum landraces corresponded to one or two genetic clusters. This indicates that effective gene flow is limited between landraces, even those belonging to the same main group (Muskuwaari or Baburi). One limitation to gene flow would be differences in flowering time. However, farmers ensure that a significant part of these landraces are flowering at about the same period (landraces are here compared within the Muskuwaari or Baburi types). Future field experiments could investigate the overlapping of the flowering period between landraces, within and among types.
Diversity of dry-season sorghum
Regional studies of sorghum have so far shown that most of the rainy-season landraces cultivated in the Lake Chad Basin belong either to durra or to caudatum races. In a recent study, Deu et al. (Reference Deu, Sagnard, Chantereau, Calatayud, Hérault, Mariac, Pham, Vigouroux, Kapran, Traore, Mamadou, Gerard, Ndjeunga and Bezançon2008) confirmed that farmers around Lake Chad cultivate almost exclusively durra rainy-season sorghum landraces. Our results show, at a local scale, that durra landraces are also predominant in dry-season sorghum. The mean number of dry-season sorghum landraces cultivated by an individual farmer in northern Cameroon ranges from 2.6 to 8 per village, with a mean of 4.5 landraces per farmer across villages (interviews of 65 farmers in 15 villages in northern Cameroon – Supplementary Table S4, available online only at http://journals.cambridge.org). This is smaller than the mean varietal diversity observed in rainy-season sorghum by farmer communities in sub-Saharan Africa: 12 landraces in Wanté village of northern Cameroon (Barnaud et al., Reference Barnaud, Deu, Garine, McKey and Joly2007), 13 in a Ndebele community in Zimbabwe (Van Oosterhout, Reference Van Oosterhout, Sperling and Loevinsohn1996) and about six in 79 villages of southern Niger (Deu et al., Reference Deu, Sagnard, Chantereau, Calatayud, Hérault, Mariac, Pham, Vigouroux, Kapran, Traore, Mamadou, Gerard, Ndjeunga and Bezançon2008). Teshome et al. (Reference Teshome, Fahrig, Torrance, Lambert, Arnason and Baum1999) found a mean of ten landraces per field in rainy-season sorghum in Ethiopia, and the number of landraces per field ranged from 1 to 24. This latter study showed that sorghum landrace diversity increases as field size increases. We did not observe such a relationship in the village of Djongdong, where we measured the dimensions of fields (see Supplementary Fig. S5, available online only at http://journals.cambridge.org).
A comparison of genetic diversity parameters between studies is not always straightforward. For example, the spatial scale of studies ranges from local (e.g. Barnaud et al., Reference Barnaud, Deu, Garine, McKey and Joly2007) to regional (e.g. Deu et al., Reference Deu, Sagnard, Chantereau, Calatayud, Hérault, Mariac, Pham, Vigouroux, Kapran, Traore, Mamadou, Gerard, Ndjeunga and Bezançon2008). Also, estimates of genetic parameters based on SSR markers depend on sampling schemes, number of loci surveyed, size of the SSR repeats and the location of the SSR on the genome (between coding or non-coding DNA regions). We used two dinucleotide microsatellites that are generally more polymorphic than those containing longer repeats (Casa et al., Reference Casa, Mitchell, Hamblin, Sun, Bowers, Paterson, Aquadro and Kresovich2005). We also sampled each landrace from a single farmer in each village. This could have reduced within landrace diversity and limits the robustness of the estimates of genetic diversity at a single landrace level. However, the random sampling of farmers across the two villages in our study (a total of nine farmers) should ensure the relevance of diversity estimates across landraces.
Sorghum is known to exhibit a mixed mating system with a predominance of selfing (s). For instance, s varied from 0.72 to 0.93 for guinea landraces (Ollitrault, 1987). Multilocus estimations of outcrossing (as proposed by Ritland (Reference Ritland2002)) with progeny arrays (five panicles per landrace) showed a large variation between landraces (from 0.05 to 0.40) and within landraces (from 0.12 to 0.73 for a durra landrace and from 0.02 to 0.36 for a durra-caudatum landrace) (Barnaud et al., Reference Barnaud, Trigueros, McKey and Joly2008). Our results confirm a high level of selfing (s>0.8 for 17 landraces out of 20; Table 2).
Social and cultural differences and farmers' practices
Dry-season sorghum landraces appeared to be well structured at the spatial scale of this analysis. Strong recent bottlenecks due to the shift from rainy to dry-season cultivation may partly explain the relatively low diversity observed in dry-season sorghum. An ongoing study at the regional level will help clarify this point. A high level of differentiation among landraces could be due to high selfing rates and also to farmers' practices in selecting material for sowing the following year.
Tupuri farmers managed monovarietal fields for dry-season sorghum, whereas Wina farmers cultivated an average of three landraces per field. The differences in agricultural practices do not seem to have a strong effect on the genetic structure of their respective landraces. However, we observed signals that suggested higher admixture for the Wina's Baburi (Djongdong village). Baburi landraces from this group have an ancestry shared between a higher number of clusters. This might be the result of cultivating polyvarietal fields that favours potential gene flow between neighbouring plants belonging to different landraces (see Supplementary Table S1, available online only at http://journals.cambridge.org). Also, cultivating polyvarietal fields seems to favour the enrichment of genetic diversity. Indeed, Muskuwaari landraces in Djongdong showed a significantly higher allelic richness compared with those from Bouzar where farmers cultivate monovarietal fields. However, this trend has to be interpreted with caution. It was not confirmed for the Baburi type (no significant difference of allelic richness between Baburi sorghum of both villages), even if this could be a consequence of low statistical power (lower sample size for Baburi compared with Muskuwaari).
At harvesting time, each farmer chooses in his field a few panicles to be used as seed the following year (~20 panicles per acre). Different criteria are used for this selection. Notably, the chosen panicles have to exhibit specific morphological traits defining the morphotype of the landrace. Hybrid plants in the progeny not corresponding to the considered morphotype are eliminated after one or a few generations. As sorghum is preferentially selfing, the effectiveness of this selection could explain the fact that differentiation is sustained between landraces.
Conclusion
We used both model-based and model-free approaches to assess the genetic structure of dry-season sorghum landraces in two villages of northern Cameroon. Our results suggest that the genetic diversity of this sample is structured through different clusters. We showed that this genetic clustering is highly congruent with the taxonomical classification of farmers, who separate dry-season sorghum into two compartments (Muskuwari and Baburi) and also classify individuals into distinct landraces. We also assessed the genetic diversity of these landraces. The observed genetic differentiation is likely to be the result of a limited gene flow (favoured by selfing and shift in landrace cycles) and an ongoing selection by farmers. Understanding the relationship between local taxonomy and genetic diversity provides a basis for future studies about genetic resources management and conservation.
Acknowledgements
We acknowledge Jacques Chantereau for assistance in the determination of landraces. We thank Laurence Dedieu, Eric de Garine, Aboubakar Moussa, Christine Raimond, Richard Kenga and Thierry Robert for their help and discussion during this study, and Doyle McKey for very useful comments on an earlier version of the manuscript. We also thank the anonymous reviewers. This research was financially supported by the ANR (project PLANTADIV) and by the core fund of CIRAD. Laboratory assistance of Laure Benoit is gratefully acknowledged. The authors thank the laboratory of service of genetic markers in ecology (SMGE) and the sequencing and genotyping service of the IFR 119 of the University of Montpellier II for technical support.


