NOMENCLATURE
- a
-
core radius of wing-tip vortices
- b
-
wing span
- ba
-
moment arm of ailerons
- c
-
wing chord
-
 $\bar{c}$
-
mean geometric wing chord
- cr
-
root chord
- ct
-
tip chord
-
 $\vec{e_i}$
-
base vectors (i = x, y, z)
- f
-
re-scaling of
 $\bar{f}$
-
 $\bar{f}$
-
usable fraction of maximum roll control moment
- g
-
acceleration of gravity
- h
-
dimensionless factor specified by wing planform
- l
-
lift per unit span
- u
-
tangential velocity of a vortex
- w
-
downwash velocity
- x
-
separation distance calculated from the present model
-
 $\bar{x}$
-
separation distance specified by ICAO (Table 2) or FAA (Table 5)
- y
-
lateral coordinate (Fig. 2)
- y 0
-
lateral distance of vortex axis from aircraft axis
- yr , yl
-
lateral distance of right, left vortex axis from aircraft axis
- z
-
altitude (Fig. 1)
- A
-
leading aircraft parameter with the dimensions of length
- B
-
dimensionless aircraft interaction parameter
- CA
-
aileron lift coefficient
-
 ${C_{l{\hspace{1.0pt}} {\hspace{1.0pt}} \delta \alpha \max }}$
-
maximum aileron lift coefficient
- CL
-
lift coefficient
- F
-
vorticity decay function
- G
-
aircraft similarity factor
- G 1, G 2
-
aircraft dissimilarity factors
- LA
-
total wing lift
- L
-
rolling moment related to wing lift
- La
-
rolling moment due to the ailerons
- S
-
wing area
- Sa
-
total aileron area
- U
-
incident flow velocity
-
 $\vec{V}$
-
total flow velocity
- W
-
maximum landing weight
- X
-
dimensionless separation distance
Greek symbols
- α
-
angle-of-attack of incident stream
-
 $\bar{\alpha }$
-
angle-of-attack due to downwash
- δ
-
aileron deflection
- λ
-
taper ratio of wing platform
- μ
-
roll control authority
- ν
-
relative volume loading
- η
-
shear viscosity
- ζ
-
bulk viscosity
- ξ
-
dimensionless spanwise coordinate
- ρ
-
mass density of air
- ϑ
-
volume loading
-
 $\vec{\Omega }$
-
vorticity vector
- Ω
-
scalar vorticity
- Ω r , −Ω l
-
vorticity of right, left vortex
- Γ0
-
initial wing vortex circulation strength
Subscripts
- 1
-
wake generating (leading) aircraft e.g. chord c 1
- 2
-
wake entering (following) aircraft e.g. chord c 2
- a
-
aileron
- ℓ
-
ICAO light aircraft (W < 7t) or FAA light aircraft (W < 18.6t)
- m
-
ICAO medium aircraft (7t < W < 136t) or FAA large (18.6t < W < 115t)
- h
-
heavy aircraft (W > 136t) or FAA heavy aircraft (W > 115t)
- s
-
FAA special aircraft: Boeing 757
- v
-
Very Large Airliner (VLA): Airbus A380
Acronyms
- ATM
-
Air Traffic Management
- ICAO
-
International Civil Aviation Organization
- FAA
-
Federal Aviation Administration
- SSD
-
Safe Separation Distance
- VLA
-
Very Large Airliner
1.0 INTRODUCTION
For the purpose of specifying separation standards, the International Civil Aviation Organization (ICAO) rules(1) divide aircraft into three categories (Table 1) using their maximum take-off weight as the only criterion: ‘light’ weighing less than 7t, ‘heavy’ weighing more than 136t, and ‘medium’ in between. A relatively wide variety of aircraft falls into each of these three categories, some examples(Reference Jackson2) being given in the Table 1, viz. a jumbo, a narrow-body airliner and a business jet, respectively, in the ‘heavy’, ‘medium’ and ‘light’ categories. A matrix covering all combinations of the three categories (Table 2) specifies the minimum separation distance, which is larger for heavier leading aircraft and lighter following aircraft. The values chosen for the separation distance are empirical (i.e. based on experience). The division of aircraft into three categories is also empirical. In this respect, aircraft whose weight lies near the borderline values W = 7t or 136t separating different categories, show the ambiguity of the criteria.
Table 1 ICAO aircraft weight classification into heavy, medium and light, and aircraft chosen as examples in each category

Table 2 Comparison of ICAO empirical separation distances for a pair of aircraft from each class with the calculation (65b) for the example aircraft

Too short a separation distance can be a safety hazard, in the sense that the following aircraft may not have the roll control power to cope with the effects of the wake of the leading aircraft, leading to an incident or accident. If, in order to preserve safety, separation distances are made too long, this will reduce the number of aircraft which can land and take-off from a given runway and thus limit airport capacity. Airport capacity is the limit on Air Traffic Management (ATM) capacity, more often than en-route traffic, which in many cases could accept a higher density. Thus, the separation distances between aircraft must ensure safety, without unnecessarily limiting airport capacity, and are linked in this way to the growth of air traffic. Another link concerns the design of new generations of higher-capacity aircraft,(Reference Thomas3) which we may designate generically as Very Large Airliner (VLA), that can increase airport capacity if separation distances are not increased. If the separation distances were increased in the same proportion as the number of passengers, then the runway capacity would be the same: a smaller number of larger aircraft with increased spacing would land the same number of passengers per unit time. Thus, the interest in designing aircraft with reduced wake effects (leading aircraft) and reduced susceptibility to wakes (following aircraft).
The safe separation distance between aircraft can be calculated using the following sequence: (Section 2) the vorticity field in the wake of the leading aircraft can be affected by viscosity, turbulence, wind and other atmospheric effects(Reference Spalart4,Reference Rossow5) , which are simplified(Reference Spreiter and Sacks6) as a diffusion process with a turbulent viscosity(Reference Ginevsky and Zhelannikov7); (Section 3) the resulting vorticity field is used to calculate the effect on the following aircraft e.g. the rolling moment(Reference Etkin8,Reference Campos and Marques9) ; (Section 4) the response of the following aircraft is assessed taking into account the characteristics of its control system(Reference McRuer and Askhenas10); (Section 5) the results may be compared with the ICAO safety standards for the pair of categories to which the leading and following aircraft belong, and also to very large (VLA) and special aircraft (B-757) with peculiar separation needs (Section 6); (Section 7) the Safe Separation Distance (SSD) depends not only on aircraft characteristics and flight regime but also (Section 8) on atmospheric and ground effects that affect wake vortex evolution and have implications for take-off and landing at airports (Section 9). The preceding sequence of assessment of vortex wake effects(Reference Perry, Hinton and Stuever11-Reference Hinton, Charnock, Bagwell and Grigsby13) has been implemented in the literature(Reference Hinton, Charnock, Bagwell and Grigsby13-Reference Spalart15) using numerical methods and simulations. The present paper may be the first attempt to give an analytical formula for the safe separation distance between aircraft, due to wake effects; its derivation tries to use the simplest possible model of each stage of the process.
2.0 EVOLUTION OF VORTICITY WITH DISTANCE AND TIME IN THE PRESENCE OF VISCOSITY
The wake of the leading aircraft consists of two counter-rotating wing-tip vortices(Reference Spreiter and Sacks6) whose motion is affected by the mutual Biot-Savart interaction force between the vortices and also by the ambient wind, atmospheric stratification and ground proximity(Reference Sarpkaya16,Reference Burham17) ; these effects determine the trajectory of the vortices, which may take them out of the path of the following aircraft. Also, the vortices may become unstable (“Crow” instability(Reference Crow18) and long wavelength instability(Reference Tsai and Widnall19)); vortices may also combine, reducing their number, and break down into smaller vortices forming a turbulent cascade. The drift of the vortices and the decay of vorticity determine their influence on the following aircraft depending on the location of the vortices and their strength at the time of the encounter. Since this paper is not a numerical simulation and aims at an analytical model of the preceding effects, they are represented together as a diffusion process. The wake vortex decay process can be quite complex and dependent on atmospheric conditions(Reference Crow and Bate20-Reference Sarpkaya and Daly22), requiring the use of modelling techniques such as Reynolds-Averaged Navier-Stokes equations (RANS), Large Eddy Simulation (LES) and more recently Detached Eddy Simulation (DES). The objective of obtaining a simple analytic formula for aircraft separation distances due to wakes is met by a much simpler model of the evolution of vorticity as a diffusion process with enhanced viscosity. The vorticity decay model used in the present paper has been validated by comparison with the Memphis database(Reference Campbell, Dasey, Freebart, Heinrichs, Matthews, Perras and Rowe23). In the present model, the estimation of the decay of vorticity with distance and time, starts from(Reference Batchelor24,Reference Campos25) the Navier-Stokes equation for an incompressible fluid:
 $$\begin{equation}
\frac{{\partial \vec{V}}}{{\partial t}} + \nabla \left( {\frac{{V^2 }}{2}} \right) + \vec{V} \wedge \left( {\nabla \wedge \vec{V}} \right) + \frac{{\nabla p}}{\rho } = \eta \nabla ^2 \vec{V} + \left( {\zeta + \frac{\eta }{3}} \right)\nabla \left( {\nabla .\vec{V}} \right) ;
\end{equation}$$
taking the curl, yields(Reference Campos25,Reference Lighthill26) Equation (2b):
for the vorticity (2a).
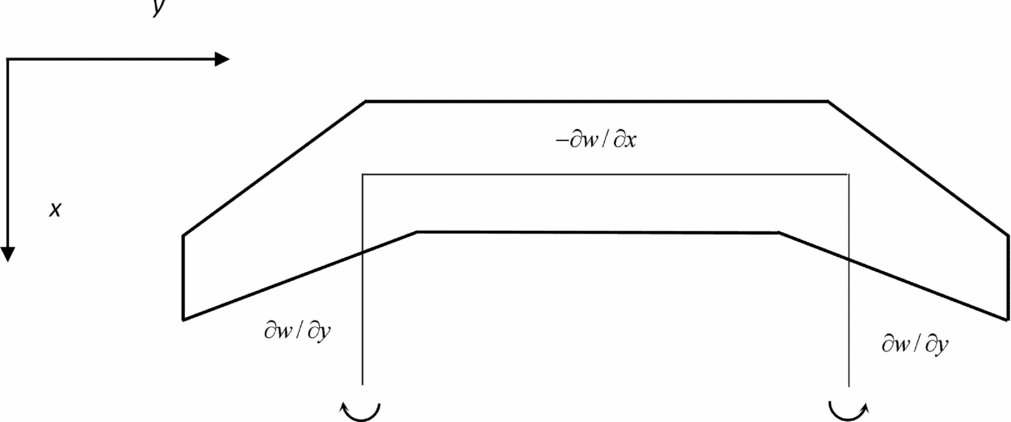
Far into the wake of the leading aircraft, it is assumed that the velocity field consists(Reference Milne-Thomson27,Reference Campos28) of the uniform stream plus a downwash (Fig. 1):
the vorticity (Fig. 2):
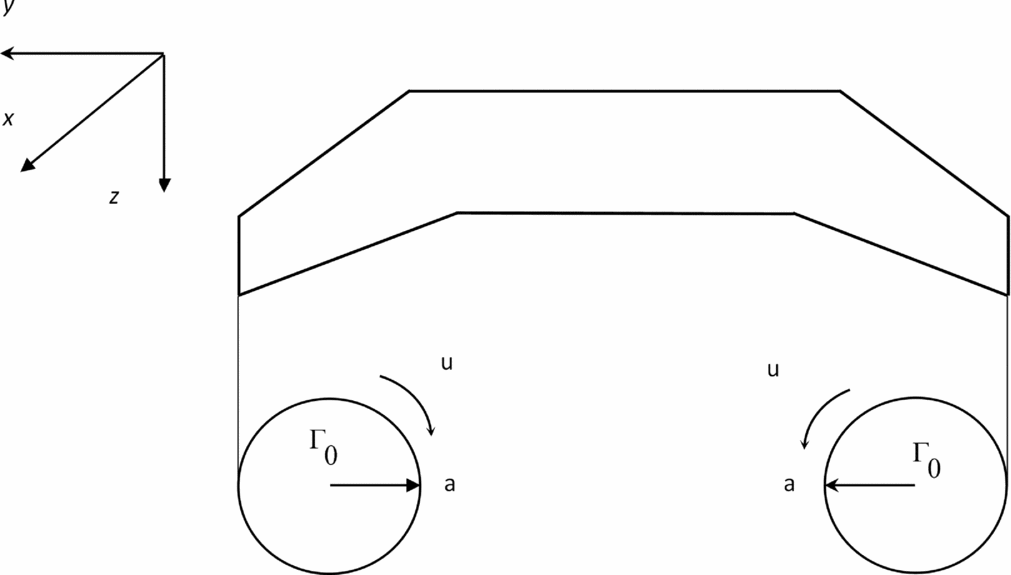
by the wing-tip vortices (Fig. 3):
since variations along the wake are smaller than across it. The flow velocity (3) and vorticity (5b) are used to calculate the Lamb vector(Reference Lamb29) or vortical force per unit mass(Reference Campos28):
implying that in:
the first term is dominant, again because transverse gradients are much larger than longitudinal gradients in the wake; with this assumption, the vorticity Equation (2a,b) indeed reduces to its x-component:

Figure 1. Wing section of leading aircraft in an incident stream of velocity U, with downwash velocity w and angle
![]() $\bar{\alpha }$
, and total velocity
$\bar{\alpha }$
, and total velocity
![]() $\vec{V}$
.
$\vec{V}$
.
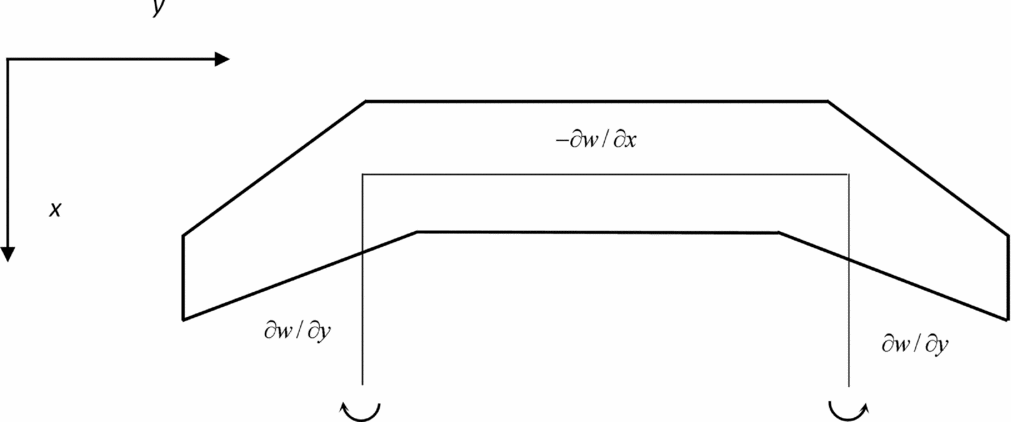
Figure 2. For a uniform stream incident on the leading aircraft with downwash in its wake are indicated the components of vorticity corresponding to the horseshoe vortex.
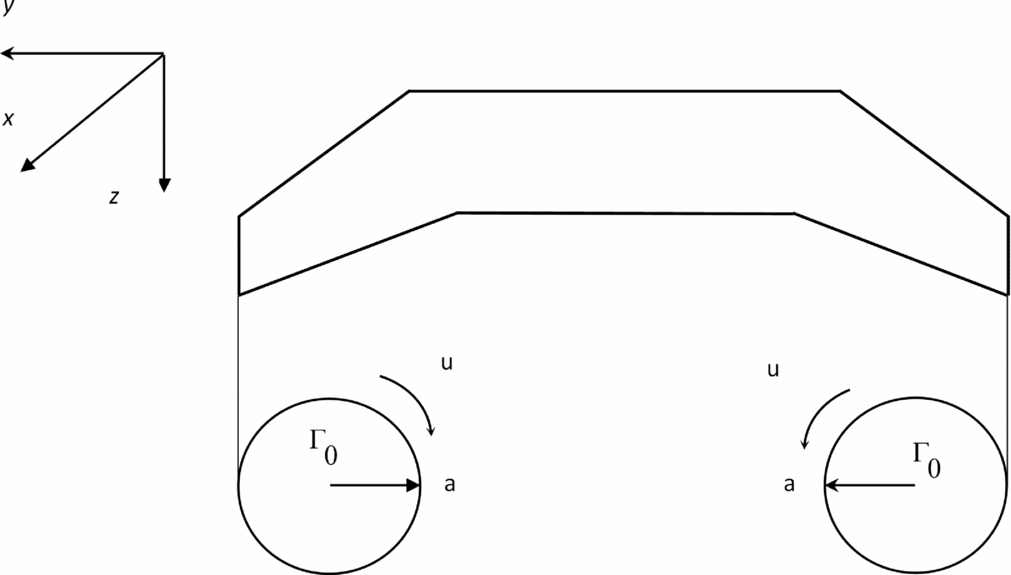
Figure 3. Rolling up of the vortex sheet trailing from the wing of the leading aircraft at large distance into two wing-tip vortices of core radius a, strength Γ0 and tangential velocity u.
This is a scalar diffusion equation(Reference Carslaw and Jaeger30), with the kinematic shear viscosity acting as diffusivity, and the downwash velocity w convecting the vorticity.
The downwash velocity is constant for elliptic loading; assuming small deviations from this, it may be taken as a constant in the general solution of (9), which is given(Reference Landau and Lifschitz31) by:
where F is the vorticity decay function. If the distance of the following (entering) aircraft from the leading (generating) aircraft x is much larger than the span b ≪ x, the trailing vorticity Ω may be seen if viewed relative to a point source, whose strength is the initial vortex circulation strength Γ0, corresponding to the convected diffusion heat type Equation (9) forced(Reference Lighthill32,Reference Campos33) by a delta function point singularity:
The forced solution of (11) is:
which specifies the evolution of the vorticity (6), with distance and time. In order to concentrate on the time dependence, the transverse distance may be replaced by the vortex core radius, where the tangential flow velocity is maximum, viz.:
so that vorticity now depends only on the vertical coordinate z and time t. The latter is specified by the speed of the leading aircraft U and distance x of the following aircraft:
If the distance between the leading and following aircraft is much larger than the vertical separation (15a), the vorticity simplifies to (15b):
and the vorticity depends only on aircraft separation.
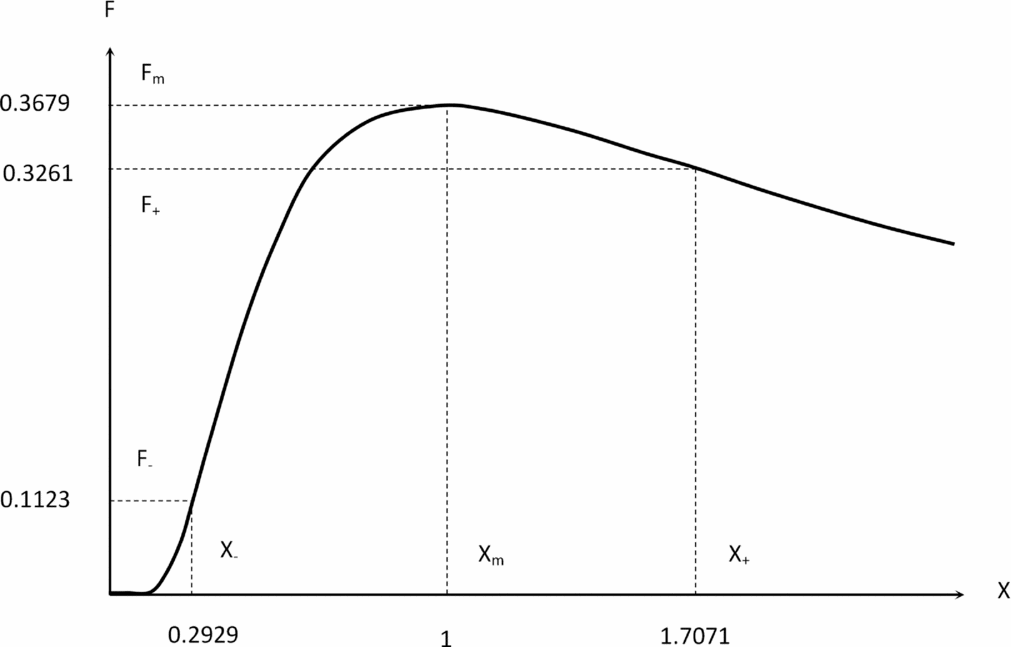
The vorticity (15b) initially increases in the wake of the leading aircraft as the wing-tip vortices roll up, and then the vorticity goes through a maximum before decaying slowly due to viscous dissipation (Figs 4 and 5). The ‘source’ of vorticity (11) is the initial vortex circulation strength that is given by:
where in steady, straight and approximately level flight, the weight equals lift:
thus, the vortex circulation strength may be related to the aircraft weight by
substituting (18) in (15b) specifies the vorticity
as a function of distance behind the leading aircraft. In the Equation (19), all the parameters refer to the leading aircraft (index ‘1’), except for the vorticity Ω2 that corresponds to the following aircraft (index ‘2’):
This Equation (20) specifies the separation distance x, if the vorticity Ω2 at the following aircraft is known. The latter will be determined from the maximum rolling moment that the following aircraft can compensate.
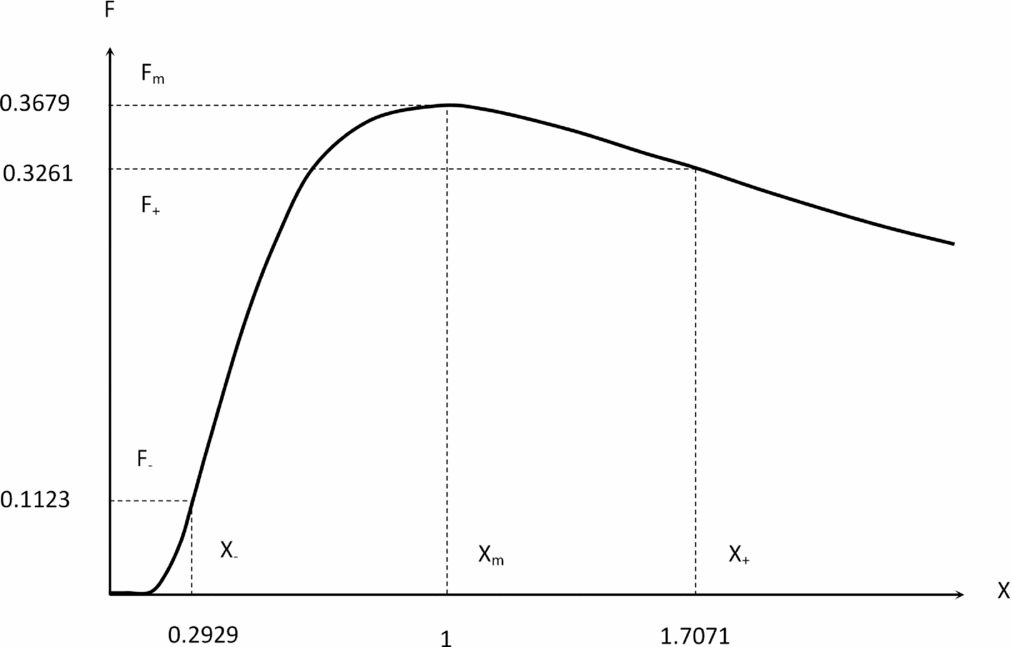
Figure 4. Wake vortex separation function (59) plotted versus distance from the leading aircraft x divided by the distance of A of peak vorticity X = x/A. The wing-tip vortex roll-up increases vorticity up to the maximum at X = 1, after which it decays by dissipation. There are inflexion points before X − and after X + the maximum.
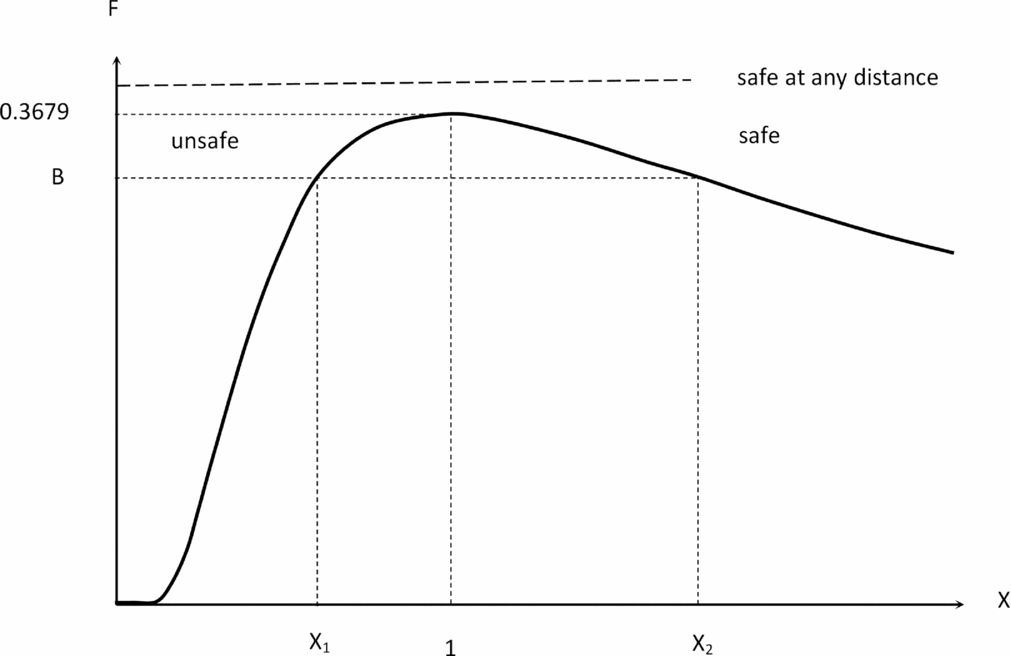
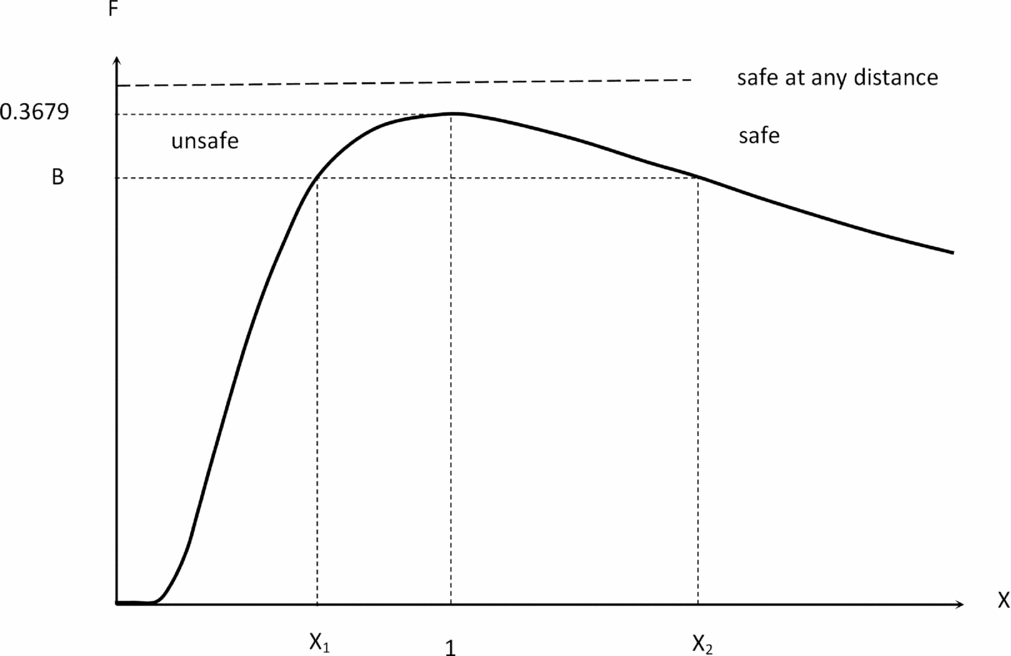
Figure 5. If the encounter parameter (60) exceeds the value B ⩾ 0.3679, the following aircraft can cope with the wake vortex of the leading aircraft at any distance. If B < 0.3679, the available roll control power is sufficient only outside the range (X 1, X 2), with X ⩽ X 1 being unsafe and X ⩾ X 2 safe.
3.0 EFFECT OF VORTICITY ON THE WING LIFT AND ROLLING MOMENT OF THE FOLLOWING AIRCRAFT
The velocity incident on the following aircraft is assumed to consist of the uniform free stream velocity U plus the tangential velocity due to the trailing vortices of the leading aircraft (3), implying (Fig. 1) a change in angle-of-attack:
which for small tangential velocity relative to the free stream velocity (22a) simplifies to (22b):
The approximation (22a) applies for
![]() $u \le 0.3{\hspace{1.0pt}} {\hspace{1.0pt}} U$
with a 0.32 = 0.09 or 9% accuracy and implies that
$u \le 0.3{\hspace{1.0pt}} {\hspace{1.0pt}} U$
with a 0.32 = 0.09 or 9% accuracy and implies that
![]() $\bar{\alpha }^2 \ll 1$
, and if the angle-of-attack is also small (23a), the lift coefficient simplifies for a Joukowsky aerofoil(Reference Milne-Thomson27,Reference Campos28) to (23b):
$\bar{\alpha }^2 \ll 1$
, and if the angle-of-attack is also small (23a), the lift coefficient simplifies for a Joukowsky aerofoil(Reference Milne-Thomson27,Reference Campos28) to (23b):
the lift per unit span of the following aircraft is given by:
that is, is reduced by the wake of the leading aircraft. Note that V 2 = U 2 + u 2 was substituted by U 2 in (24) because (22a,b) the tangential velocity u is small:
it is clear that the lift is proportional to the free stream velocity times the component of the free stream velocity perpendicular to the wing minus the tangential velocity. Thus, there is lift if Uα > u, there is a downforce if Uα < u, and in the intermediate case Uα = u, there is neither lift nor downforce.
The wake of the leading aircraft (Fig. 2) consists of two counter-rotating vortices (Fig. 3). Each vortex induces a tangential velocity that follows two laws: (i) outside the vortex core r > a, the tangential velocity decays(Reference Milne-Thomson27,Reference Campos28) like u = Γ0/(2πr), conserving the circulation so that the vorticity is zero; (ii) thus, the vorticity is concentrated in the vortex core r < a, and several velocity profiles u(r) have been proposed e.g. the Rankine, Lamb-Oseen and Hallock & Burnham models(Reference Campos25,Reference Hinton and Tatnall34) . In the present work, the vorticity Ω specified by (7) is interpreted as the vorticity averaged over the span of the following aircraft. Since the vorticity (6) is constant (26a), the tangential velocity will be given at the following aircraft by (26b):
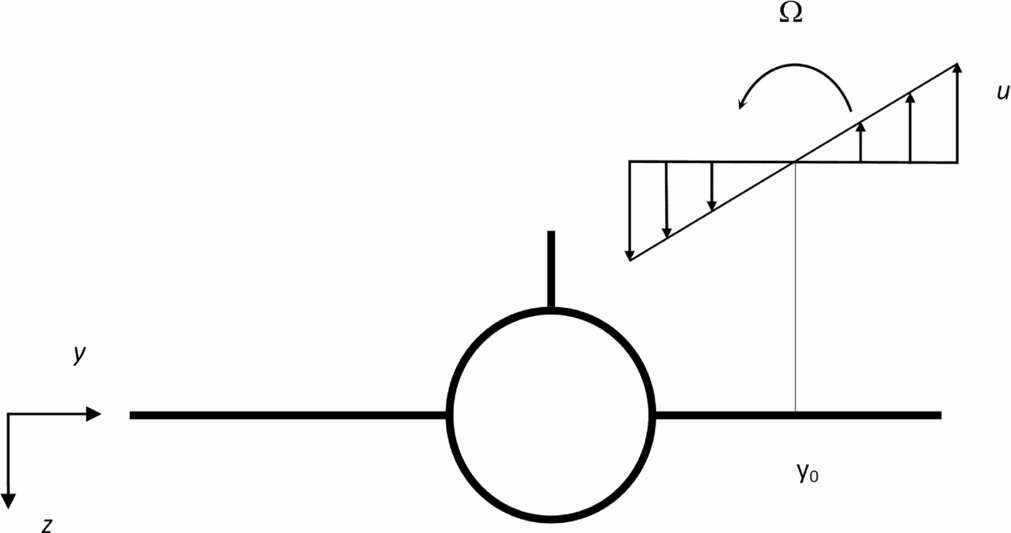
where y 0 is (Fig. 6) the lateral distance between the vortex axis and the aircraft axis, and it is assumed that the two axes are parallel. The calculations of lift change and rolling moment induced by the wake will be made first for a single vortex (26b) and extended subsequently to two counter-rotating vortices (36). The consideration of encounter geometry in which the aircraft flies parallel to the vortex may correspond to a worst-case scenario. Substitution of (26b) in (25) specifies the lift per unit span:
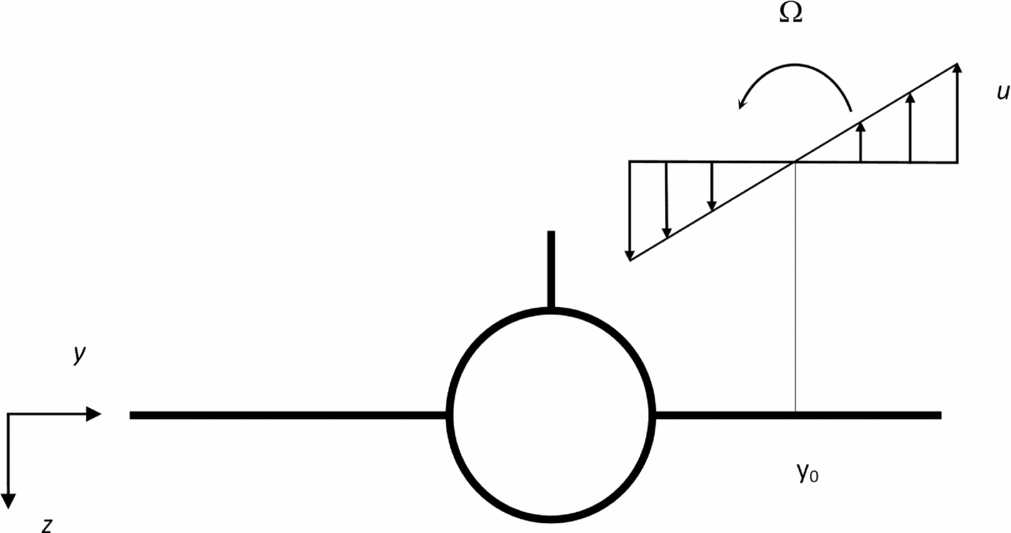
Figure 6. Vortex due to the leading aircraft, with the axis at distance y 0 from the axis of the following aircraft, with constant vorticity Ω and tangential velocity u varying along the span of the following aircraft.
In the total lift,
 $$\begin{equation}
L_A = \pi \rho U\left( {U\alpha - \Omega y_0 } \right)\int _{ - b/2}^{ + b/2} {} c\left( y \right)dy + \pi \rho U\Omega \int _{ - b/2}^{ + b/2} {} y \;\, c\left( y \right)dy,
\end{equation}$$
(i) the second term vanishes (29b) for a symmetrical wing (29a):
 $$\begin{equation}
\quad c\left( y \right) = c\left( { - y} \right): \quad \quad \quad \quad \quad \quad \int _{ - b/2}^{ + b/2} {y\;c\left( y \right)} \;dy = 0, \quad \quad \quad \quad
\end{equation}$$
and (ii) in the first term, the integral of the chord over the span is the wing area:
 $$\begin{equation}
S = \int _{ - b/2}^{ + b/2} {c\left( y \right)} \;dy, \quad \quad \quad \quad
\end{equation}$$
leading to:
There will be a lift loss
![]() $ \Delta L_A= -\pi \rho SU\Omega {\hspace{1.0pt}} {\hspace{1.0pt}} y_0 < 0$
if
$ \Delta L_A= -\pi \rho SU\Omega {\hspace{1.0pt}} {\hspace{1.0pt}} y_0 < 0$
if
![]() $\Omega {\hspace{1.0pt}} y_0 > 0$
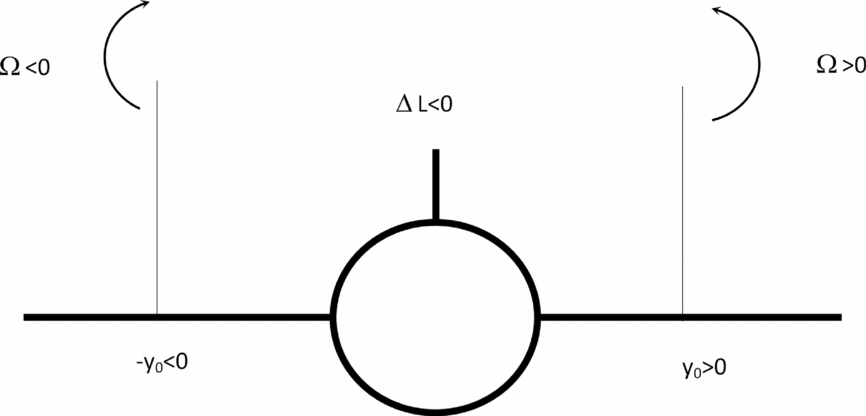
i.e. for (Fig. 7) positive (or counter-clockwise) vorticity Ω > 0 on the right (or starboard) side of the aircraft y
0 > 0 and for negative (or clockwise) vorticity Ω < 0 on the left (or port side of the aircraft) y
0 < 0; this is the situation for the following aircraft when it encounters the wake of the leading aircraft. The reverse situation of a lift gain ΔLA
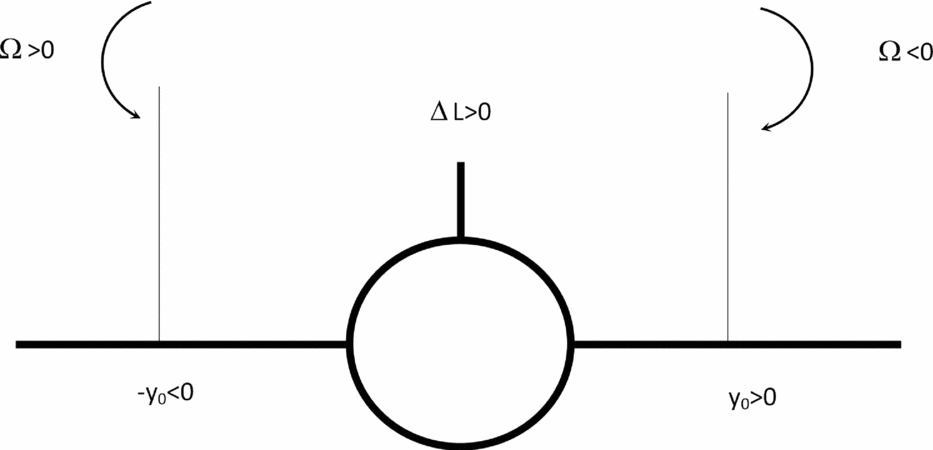
> 0 would be possible (Fig. 8) if
$\Omega {\hspace{1.0pt}} y_0 > 0$
i.e. for (Fig. 7) positive (or counter-clockwise) vorticity Ω > 0 on the right (or starboard) side of the aircraft y
0 > 0 and for negative (or clockwise) vorticity Ω < 0 on the left (or port side of the aircraft) y
0 < 0; this is the situation for the following aircraft when it encounters the wake of the leading aircraft. The reverse situation of a lift gain ΔLA
> 0 would be possible (Fig. 8) if
![]() $\Omega {\hspace{1.0pt}} y_0<0$
i.e. for a negative vortex Ω < 0 on the right side y
0 > 0 and a positive vortex Ω > 0 on the left side y
0 < 0. The latter situation can occur in formation flying and may exploited in nature by flocks of birds and by aircraft formations in long-range flight. The aircraft response to the lift loss will be a sink speed and an altitude loss when the wake is encountered. Another, and at least as important consequence of the wake vortex encounter, is the induced rolling moment, which is calculated next.
$\Omega {\hspace{1.0pt}} y_0<0$
i.e. for a negative vortex Ω < 0 on the right side y
0 > 0 and a positive vortex Ω > 0 on the left side y
0 < 0. The latter situation can occur in formation flying and may exploited in nature by flocks of birds and by aircraft formations in long-range flight. The aircraft response to the lift loss will be a sink speed and an altitude loss when the wake is encountered. Another, and at least as important consequence of the wake vortex encounter, is the induced rolling moment, which is calculated next.
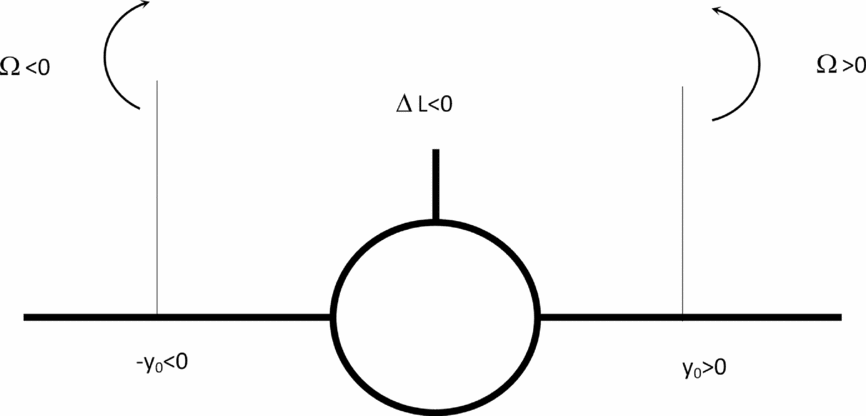
Figure 7. A lift loss will be caused by a positive (counter-clockwise) vortex incident on the right (starboard) wing, and a negative vortex (clockwise) incident on the left (port) wing e.g. an aircraft in the wake of another.
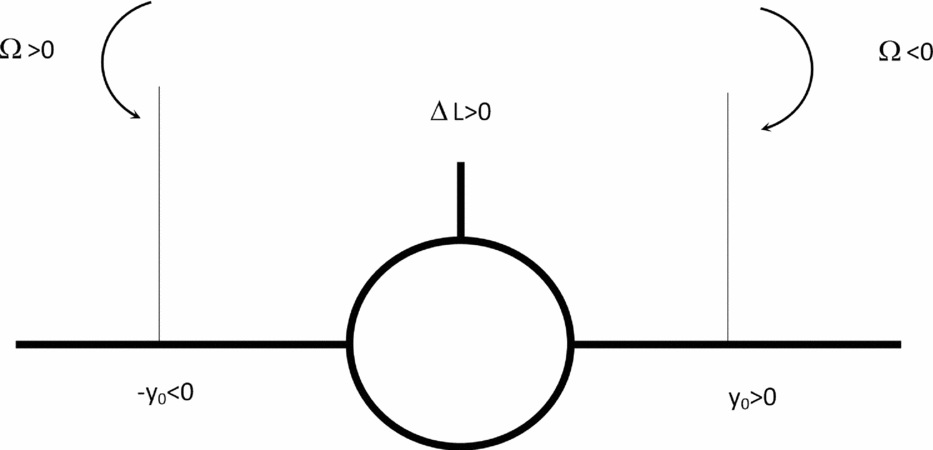
Figure 8. A lift gain will be caused by a negative vortex incident on the starboard wing or a positive vortex on the port wing e.g. one of those applies to formation flying.
Introducing the lift coefficient CL (α) = 2πα into the total lift (30), viz.,
confirms the condition for lift loss Ωy 0 > 0 or gain Ωy 0 < 0 due to incident longitudinal vorticity and shows that the lift would vanish LA = 0 for Ωy 0 = αU. Far below (32a) this value of Ω, the incident vorticity does not affect lift that equals weight for steady, straight and level flight (32b):
It is seen next that the rolling moment:
 $$\begin{equation}
L \equiv \int \limits _{ - b/2}^{ + b/2} {y\;l\left( y \right)\;{\rm {d}}y},
\end{equation}$$
which is related to the lift per unit span (27):
 $$\begin{equation}
L = \pi \rho U\left( {U\alpha - \Omega y_0 } \right)\,\int _{ - b/2}^{ + b/2} {\,y\ c\left( y \right){\hspace{1.0pt}} dy + \pi \rho U\Omega \,} \int _{ - b/2}^{ + b/2} {\,y^2 } c\left( y \right)dy,
\end{equation}$$
is independent (35b) of the position of the vortex y 0 for (26a) a symmetrical wing (35a):
 $$\begin{equation}
\quad c\left( y \right) = c\left( { - y} \right):{\text{ }} \quad \quad \quad \quad \quad \quad \quad \quad L = \pi \rho U\Omega \,\int _{ - b/2}^{ + b/2} {} y^2 c\left( y \right)dy.
\end{equation}$$
In this case, the rolling moment is proportional to the vorticity. This rolling moment must be compensated by the following aircraft in order to retain safe flight.
In the calculation of the induced rolling moment (35b), only one vortex was considered (26b). Actually, the wake of the leading aircraft consists of two vortices, with an axis at yr for the right one and an axis at yl for the left one, that have vorticities with opposite signs, respectively Ω r and − Ω l , leading to:
The rolling moment can be calculated from
and is not affected by the constant term in (37a), as was the case for the first term of (26b) in (34). Thus, (35a,b) holds again in this case (37a), with Ω denoting the difference between the vorticities of the left and right vortices (37b). In the preceding calculation, it was assumed that Ω represents the vorticity averaged over the following aircraft, hence the integration over − b/2 ⩽ y ⩽ b/2. If only the vortex core radius a is considered, with axis at y 0, then the integration is over max{ − b/2,y 0 − a} ⩽ y ⩽ min{y 0 + a, b/2} e.g. for a vortex core radius a = b/20. In this case, the constant term in (26b) or (37a) i.e. the position of the vortex (vortices) may affect the rolling moment. Thus, the choice of a vorticity averaged over the span of the following aircraft reduces the number of parameters in the problem because it replaces Ω r , Ω l , yr and yl , by the Ω alone. It includes the extreme case of the vortices trailing from the leading aircraft covering the span of the following aircraft b 1/10 > b 2, which would be a worst-case scenario applying only to leading aircraft much larger than the following aircraft. The rolling moment induced by the wake is specified by (35a,b), which involves the factor (38b)
 $$\begin{equation}
\quad \;c\left( y \right) = const \equiv \bar{c}:{\text{ }}\int _{ - b/2}^{ + b/2} {y^2 c\left( y \right)dy = \bar{c}{\hspace{1.0pt}} {\hspace{1.0pt}} b^3 /12};
\end{equation}$$
which takes a simple form for a rectangular wing whose chord is constant (38a) and hence equal to the mean chord.
Formula (38b) suggests that, for any wing shape, a wing planform factor be defined by:
 $$\begin{equation}
h \equiv \frac{{12}}{{\bar{c}{\hspace{1.0pt}} b^3 }}\;\int _{{\hspace{1.0pt}} - b/2}^{{\hspace{1.0pt}} + b/2} {y^2 } {\hspace{1.0pt}} {\hspace{1.0pt}} {\hspace{1.0pt}} c\left( y \right){\hspace{1.0pt}} {\hspace{1.0pt}} dy
\end{equation}$$
It is clear that the wing planform factor is unity (40b) for a rectangular wing (40a):
and it is calculated in the Appendix for a wing with straight leading and trailing edges e.g. a trapezoidal or a delta wing. The wing planform factor (39) depends only on wing shape and is in general of order unity. The wing planform factor (39) appears in the rolling moment (35a,b) due to the incident vorticity:
where the wing area
![]() $S=\bar{c}b$
is introduced:
$S=\bar{c}b$
is introduced:
The rolling moment (42) induced by the vortex wake is proportional to the vorticity, and as the vorticity decays, the induced rolling moment also reduces. Thus, the aircraft separation is the parameter of choice, in the sense that if it is large enough, the vorticity in the wake of the leading aircraft will have decayed enough for the following aircraft to cope with the induced rolling moment. The induced rolling moment increases proportionally to the area of the wing because a larger wing ‘catches’ more of the average vorticity. The wing span appears to the square in the induced rolling moment, because a wing of larger span catches more of the average vorticity, and also further outboard where the moment arm is larger. The induced rolling moment is also proportional to the air density and airspeed i.e. to the momentum of the flow, which is larger for lower altitude and higher landing speed, in the landing case. The induced rolling moment is also proportional to the wing planform factor (39), which is unity for a rectangular or unswept wing (40a,b), and smaller for other wing planform shapes (Appendix) e.g. it takes the value one-half h = 1/2 for a delta wing, and an intermediate value h = 5/6 for a swept wing with taper ratio 2 (i.e. root chord twice the tip chord).
4.0 ROLL CONTROL MOMENT REQUIRED TO COMPENSATE THE WAKE EFFECTS
The roll control moment available in the following aircraft is proportional to the total area of the ailerons Sa
and their moment arm ba
, and the maximum aileron lift coefficient
![]() ${C_{l{\hspace{1.0pt}} {\hspace{1.0pt}} \delta \alpha \max }}$
:
${C_{l{\hspace{1.0pt}} {\hspace{1.0pt}} \delta \alpha \max }}$
:
assuming that the aileron are the only roll control surfaces available or used to counter the effects of the wake of the leading aircraft. The maximum available roll control moment using the airlerons alone (43) is proportional to (i) the maximum lift coefficient of the ailerons
![]() ${C_{l{\hspace{1.0pt}} {\hspace{1.0pt}} \delta \alpha \max }} = {C_{l{\hspace{1.0pt}} {\hspace{1.0pt}} \delta \alpha }}\left( {{\delta _{\max }}} \right)$
, which depends on the maximum deflection δmax without flow separation; (ii) the air density, which is larger at lower altitude and appears in the same way in the wake vortex-induced rolling moment so that it cancels out in the comparison of the two; (iii) the square of the airspeed, which specifies the lift or downforce on the ailerons; (iv) the aileron area Sa
, which can be increased, up to structural limits on bending loads, or aeroelastic limits on flutter or control inversion due to wing bending or torsion; (v) the aileron moment arm, which can be increased by placing the ailerons further outboard, limited by the half-span ba
< b/2 and structural and aeroelastic considerations. Assuming that only a fraction
${C_{l{\hspace{1.0pt}} {\hspace{1.0pt}} \delta \alpha \max }} = {C_{l{\hspace{1.0pt}} {\hspace{1.0pt}} \delta \alpha }}\left( {{\delta _{\max }}} \right)$
, which depends on the maximum deflection δmax without flow separation; (ii) the air density, which is larger at lower altitude and appears in the same way in the wake vortex-induced rolling moment so that it cancels out in the comparison of the two; (iii) the square of the airspeed, which specifies the lift or downforce on the ailerons; (iv) the aileron area Sa
, which can be increased, up to structural limits on bending loads, or aeroelastic limits on flutter or control inversion due to wing bending or torsion; (v) the aileron moment arm, which can be increased by placing the ailerons further outboard, limited by the half-span ba
< b/2 and structural and aeroelastic considerations. Assuming that only a fraction
![]() $\bar{f}<1$
of the available control moment is used (44b), to leave a margin for safety, the following aircraft will cope with the rolling moment induced by the leading aircraft if the condition (44a) is met:
$\bar{f}<1$
of the available control moment is used (44b), to leave a margin for safety, the following aircraft will cope with the rolling moment induced by the leading aircraft if the condition (44a) is met:
The roll control moment available is specified by (43), for comparison with the induced rolling moment (42) in the safety condition (44a) ≡ (45a):
where the ratio between the maximum aileron lift coefficient
![]() ${C_{l{\hspace{1.0pt}} {\hspace{1.0pt}} \delta \alpha \max }}$
and the wing lift coefficient CL
(α) has been incorporated (45b) in the factor f, representing a modified fraction of the available roll control authority used.
${C_{l{\hspace{1.0pt}} {\hspace{1.0pt}} \delta \alpha \max }}$
and the wing lift coefficient CL
(α) has been incorporated (45b) in the factor f, representing a modified fraction of the available roll control authority used.
Thus, (45a) the vorticity that can be compensated within the available control moment cannot exceed:
The vorticity scales on the free stream velocity divided by the span U/b, which is the only dimensional factor in (46). The maximum vorticity in the wake of the leading aircraft, which the following aircraft can cope with, is proportional to the airspeed U, because the roll control moment increases with airspeed squared U 2 in (43), whereas the induced rolling moment (42) is proportional to the airspeed U. The maximum vorticity the following aircraft can cope with is inversely proportional to the span, because a wing with smaller span catches a smaller portion of the vortex, and thus can cope with a larger average vorticity. The dimensionless factors show that a stronger vorticity can be compensated (i) if f increases i.e. a larger fraction of the available control moment is used; (ii) if h decreases i.e. the wing planform factor is less than unity; (iii) if the roll control ratio Saba/Sb increases, i.e. for larger control authority in terms of aileron area divided by wing area Sa/S, and larger aileron moment arm divided by wing span ba/b; and (iv) larger lift coefficient CL (α), because an aircraft with more lift has a smaller relative lift loss, as follows from (31):
where CL = 2πα was used, for small angle of attack α2 ≪ 1.
If the relative lift loss (47) is small (32a), the maximum vorticity (46) is given (17) by:
where the index ‘2’ has been used, because the parameters apply to the following aircraft, to distinguish from the leading aircraft (index ‘1’). For the parameters like the fraction of available control moment used f, the wing planform factor h, the aileron area Sa , the aileron moment arm ba , which are used only for the following aircraft, the index ‘2’ is suppressed, since there is no risk of confusion (these parameters do not appear for the leading aircraft). The maximum vorticity the following aircraft can cope with (48) is again proportional to the roll control ratio:
which is defined as the aileron area times the aileron moment arm, divided by the wing area times the span. This dimensionless factor is a measure of how much of the wing area and how far outboard it is used for the ailerons. It can be increased subject to structural and aeroelastic limits. Besides the roll control ratio (49), the maximum vorticity the following aircraft can cope with (48) is proportional to the relative volume loading (50a)
that is the ratio of the weight of the aircraft W 2, to the weight of the paralleliped of air of density ρ, with volume specified by the wing area S 2 multiplied by the span b 2. This can also be interpreted as the ratio (50a) of the volume loading ϑ to air density ρ, where the volume loading (50b) is the weight divided by wing area and span. Thus, the following aircraft can cope with a stronger vorticity if it is heavier, the wing area and span are small (it catches a smaller portion of the trailing vortex) and the air density is lower (i.e. higher altitude). The maximum vorticity the following aircraft can cope with also increases with decreasing airspeed, corresponding to a higher incidence configuration. It also increases with the fraction of available control moment used. It is inversely proportional to the wing planform factor, showing that a delta wing aircraft can cope with stronger vorticity than a swept-wing aircraft, or an unswept wing aircraft, because the wing has a smaller fraction of the total area outboard.
Substitution of (48) in the separation distance (20) yields:
For identical leading and following aircraft, the indices can be suppressed and the formula simplifies to:
which shows that the separation distance x increases as indicated by the aircraft similarity factor G, viz: (i) the fraction of the available control moment used f is reduced; (ii) the wing planform factor h increases; (iii) the roll control ratio Saba/Sb decreases; (iv) the span b, root chord cr and free stream velocity U increase, making the following aircraft more susceptible to the wake; and (v) the viscosity decreases, causing a slower decay of vorticity between the leading and following aircraft. In the case of dissimilar leading and following aircraft, an Equation (51) similar to (52) applies (53):
where the dissimilarity factor is specified by:
and the similarity factor (52) is replaced by:
The similarity factor (55) shows that the separations distance increases for (i) larger wing planform factor of following aircraft i.e. unswept wing worst, (ii) smaller ratio (45b) of aileron lift coefficient to wing lift coefficient of following aircraft, (iii) smaller roll control ratio (49) of following aircraft, (iv) larger span of following aircraft because it catches a larger portion of the average vorticity, (v) larger root chord of the leading aircraft because it leads to a stronger vortex wake circulation strength (16), (vi) larger airspeed of the following aircraft because it encounters the wake of the leading aircraft sooner when it has decayed less, and (vii) smaller viscosity because it causes the vorticity to decay more slowly and remains considerably stronger at encounter time when the trailing aircraft encounters the wake of the leading aircraft. The dissimilarity factor shows that the separation distance increases G 2 > 1 if (i) the leading aircraft is heavier than the following aircraft because it produces a stronger wake and (ii) the following aircraft has a larger wing area because it is more susceptible to the wake. Conversely, the separation distance will decrease for a lighter leading aircraft and a following aircraft with smaller wing area. The dissimilarity factor is the ratio of wing loadings of the leading and following aircraft and shows that the safe separation distance increases if the more highly loaded aircraft leads and decreases if it follows.
5.0 APPLICATION TO ALL COMBINATIONS OF ‘HEAVY’, ‘MEDIUM’ AND ‘LIGHT’ AIRCRAFT
The argument of the exponential in the formula (51) for the SSD suggests the introduction of the dimensionless variable:
where the leading aircraft parameter
is a constant with the dimensions of length. Equation (51) for the SSD can be written in the dimensionless form:
where the vorticity decay function is defined in dimensionless form by:
and the aircraft interaction parameter:
is a dimensionless constant. The method of determination of the SSD is clear: (i) B is calculated from (60), (ii) the solution X of (58) and (59) is found, and (iii) then (56) specifies x = XA, with A given by (57).
The preceding method of calculation of the SSD is illustrated by considering one aircraft in each of the three ICAO categories (Table 1) of heavy (h), medium (m) and light (ℓ). The examples taken are respectively a jumbo (Boeing 747-400), a narrow-body twin (Boeing 737-300) and a business jet (Cessna Citation 500), for which the relevant data is given in the Table 3. Note that the parameter (57) depends only on the leading aircraft and thus is included in the Table 3, because:
relates to the vortex core radius a 1 and to the approach speed U 1 = 1.3Vs i.e. 30% above the stall speed. The constant B involves (60) the leading and following aircraft in:
where the dissimilarity factor in (62) is:
and is given by the ratio of ‘volume loadings’:
the ‘volume loading’ (64) is the ratio of the weight of the aircraft to the volume defined by the wing area times the span
![]() $Sb=b^2\bar{c}$
i.e. the volume of a quadrangular parallelepiped with base equal to the span and height equal to the mean chord. Thus, the volume loading (64) equals the wing loading divided by the span.
$Sb=b^2\bar{c}$
i.e. the volume of a quadrangular parallelepiped with base equal to the span and height equal to the mean chord. Thus, the volume loading (64) equals the wing loading divided by the span.
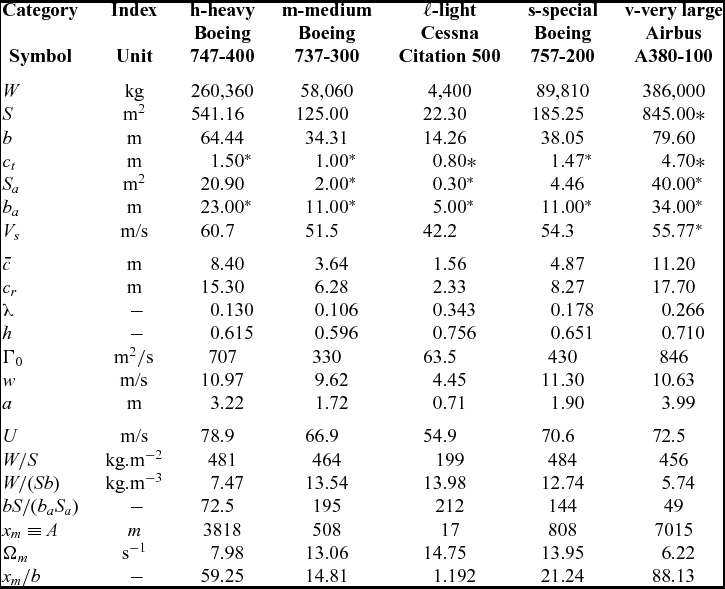
Table 3 Data needed on each example aircraft to calculate separation distances including the also special and very large aircraft: basic aircraft data − top part; other data calculated from the aircraft data − middle part; data related to the SSD − bottom part; *estimated
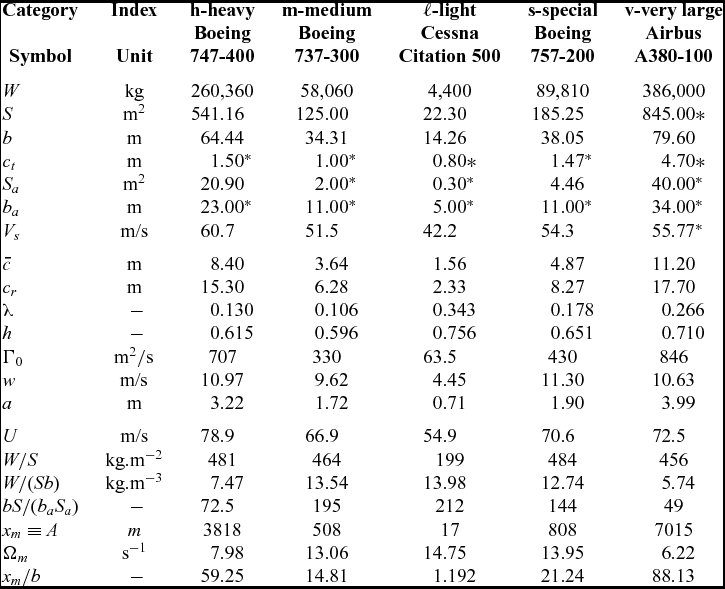
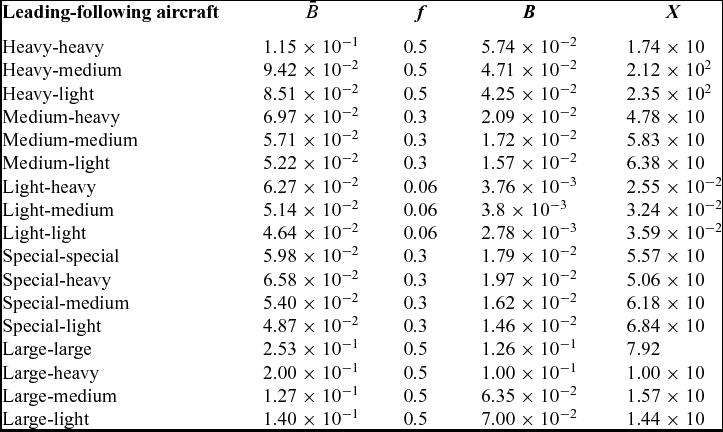
Note that in (61) and (62) two parameters have been singled out, namely the turbulent kinematic viscosity η and the percentage of available control moment used f, whose values are open to some choice. The values of
![]() $\bar{A}$
and
$\bar{A}$
and
![]() $\bar{B}$
, defined respectively by (61) and (62), are given in the Tables 3 and 4. The data taken from(Reference Stuever35,Reference Campos and Marques36) is the following in the upper part of the Table 3: (i) maximum landing weight W; (ii) wing area S; (iii) wing span b; (iv) wing-tip chord ct
, estimated in all cases (as indicated by the asterisk *); (v) total aileron area Sa
; (vi) aileron moment arm ba
; (vii) stalling speed Vs
at maximum landing weight. From this data, the following quantities are calculated at the middle part of the Table 3: (viii) the mean chord
$\bar{B}$
, defined respectively by (61) and (62), are given in the Tables 3 and 4. The data taken from(Reference Stuever35,Reference Campos and Marques36) is the following in the upper part of the Table 3: (i) maximum landing weight W; (ii) wing area S; (iii) wing span b; (iv) wing-tip chord ct
, estimated in all cases (as indicated by the asterisk *); (v) total aileron area Sa
; (vi) aileron moment arm ba
; (vii) stalling speed Vs
at maximum landing weight. From this data, the following quantities are calculated at the middle part of the Table 3: (viii) the mean chord
![]() $\bar{c}$
from
$\bar{c}$
from
![]() $\bar{c} \equiv S/b$
; (ix) the root chord cr
from (A.4a); (x) the taper ratio λ from (A.4b); (xi) the wing planform factor h from (A.10); (xii) the vortex strength Γ0 from (18); (xiii) the downwash velocity from w = Γ0/b; (xiv) the vortex core radius from a = b/20. A third set of seven parameters related to the SSD are indicated in the bottom part of the Table 3: (xv) the approach speed U
1 = 1.3VS
above the stall speed VS
by 30%; (xvi) the wing loading W/S; (xvii) the volume loading (64); (xviii) the inverse of the roll control ratio (49); (xix-xxi) the peak vorticity Ω
m
and the distance xm
behind the leading aircraft at which it occurs measured in wing spans xm/b.
$\bar{c} \equiv S/b$
; (ix) the root chord cr
from (A.4a); (x) the taper ratio λ from (A.4b); (xi) the wing planform factor h from (A.10); (xii) the vortex strength Γ0 from (18); (xiii) the downwash velocity from w = Γ0/b; (xiv) the vortex core radius from a = b/20. A third set of seven parameters related to the SSD are indicated in the bottom part of the Table 3: (xv) the approach speed U
1 = 1.3VS
above the stall speed VS
by 30%; (xvi) the wing loading W/S; (xvii) the volume loading (64); (xviii) the inverse of the roll control ratio (49); (xix-xxi) the peak vorticity Ω
m
and the distance xm
behind the leading aircraft at which it occurs measured in wing spans xm/b.
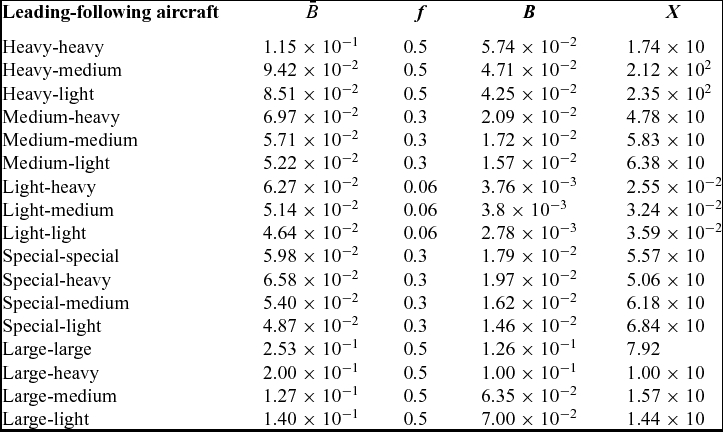
Table 4 The aircraft interaction parameter (62) is indicated for all combinations of three categories of aircraft: heavy (h), medium (m) and light (ℓ), plus the special (s) and very large (v)
For dimensionless separation distances X ⩾ 17.2, which will be found in the sequel (see Table 4), the factor exp( − 1/X) ⩾ 0.9435, implying that there is an error of less than 6%, in simplifying the vorticity decay function (59) to F(X) = 1/X in (58); thus (59) reduces to (65a), in which case (56) the SSD can be calculated explicitly as (65b):
where (61) and (62) were used to separate the terms
![]() $\bar{A},\bar{B,}$
which are specified by aircraft design and encounter parameters, from the two parameters which are open to some choice: (i) the turbulent kinematic shear viscosity η and (ii) the fraction f of the available control moment that is used. Since these appear only as a product fη, its value can be determined by matching to one case. The case chosen is the ICAO separation for two heavy aircraft
$\bar{A},\bar{B,}$
which are specified by aircraft design and encounter parameters, from the two parameters which are open to some choice: (i) the turbulent kinematic shear viscosity η and (ii) the fraction f of the available control moment that is used. Since these appear only as a product fη, its value can be determined by matching to one case. The case chosen is the ICAO separation for two heavy aircraft
![]() $x=4\text{\,nm}=7.41 \times 10^3\,\text{m}$
, taking the B747-400 as the heavy aircraft, for which
$x=4\text{\,nm}=7.41 \times 10^3\,\text{m}$
, taking the B747-400 as the heavy aircraft, for which
![]() $\bar{A}=4.09 \times 10^2 \text{ m}^3/\text{s}$
from the data in the Table 3 and
$\bar{A}=4.09 \times 10^2 \text{ m}^3/\text{s}$
from the data in the Table 3 and
![]() $\bar{B}=1.15 \times 10^{-1}$
from the Table 4. It follows that
$\bar{B}=1.15 \times 10^{-1}$
from the Table 4. It follows that
![]() $f\eta = \bar{A}/(\bar{B} x)=4.80 \times 10^{-1} \text{m}^2/\text{\,s}^{}$
, and this value will be retained in all subsequent calculations e.g. if 50% of the available control moment is used f = 0.5, the value
$f\eta = \bar{A}/(\bar{B} x)=4.80 \times 10^{-1} \text{m}^2/\text{\,s}^{}$
, and this value will be retained in all subsequent calculations e.g. if 50% of the available control moment is used f = 0.5, the value
![]() $\eta =9.60 \times 10^{-1} \,\text{m}^2/\text{\,s}$
is implied for the turbulent kinematic shear viscosity.
$\eta =9.60 \times 10^{-1} \,\text{m}^2/\text{\,s}$
is implied for the turbulent kinematic shear viscosity.
Calculations similar to the preceding are applied to all other eight combinations of “light”, “medium” and “heavy” leading and following aircraft with (i) intermediate results indicated in the Table 4 and (ii) final separations distances in the Table 2 in brackets. Table 2 compares (i) the ICAO empirical rules for minimum separation distances that have proven to be safe over several decades and (ii) the SSD calculated from (65b) with (57) and (60) that are the result of the present analytical theory. It is well known that wake vortex decay depends on atmospheric conditions, and thus the ICAO rules represent some kind of worst-case scenario. The theory involves the effective turbulent kinematic viscosity for eddy dissipation, which is chosen so that the SSD coincides with ICAO rule for heavy leading and following aircraft. This calibration ensures that the ICAO empirical rules and the analytical formula for the SSD refer to comparable atmospheric conditions corresponding to worst-case scenarios. The remaining eight cases in the Table 2 show that the calculated SSD is mostly smaller than the ICAO rule a modest amount of up to 10%. This may be interpreted as good agreement, showing that the ICAO rules are (i) a little conservative on the safe side, thus excluding safety risks in almost all situations, and (ii) not too conservative, thus causing no unjustified loss of runway/airport capacity through excessive separation distances. The possible exceptions to this general success are (i) the increased separation distance that the FAA had to impose for a special aircraft (the Boeing 757) and (ii) the uncertainly about the appropriate separation distance for the very large airliner (Airbus 380). The special and large aircraft are thus two interesting cases further comparing the theory on the SSD and the empirical vortex separation rules.
6.0 VERY LARGE AND SPECIAL AIRCRAFT
The Boeing 757 appears to be a ‘special’ aircraft in that airline operational experience seems to indicate it may require larger separation distances than those specified by the standard ICAO separation rules for its medium weight class. This suggests calculating the safe separation distances behind a Boeing 757 or special aircraft, for another xss
Boeing 757, and for light xsl
, medium xsm
, and heavy xsh
aircraft. These same methods applied to the data in Table 3 lead to the intermediate results in Table 4 and the safe separation distances in the first column of Table 5. These results confirm that the Boeing 757 can have stronger wake effects on medium and light following aircraft than a medium aircraft would. Thus, the special aircraft (Boeing 757) cannot be treated as a medium aircraft; applying to the special aircraft the separation rules for a heavy aircraft would be safe but a little too conservative or excessive (
![]() $5 \text{\,nm}$
instead of
$5 \text{\,nm}$
instead of
![]() $4.42 \text{\,nm}$
for the medium following aircraft and
$4.42 \text{\,nm}$
for the medium following aircraft and
![]() $6 \text{\,nm}$
instead of
$6 \text{\,nm}$
instead of
![]() $4.90\,\text{nm}$
for light following aircraft). The reason why the special aircraft has strong wake effects can be seen in the Table 3: (i) the special aircraft has a roll control ratio intermediate between that of the much larger heavy aircraft and that of a medium aircraft; (ii) the volume loading of the special aircraft is comparable to that of medium and light aircraft, and much higher than for the heavy aircraft; (iii) the special aircraft has an approach speed intermediate between those of the medium and heavy aircraft; and (iv) the downwash velocity of the special aircraft is larger than for the medium aircraft, and exceeds slightly that of the heavy aircraft, which indicates a strong wake. Although effects (i) through (iii) are not dramatic in isolation, they all add in the same direction, of giving the special aircraft a stronger wake than its weight category would suggest as confirmed by its downwash velocity higher than all the others.
$4.90\,\text{nm}$
for light following aircraft). The reason why the special aircraft has strong wake effects can be seen in the Table 3: (i) the special aircraft has a roll control ratio intermediate between that of the much larger heavy aircraft and that of a medium aircraft; (ii) the volume loading of the special aircraft is comparable to that of medium and light aircraft, and much higher than for the heavy aircraft; (iii) the special aircraft has an approach speed intermediate between those of the medium and heavy aircraft; and (iv) the downwash velocity of the special aircraft is larger than for the medium aircraft, and exceeds slightly that of the heavy aircraft, which indicates a strong wake. Although effects (i) through (iii) are not dramatic in isolation, they all add in the same direction, of giving the special aircraft a stronger wake than its weight category would suggest as confirmed by its downwash velocity higher than all the others.
Table 5 Calculated separation distances (65b) for leading special (s) or very (v) large aircraft, followed by identical (s or v), heavy (h), medium (m) and light (ℓ) aircraft (compared with FAA rules with v ≡ h and s ≡ m)

For the Very Large Airliner (VLA), the same method of calculation (Tables 3 and 4) leads to safe separation distances (second column of Table 4) comparable to the heavy aircraft. The suggestion that the A380 may not need much larger safe separation distance than the B747 may appear surprising but is substantiated by the data in the Table 3: (i) the roll control ratio (49) is greater 1/49 for the large aircraft than it is for the heavy 1/72.5 or special 1/144; (ii) the wing loading is slightly lower for the large aircraft than it is for the heavy and special aircrafts; (iii) the volume loading of the large aircraft is lower than it is for the heavy aircraft and much lower than it is for the special aircraft; (iv) the downwash velocity of the large aircraft is slightly lower than it is for the heavy and special aircrafts; (v) the approach speed of the large aircraft is slightly higher than it is for the special aircraft and somewhat lower than it is for the heavy aircraft. The large aircraft has a wake vortex strength larger than the heavy aircraft and much larger than the special aircraft, but the mitigating factors (i) through (iv) lead to a comparable safe separation distance.
The preceding comparisons of light, medium and heavy, special and large aircraft can be reconsidered from the point of view of the evolution of the vorticity (15b) with distance. Its derivative (66) vanishes:
at a distance (67a) ≡ (57):
where it takes the value (67b) and (18) is used in (67c). The dimensionless distance (56) is unity (68a) at the peak vorticity that corresponds to the value (68b) of the wake separation function (59) in Fig. 4:
It can be confirmed from the first two derivatives of the function (59):
that (i) the extremum of the vorticity (70a) is at (70b) and is a maximum (70c):
(ii) the roots of (69b) = (71a) specify (71b):
the inflexion points (72a,b):
that are indicated in Fig. 4.
Fig. 4 has as interpretation that is more explicit in Fig. 5. If the interaction parameter (60) exceeds the value (68b), then the roll control moment of the following aircraft exceeds the rolling moment due to the wake of the leading aircraft at any distance, and no safe separation distance is needed; the reason is that B ⩾ 0.3679 ensures that the following aircraft can cope with the peak vorticity of the leading aircraft. If B < 0.3679, then the following aircraft cannot compensate the wake vortex in the range of distances X
1 ⩽ X ⩽ X
2 around the peak vorticity, whose boundaries are the two equilibrium points (X
1, X
2) where the available roll control moment is just sufficient. The smaller separation distance X
1 is unsafe because the following aircraft can only come closer to the leading aircraft; if it falls behind X > X
1, it cannot cope with the increasing wake vortex strength. The larger separation distance X
2 is safe as long as the following aircraft does not come closer to the leading aircraft, facing a stronger wake. If it falls behind X > X
2, the wake of the leading aircraft is weaker, and the following aircraft has a larger roll control margin to compensate wake vortex effects. The Table 3 shows that the peak vorticity is actually larger for the light, medium and special aircraft than for the heavy and large aircraft, but this of no consequence because the peak vorticity is not too far behind. The peak vorticity of the heavy aircraft is farther behind and even more distant for the large aircraft. The conclusion remains valid if the distance of peak vorticity is normalized to the wing span. The trend for larger aircraft to have peak wake vorticity farther behind may explain the caution in imposing a much larger separation distance for the large aircraft compared with the heavy aircraft, since there is a little experience to substantiate empirical rules for a new aircraft class. The present theory suggests that the safe separation distance is affected not only by wake vortex evolution but also by the dynamics and performance of the leading and following aircraft, which may act as aggravating or mitigating factors. The VLA with the characteristics of the A380 listed in the Table 3 has SSD that meets ICAO rules for the heavy class. It could be considered that the ICAO rules, being empirical, have an error margin anyway. The calculation of the SSD is also not too precise, due to the uncertainty in two parameters used in (65b), namely the turbulent kinematic viscosity and percentage of available control authority used. If the choice was made to require strict compliance of the SSD with ICAO rules, then the available roll control ratio of the VLA as specified bS/baSa
= 54 in the Table 3 is adequate. With unchanged wing span b and area S, the increase in roll control ratio bS/baSa
, would come from a larger aileron area Sa
(assuming that the ailerons cannot be placed further outboard to increase the moment arm ba
). A larger aileron area could lead to aeroelastic problems, requiring either a heavier wing or a more sophisticated load alleviation control system. The separation distances calculated for the VLA assume an aileron area
![]() $S_a=72\,\text{m}^2$
over three times that of the heavy aircraft and an approach speed
$S_a=72\,\text{m}^2$
over three times that of the heavy aircraft and an approach speed
![]() $U=70\,\text{m/s}$
is somewhat lower. It must be borne in mind that both may be difficult to achieve, that a large aileron area requires to careful structural and aerolastic design, and that the low approach speed depends on high lift.
$U=70\,\text{m/s}$
is somewhat lower. It must be borne in mind that both may be difficult to achieve, that a large aileron area requires to careful structural and aerolastic design, and that the low approach speed depends on high lift.
7.0 IMPLICATIONS OF AIRCRAFT CHARACTERISTICS ON THE SSD
The main result of the present paper, viz. the formula (65b) for the SSD, where (57) and (60) are substituted:
highlights the main factors, as concerns (I) atmospheric conditions, (II) control aspects, (III) operating procedures and (IV) design considerations. Concerning (I) atmospheric conditions, the SSD increases as the kinematic viscosity is decreased, because then the vorticity decays more slowly between the leading and following aircraft. From the point of view of control (II), the SSD (IIi) decreases for larger roll control ratio and (IIii) increases for larger safety margin in the sense that it is using a smaller fraction of the maximum aileron deflection. Concerning operating procedures (III), the SSD (IIIi) increases for higher airspeed of the following aircraft, implying that it reaches the wake of the leading aircraft earlier; (IIIii) increases for heavier leading aircraft and lighter following aircraft, as this corresponds to a stronger wake impinging on an aircraft with less inertia; (IIIiii) decreases for larger wing area of leading aircraft relative to that of following aircraft, because the latter is then less sensitive to the wake of the former. The latter two effects (IIIii/iii) combine to indicate that the SSD increases for higher wing loading of the leading aircraft and lower wing loading of the following aircraft. Concerning (IV) design parameters, the SSD (IVi) increases for the larger span of the following aircraft because the latter catches a larger fraction of the wake of the former, (IVii) decreases for a smaller root chord of leading aircraft because it leads to a smaller vortex strength, and (IViii) depends also on the wing planform shape factor for the following aircraft. This question of separation distances is of particular interest for new very large aircraft, such s the Airbus A380, which are larger than the Boeing 747. This question arises with the VLA, and it has been shown that the separation between two such aircraft is nearly the same as between two Boeing 747 so that no new ICAO category ‘super heavy’ could be required by the characteristics listed in Table 3. It is also important to note that the separation distances for light, medium and heavy following aircraft also fall within ICAO guidelines. It should be noted that in order for the VLA to fit current ICAO separation standards as a ‘heavy’ aircraft, it requires a large aileron area, which may have aeroelastic, structural or control implications.
The response of an aircraft to an encounter with wake vortices can be modeled(Reference Campos and Marques9) by an analogue of the present method and in addition extended to include roll damping effects(Reference Campos and Marques36); it has also been shown that the vorticity decay law (19) is consistent with the Memphis database(Reference Campbell, Dasey, Freebart, Heinrichs, Matthews, Perras and Rowe23). The latter comparison leads to a turbulent kinematic viscosity
![]() $\eta _1 = 1.60 \times 10^{ - 1} \text{m}^2 /\text{s}$
, which is much larger η1/η0 = 1.07 × 10⁴ than the molecular value
$\eta _1 = 1.60 \times 10^{ - 1} \text{m}^2 /\text{s}$
, which is much larger η1/η0 = 1.07 × 10⁴ than the molecular value
![]() $\eta _0 = 1.5 \times 10^{ - 5} \,\text{m}^2 /\text{s}$
, and rather smaller η/η1 = 6.00 than the value
$\eta _0 = 1.5 \times 10^{ - 5} \,\text{m}^2 /\text{s}$
, and rather smaller η/η1 = 6.00 than the value
![]() $ \eta = 9.60 \times 10^{ - 1} \,\text{m}^2 /\text{s}$
used in previous computations. The value of η was chosen so that the safe separation distance between two B747-400s was equal to the ICAO value
$ \eta = 9.60 \times 10^{ - 1} \,\text{m}^2 /\text{s}$
used in previous computations. The value of η was chosen so that the safe separation distance between two B747-400s was equal to the ICAO value
![]() $x_{hh}=4\,\text{nm}=\bar{x}_{hh}$
, and this value was retained in all subsequent calculations (e.g. in Table 4). Thus, the the ICAO table of safe separation distances supposes, according to the present theory, that the kinematic viscosity η is larger than the value η1. This implies that the vortex should have moved out of the flight path of the following aircraft by a distance y such that vorticity has reduced by a factor η1/η. Assuming that the lateral decay of the vorticity is Gaussian exp[ − (y/a)2] = η1/η, with the vortex core radius a as length scale, it follows that the vortex should have traveled laterally
$x_{hh}=4\,\text{nm}=\bar{x}_{hh}$
, and this value was retained in all subsequent calculations (e.g. in Table 4). Thus, the the ICAO table of safe separation distances supposes, according to the present theory, that the kinematic viscosity η is larger than the value η1. This implies that the vortex should have moved out of the flight path of the following aircraft by a distance y such that vorticity has reduced by a factor η1/η. Assuming that the lateral decay of the vorticity is Gaussian exp[ − (y/a)2] = η1/η, with the vortex core radius a as length scale, it follows that the vortex should have traveled laterally
![]() $y/a = \sqrt{\log \left( {\eta /\eta _1 } \right)} = 1.34$
; for a vortex core radius
$y/a = \sqrt{\log \left( {\eta /\eta _1 } \right)} = 1.34$
; for a vortex core radius
![]() $a=3.22\,\text{m}$
for the B747-400, this means that the vortex wake of the leading aircraft should have moved laterally
$a=3.22\,\text{m}$
for the B747-400, this means that the vortex wake of the leading aircraft should have moved laterally
![]() $y=4.31\,\text{m}$
by the time it encounters the following aircraft. From the separation is
$y=4.31\,\text{m}$
by the time it encounters the following aircraft. From the separation is
![]() $x_{hh}=4\,\text{nm}= 7.41 \times 10^3\,\text{m}$
, and the approach speed
$x_{hh}=4\,\text{nm}= 7.41 \times 10^3\,\text{m}$
, and the approach speed
![]() $V_2= 1.1{\text{ }}V_s=66.7\text{m/s}$
, the time elapsed is
$V_2= 1.1{\text{ }}V_s=66.7\text{m/s}$
, the time elapsed is
![]() $t=x_{hh}/V_2 = 111{\,\text{s}}$
, during which the vortex has traveled a lateral distance
$t=x_{hh}/V_2 = 111{\,\text{s}}$
, during which the vortex has traveled a lateral distance
![]() $y=4.31\,\text{m}$
, at a convection speed
$y=4.31\,\text{m}$
, at a convection speed
![]() $\bar{u}_y = l/t = 3.9 \times 10^{ - 2}\,\text{m/s}$
. Thus, the ICAO table of safe separation distances, according to the present theory, supposes the convection of the wake vortices at a velocity
$\bar{u}_y = l/t = 3.9 \times 10^{ - 2}\,\text{m/s}$
. Thus, the ICAO table of safe separation distances, according to the present theory, supposes the convection of the wake vortices at a velocity
![]() $\bar{u}_y = 3.9 \times 10^{ - 2}\,\text{m/s}$
due to a cross-wind. A stronger average crosswind away from the ground
$\bar{u}_y = 3.9 \times 10^{ - 2}\,\text{m/s}$
due to a cross-wind. A stronger average crosswind away from the ground
![]() $u_y > \bar{u}_y$
leads to faster convection of the vortex away from the flight of the following aircraft, hence to a larger “equivalent” η and a shorter SSD, which is a safer situation. Conversely, a weaker average crosswind
$u_y > \bar{u}_y$
leads to faster convection of the vortex away from the flight of the following aircraft, hence to a larger “equivalent” η and a shorter SSD, which is a safer situation. Conversely, a weaker average crosswind
![]() $u_y<\bar{u}_y$
would lead to a larger SSD or a stronger vorticity when the following aircraft encounters the vortex, which could be an unsafe situation. In particular, in the absence of crosswind uy
= 0, the following aircraft might not be able to compensate for the full vortex strength at encounter, which would be η/η1 = 6.00 times larger than the reference value. In the preceding discussion, it was assumed that the vortex was convected on a straight path along the wind direction, which is the case out of ground effect. Close to the ground, the wake vortex of the leading aircraft may rebound, and if it does go into the flight path of the following aircraft, another potentially unsafe situation could occur. Since the ICAO table of safe separation distances, according to the present theory, assumes a rather small average crosswind component, it would be safe in the vast majority of situations. The preceding discussion suggests that atmospheric conditions play a major role in the determination of the SSD, justifying a more detailed consideration.
$u_y<\bar{u}_y$
would lead to a larger SSD or a stronger vorticity when the following aircraft encounters the vortex, which could be an unsafe situation. In particular, in the absence of crosswind uy
= 0, the following aircraft might not be able to compensate for the full vortex strength at encounter, which would be η/η1 = 6.00 times larger than the reference value. In the preceding discussion, it was assumed that the vortex was convected on a straight path along the wind direction, which is the case out of ground effect. Close to the ground, the wake vortex of the leading aircraft may rebound, and if it does go into the flight path of the following aircraft, another potentially unsafe situation could occur. Since the ICAO table of safe separation distances, according to the present theory, assumes a rather small average crosswind component, it would be safe in the vast majority of situations. The preceding discussion suggests that atmospheric conditions play a major role in the determination of the SSD, justifying a more detailed consideration.
8.0 ATMOSPHERIC AND GROUND EFFECTS ON WAKE VORTEX EVOLUTION
The calculation of the SSD depends on four sets of data: (i) aircraft characteristics like wing span, chord, etc., those are precisely known and available from databases; (ii) flight data such as airspeed, weight and aileron deflection that can be measured reliably with acceptable accuracy; (iii) the fraction f of the maximum aileron deflection used is a choice of the pilot that determines the roll control moment; and (iv) the atmospheric and ground effects on wake vortex evolution are combined in a single parameter, namely the kinematic viscosity η, which is the greatest source of uncertainty in the model. Since the two main sources (iii) and (iv) of uncertainty appear in the SSD only as a product fη, the value of the latter has been calibrated by matching with the ICAO separation distance for heavy leading and following aircraft. This choice is validated by obtaining comparable results for (a) the ICAO empirical separation distance and (b) the analytical formulas for the SSD in this paper for all of the eight other combinations of “light”, “medium” and “heavy” aircraft. Further validation is provided by using the value of the kinematic viscosity inferred from the Memphis database(Reference Campbell, Dasey, Freebart, Heinrichs, Matthews, Perras and Rowe23), which implies a fraction f = 0.5 of the maximum aileron deflection and may be considered a plausible result.
The value taken from the kinematic viscosity is much larger than the molecular viscosity, showing that is represents vortex decay due to much stronger physical processes occurring in the atmosphere and in ground effect. The wake vortices of the leading aircraft may break down due to instabilities of the swirling flow, such as the Crow instability(Reference Crow18); two or more vortices may interact(Reference Campos25,Reference Lighthill26) , modifying their paths and changing their vorticities in a turbulent cascade that ultimately leads to the decay of vorticity. The decay process may be so slow that vortices persist long enough to became a hazard to following aircraft depending on their relative location. The location and strength of the wake vorticity is strongly affected by convection by atmospheric winds that may carry the vortices away from or towards the following aircraft depending on the wind direction and aircraft flight path. In addition, at the early stages of take-off and late stages of landing, the counter-rotating wing-tip vortices are in ground effect, and their images induce a trajectory(Reference Milne-Thomson27,Reference Campos28) , sinking to the ground. The combination of the wind and ground effect can cause vortices to rebound into the flight path of the following aircraft, posing a safety hazard. In conclusion, the path of wake vortices is affected by atmospheric conditions and ground topography, requiring numerical computations that are sensitive to atmospheric data used as inputs; variations in wind speed and direction with altitude can significantly modify the evolution of the wake vortices and are the main sources of error or uncertainty in predicting wake vortex effects.
The main simplification of the theory of SSD in this paper is that it combines all atmospheric and ground effects on wake vortex evolution into a single parameter, namely the kinematic viscosity, that may be interpreted as “hiding” or “accounting for” all the complex underlying physical processes. The kinematic viscosity can be used to show how sensitive the SSD is to atmospheric conditions, using for the sake of generality dimensionless variables. The dimensionless kinematic viscosity can be defined (74a) using the airspeed and vortex core radius of the leading aircraft in (56) and (57) that leads to (74b):
Thus, normalizing the safe separation distance to the vortex core radius (75a):
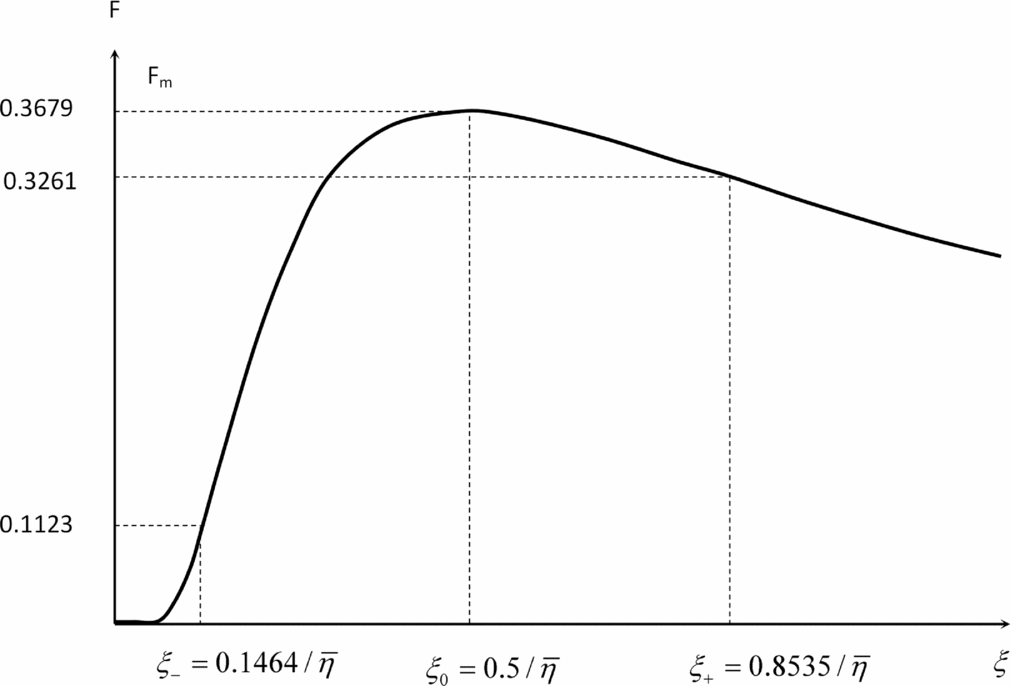
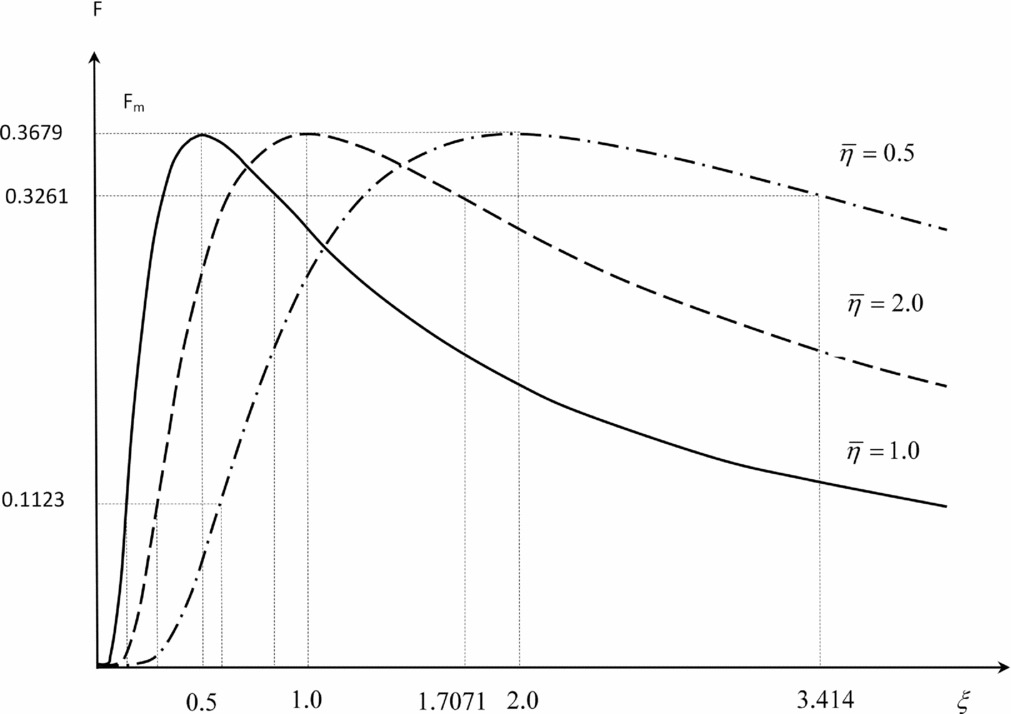
the dimensionless parameter (74b) involves only the dimensionless kinematic viscosity (75b). The dimensionless wake vortex response (58) and (59) in Figs 4 and 5 can be re-interpreted in Figs 9 and 10 using (i) the same dimensionless indicator of safety F and (ii) the dimensionless distance (75b) replaced by SSD normalized to vortex core radius (75a), thus making explicit the role of the dimensionless kinematic viscosity (74a).
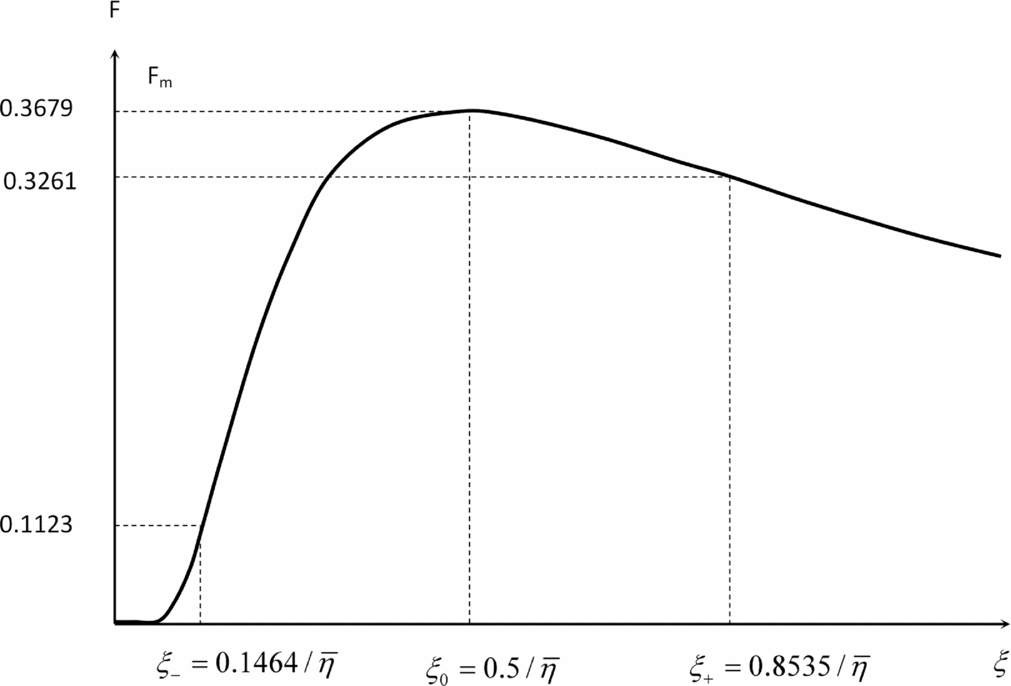
Figure 9. Same graph as in the Fig. 4 re-scaling along the distance axis using the dimensionless distance replaced by SSD normalized to vortex core radius.
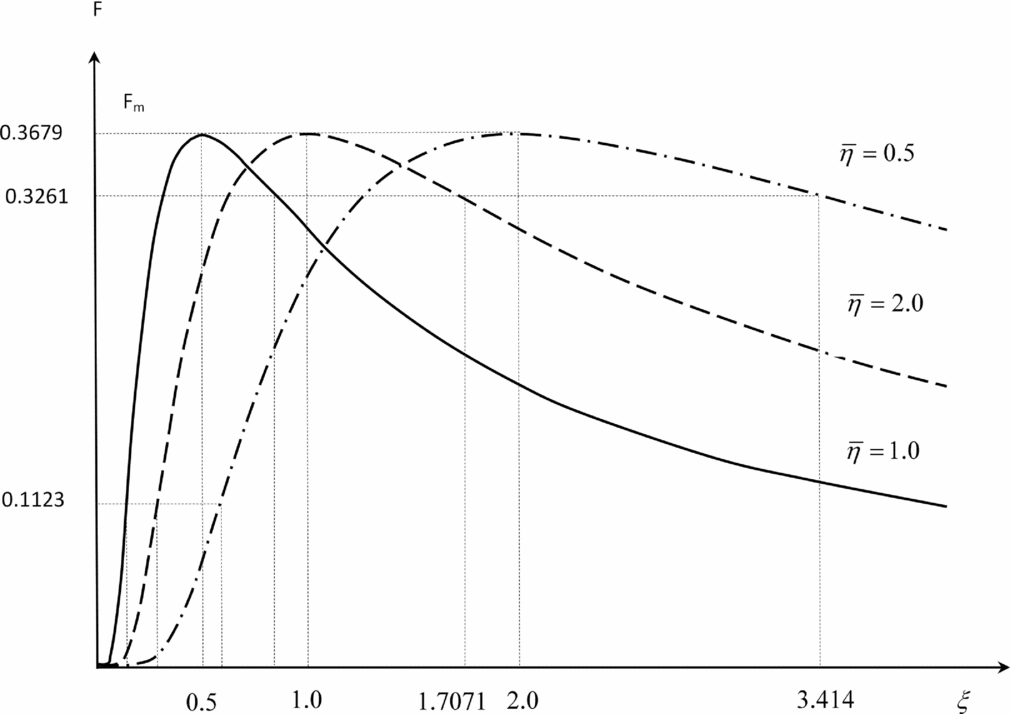
Figure 10. Same graph as in the Fig. 9 for three values of the dimensionless kinematic viscosity.
Fig. 9, which is a re-scaling along the distance axis of Fig. 4, shows that the location of peak vorticity is farther from the leading aircraft for smaller dimensionless kinematic viscosity, which is slower wake vortex decay; conversely, a larger dimensionless kinematic viscosity overcomes more quickly the initial wing-tip vortex roll-up and leads to a peak vorticity closer to the leading aircraft. As the dimensionless kinematic viscosity reduces (Fig. 10) the unsafe region between ξ± where the wake-induced rolling moment exceeds the available roll control moment moves to larger distances behind the leading aircraft, requiring a larger safe separation distance for the following aircraft. Thus the dimensionless kinematic viscosity plays the role of single overarching physical parameter that embodies the influence on the SSD of all the effects of wake vortex evolution of atmospheric conditions and ground topography; the implications for ATM procedures and runway capacity at airports are considered in the conclusion.
9.0 CONCLUSION
The ICAO empirical separation rules have stood the test of time, providing safe separation of aircraft at take-off and landing based only on three weight categories. However, the modification needed for the special aircraft (B757) show the limits of empirical rules, and significantly increased separation imposed on the VLA (A380) reflect the uncertainties in their extension to the new classes of aircraft. The growth in air traffic at a rate of 3% to 5% per year, depending on the region of the world, leading to a doubling every 14 to 23 years, puts further pressure on reducing separation distances that limit the capacity of existing runways and airports. The empirical rules necessarily reflect worst-case scenarios and do not indicate when more favourable conditions would safely allow for reduced separations. Three trends can be seen in major programs like (37) SESAR (Single European Sky ATM Research) in Europe and (38) NextGen (Next Generation Air Transportation System) in the U.S.: (i) increasing the number of aircraft categories, (ii) moving from distance to time-based separation and (iii) ultimately using pair-wise separation rules.
The theory in this paper is relevant in all three contexts: (i) just as it has been applied to the 3 × 3 ICAO matrix of separation distances and extended to 4 × 4 and 5 × 5 matrices including special and large aircraft, respectively, it can be extended to a larger N × N matrix with N classes of aircraft; (ii) the results of the theory can be expressed in terms of spatial or temporal separation; and (iii) the theory meets the ultimate requirement of pair-wise separation by including the characteristics of the leading and following aircraft and showing explicitly how they affect safe separation. The theory makes a clear distinction between (i) aircraft characteristics, flight regime and pilot inputs one hand and (ii) atmospheric and ground effects on wake vortex evolution. On the other hand, the theory shows where reliable data is respectively (i) straightforward and accurate and (ii) more difficult to obtain and potentially less accurate. The last remark justifies the current and continuing efforts to address the atmospheric and ground effects on wake vortex strengths and paths represented in this paper through a kinematic viscosity. The latter links the SSD to wake vortex evolution and relates flight dynamics to the flow physics, warranting further research into this relation.
ACKNOWLEDGEMENTS
This work was supported by Foundation for Science and Technology (FCT) through Institute of Mechanical Engineering (IDMEC), under LAETA Pest-OE/EME/LA0022. This work was started under the S-Wake project of the European Union and benefited at the outset from comments of colleagues, including Dr. A.C. de Bruin, Prof. K. Wilhelm, Dr. A. Rheinke and B. Escande.
APPENDIX
A.0 FIRST ORDER HEADING CALCULATION OF WING PLANFORM FACTOR FOR TRAPEZOIDAL WING
The purpose of this Appendix is to calculate the wing planform factor (39) for a trapezoidal wing, with straight leading and trailing edges, for which the chord is a linear function of spanwise coordinate:
where the root cr and tip ct chords may be chosen at will e.g. for a delta wing ct = 0. Introducing a dimensionless spanwise coordinate:
it follows that the mean geometric chord is specified by:
leading to:
thus, the trapezoidal wing may be specified alternatively by the root cr
and tip ct
chords or by the mean geometric chord
![]() $\bar{c}$
and taper ratio λ.
$\bar{c}$
and taper ratio λ.
Solving (A4) specifies the root and tip chords:
in terms of the mean geometric chord and taper ratio, and substitution in (A2) leads to the expression:
for the chord as a function of dimensionless spanwise coordinate. The simplest case is the rectangular wing
![]() $c(\xi )=\bar{c}$
, which has taper ratio unity λ = 1.
$c(\xi )=\bar{c}$
, which has taper ratio unity λ = 1.
For a symmetrical wing, the planform factor (39) simplifies to:
which, using the variable in (A2), leads to:
the integral (A8) is readily evaluated:
and depends only on taper ratio:
The dimensionless relation (A10) shows that the wing planform factor h depends only on the taper ratio λ, and varies between unity h = 1 for a rectangular wing λ = 1, and one-half h = 1/2 for a delta wing λ = 0, with intermediate values in between e.g. h = 5/6 for λ = 1/2 and h = 3/4 for λ = 1/3.


