


Introduction
Knowledge about distribution and movements of threatened species is crucial for effective conservation and management (NRC, 2010; NMFS, 2013; Rees et al., Reference Rees, Alfaro-Shigueto, Barata, Bjorndal, Bolten, Bourjea, Broderick, Campbell, Cardona, Carreras, Casale, Ceriani, Dutton, Eguchi, Formia, Fuentes, Fuller, Girondot, Godfrey, Hamman, Hart, Hays, Hochscheid, Kaska, Jensen, Mangel, Mortimer, Naro-Maciel, Ng, Nichols, Phillott, Reina, Revuelta, Schofield, Seminoff, Shanker, Tomás, Van de Merwe, VanHoutan, Vander Zanden, Wallace, Wedemeyer-Strombel, Work and Godley2016). This information is useful for gauging population-level impacts of anthropogenic threats such as directed harvest and fisheries by-catch mortality (Koch et al., Reference Koch, Nichols, Peckham and de la Toba2006). Studying movements and habitat use of sea turtles is often difficult due to logistic and technological constraints of monitoring individual animals, which live in marine habitats where they spend vast periods of time submerged and thus difficult to monitor through time and space. They have complex life histories characterized by slow growth, late maturity, long life and multiple stages of development that can span entire ocean basins over several decades (Wallace et al., Reference Wallace, Avens, Braun-McNeill and McClellan2009; Bailey et al., Reference Bailey, Benson, Shillinger, Bograd, Dutton, Eckert, Morreale, Paladino, Eguchi, Foley, Block, Piedra, Hitipeuw, Tapilatu and Spotila2012). In recent years, satellite telemetry has provided important information regarding sea turtle movement patterns and habitat use (e.g. Luschi et al., Reference Luschi, Hays, Del Seppia, Marsh and Papi1998; Coyne & Godley, Reference Coyne and Godley B2005; Godley et al., Reference Godley, Blumenthal, Broderick, Coyne, Godfrey, Hawkes and Witt2008). These data can be used to inform conservation managers and governing bodies on priority areas for conservation (Blumenthal et al., Reference Blumenthal, Solomon, Bell, Austin, Ebanks-Petrie, Coyne, Broderick and Godley2006; Hawkes et al., Reference Hawkes, Tomás, Revuelta, León, Blumenthal, Broderick, Fish, Raga, Witt and Godley2012) and can provide insights about redesigning Marine Protected Areas (MPAs) and/or the effectiveness of pre-existing conservation initiatives (Dawson et al., Reference Dawson, Formia, Agamboué, Asseko, Boussamba, Cardiec, Chartrain, Doherty, Fay, Godley, Lambert, Koumba Mabert, Manfoumbi, Metcalfe, Minton, Ndanga, Nzegoue, Kouerey Oliwina, Du Plessis, Sounguet, Tilley, Witt and Maxwell2017).
Loggerhead turtles (Caretta caretta) inhabit temperate, subtropical and tropical waters worldwide. In the North Pacific, most loggerheads have an extensive migration, travelling from nesting areas in Japan to distant developmental and foraging habitats in the Central North Pacific (Polovina et al., Reference Polovina, Uchida, Balazs, Howell, Parker and Dutton2006; Abecassis et al., Reference Abecassis, Senina, Lehodey, Gaspar, Parker, Balazs and Polovina2013) and eastern North Pacific (Seminoff et al., Reference Seminoff, Eguchi, Carretta, Allen, Prosperi, Rangel, Gilpatrick, Forney and Peckham2014; Zavala-Norzagaray et al., Reference Zavala-Norzagaray, Ley-Quiñónez, Hart, Aguilar-Claussell, Peckham and Aguirre2017; Eguchi et al., Reference Eguchi, McClatchie, Wilson, Benson, LeRoux and Seminoff2018). After spending years foraging, these turtles return to their Japanese natal nesting beaches to reproduce (Resendiz et al., Reference Resendiz, Resendiz, Nichols, Seminoff and Kamezaki1998; Nichols et al., Reference Nichols, Resendiz, Seminoff and Resendiz2000) and the remainder of their life cycle is spent in the western Pacific (Sakamoto & Bando, Reference Sakamoto and Bando1997; Hatase et al., Reference Hatase, Kinoshita, Bando, Sato, Matsuzawa and Goto2002; Kamezaki et al., Reference Kamezaki, Matsuzawa, Abe, Asakawa, Fujii, Goto, Hagino, Hayami, Ishii, Iwamaoto, Kamata, Kato, Kodama, Kondo, Miyawaki, Mizobuchi, Nakamura, Nakashima, Naruse, Omuta, Samejima, Suganuma, Takeshita, Tanaka, Toji, Uematsu, Yamamoto, Yamato, Wakabayashi, Bolten and Witherington2003). Loggerhead turtle movements have been well-studied in the Central North Pacific (Kobayashi et al., Reference Kobayashi, Polovina, Parker, Kamezaki, Cheng, Uchida and Balazs2008; Abecassis et al., Reference Abecassis, Senina, Lehodey, Gaspar, Parker, Balazs and Polovina2013; Briscoe et al., Reference Briscoe, Parker, Balazs, Kurita, Saito, Okamoto, Polovina and Crowder2016) and along the west coast of the Baja California Peninsula, Mexico (Peckham et al., Reference Peckham, Diaz, Walli, Ruiz, Crowder and Nichols2007). However, loggerheads are also present in the Sea of Cortez or Gulf of California (GC) (Seminoff et al., Reference Seminoff, Resendiz, Resendiz and Nichols2004; Zavala-Norzagaray et al., Reference Zavala-Norzagaray, Ley-Quiñónez, Hart, Aguilar-Claussell, Peckham and Aguirre2017) although few data are available on their movements and habitat use.
The objective of this study was to develop a greater understanding of loggerhead turtle movements and habitat use in the context of oceanographic conditions. Movement data from tracked loggerhead turtles using Argos-linked satellite transmitters were integrated with sea surface temperature (SST) and chlorophyll-a (Chl-a) concentration, used as proxy for marine productivity. These are the first satellite tracks for loggerhead turtles in the GC, to our knowledge, and may support the identification of key areas for the conservation of this endangered species.
Methods
Study area
The Gulf of California is a narrow and partially enclosed sea, characterized by strong tidal mixing and upwelling, which support productive marine benthic communities dominated by marine algae (Lavín et al., Reference Lavín, Castro, Beier, Cabrera, Godınez and Buenrostro2014). The length of the GC is about 1400 km and it is up to 3000 m deep (Roden, Reference Roden1958). Local physical oceanographic processes (e.g. wind, large tidal flux) maintain high nutrient concentration in the euphotic zone. The highest phytoplankton biomass values are presented in the northern and central Gulf (Gaxiola-Castro et al., Reference Gaxiola-Castro, Garcia and Botello-Ruvalcaba1995).
Turtle captures and measurement
During 2004, one loggerhead turtle (Turtle A) was found entangled alive in an artisanal set-net by a local fisher in Baja California. In 2014 and 2015, four loggerheads were by-caught alive by local shark fishers in drift gillnets (25 cm mesh size, stretched) in northern Sinaloa. Due to long-term community environmental outreach and education conducted by the Wildlife Department at the Instituto Politécnico Nacional (IPN), Guasave, Sinaloa, fishers immediately reported the incidental captures of the latter four turtles. All turtles were in apparent good health, although one turtle (E) had a tomium injury and had substantial numbers of marine leeches and barnacles. Turtles were measured with Forester's callipers for straight carapace length (SCL), weighed with a spring balance, and tagged on the posterior flippers with inconel tags (Style 681, National Band and Tag Co., Newport, NY).
Satellite telemetry
Each loggerhead turtle was equipped with an ARGOS-linked platform terminal transponder (PTT) (one Sirtrack Kiwisat PTT (Turtle A; Havelock North, Hawkes Bay, New Zealand) and four Wildlife Computers Spot 5 PTTs (Turtles B–E; Redmond, WA, USA)). The transmitters were attached to the carapaces following the recommendations of Hays et al. (Reference Hays, Mortimer, Ierodiaconou and Esteban2014). Briefly, the carapace was lightly sanded and cleaned with alcohol, and transmitters were attached using two-part quick-drying epoxy adhesives (Devcon® and Quicksteel®). The epoxy material adhering the transmitter was shaped into a hydrodynamic form to reduce the drag, as previously described (Jones et al., Reference Jones, Bostrom, Carey, Imlach, Mickelson, Eckert, Opay, Swimmer, Seminoff and Jones2014). The data collection duty cycle for all the tags was 24h On/0h Off from Days 1–3 and 24 h On/24 h Off thereafter. Turtle positions were determined with the Argos satellite system, which categorized each location message received into one of six location classes (LC): 3, 2, 1, 0, A and B. Argos assigns accuracy estimations of <150 m for LC3, 150–350 m for LC2, 351–1000 m for LC 1 and >1000 m for LC 0. No accuracy estimation is provided for LC A or LC B. However, rather than limiting our track construction to the use of LCs with optimal accuracy estimates (i.e. LC 3, 2 and 1), we instead used a series of filters that excluded biologically unreasonable results based on travel speed (> 5 km h–1) or indicated turning angles that did not conform to a directional track line (<10°), as this approach has been shown to maximize the utility of Argos-derived positions for wildlife tracking (Coyne & Godley, Reference Coyne and Godley B2005). Based on the LC classification, we determined the coverage (percentage of travel days with successful transmissions) and accuracy (percentage of days with at least one LC 1, 2 or 3 transmission) of each transmitter following Etnoyer et al. (Reference Etnoyer, Cannyb, Matec, Morgand, Ortega-Ortiz and Nichols2006).
Identification of foraging areas
Foraging areas were inferred for sites where turtles showed restricted movements (slower travel rates and multidirectional movements in the same area), which were distinct from rapid transit movements that are typically characterized by higher travel rates and unidirectional movement trajectories. We calculated a ‘movement type’ threshold value according to Narazaki et al. (Reference Narazaki, Sato, Abernathy, Marshall and Miyazaki2013) using mean values of foraging and transit speeds (mean speed − standard deviation (SD) × 2). We inferred travel rates below the threshold (9.18 km day–1) to indicate foraging movements, whereas speeds above the threshold were considered transit or migratory movements. Foraging ranges were determined through an effort-weighted kernel density analysis (KDA) of 2311 filtered positions (cumulative from all tracked turtles) to derive an index of turtle residence probability per unit area. We weighted the kernel density estimate of turtle days in each cell by multiplying it by the number of individual turtles using that cell, providing probability contours for the 50%, 75% and 100% utilization distributions (UDs) with the 100% contour reflecting the total range (Peckham et al., Reference Peckham, Diaz, Walli, Ruiz, Crowder and Nichols2007). Furthermore, a migration straightness index (MSI) was calculated for each turtle's movements, based on the ratio of straight line distance between first and last Argos locations to the total track length to distinguish between migration or search strategies (Luschi et al., Reference Luschi, Hays, Del Seppia, Marsh and Papi1998).
Oceanographic data
Five-day composite images (1-km resolution) of Chl-a concentration and sea surface temperature (SST) were obtained from the MODIS Aqua (MODISAQUA 2014, 2015 Satellite Data California Current) and AVHRR sensors to avoid low quality satellite images from cloudy days. A total of 72 images were obtained for the foraging areas identified based on telemetry data and movement threshold analyses. These foraging areas (and spatial locations) included the Upper Gulf (30.183122 to 31.16581°N −113.334961 to −114.543457°W), Bahía de Los Angeles (28.979312 to 29.118574°N −113.312988 to −113.477783°W), Tiburón Island (28.594169 to 28.72913 N −112.104492 to −112.456055°W), Guaymas Basin (27.332735 to 27.858504°N −110.720215 to −111.159668°W); the Northern Limit of the Lower Gulf (NLLG) (24.44715 to 25.363882°N −108.742676 to −110.478516°W), per year of study, from which we calculated SST and Chl-a mean values using Mat LAB 7.8 program (Matrix Laboratory). Overall 216 Chl-a and SST mean values were obtained of each area for all three years of study (2004, 2014 and 2015).
Results
Turtle size and condition
The loggerheads included in this study were large juveniles ranging from 62.7–68.3 cm SCL and from 35–55 kg in body weight. All had a good Body Condition Index (BCI) ranging from 1.42–1.73 (mean: 1.58 ± 0.12) (Table 1) and were apparently healthy upon release.
Table 1. Morphometric data and tracking summary for five loggerhead turtles studied in the Gulf of California, Mexico

BLA, Bahía de los Ángeles; UG, Upper Gulf; LTO, Loreto; SC, Sinaloa Canyon; TI, Tiburón Island; GB, Guaymas Basin; SINMLS, San Ignacio-Navachiste-Macapule Lagoon System; MSI, Migration Straightness Index; FTR, Foraging Travel Rate; TTR, Transit Travel Rate; SCL, straight carapace length.
Coverage represents the percentage of travel days with successful transmissions; Accuracy represents the percentage of days with transmission accuracy better than 1 km.
Satellite tracking
Tracking durations ranged from 73–293 days (mean: 149 ± 62.5 days) and total travel distance ranged from 1237–5222 km (mean: 3118 ± 1490.7 km) (Table 1, Figure 1). The total transmissions per turtle ranged from 45–1006 (mean: 468.4 ± 370.56) (Table 1). Travel rates (km day−1) ranged from 12.31–19.18 (mean: 15.98 ± 3.12) (Table 1). The travel rates (km day−1) were lower when foraging movement occurred, ranging from 1.39–7.59 km day−1 (mean: 4.56 ± 3.10) (Table 1). Tracking efforts and movement threshold analyses suggest that the rehabilitated turtle (E) did not demonstrate foraging movements, perhaps due to a 10-week gap in Argos transmissions.
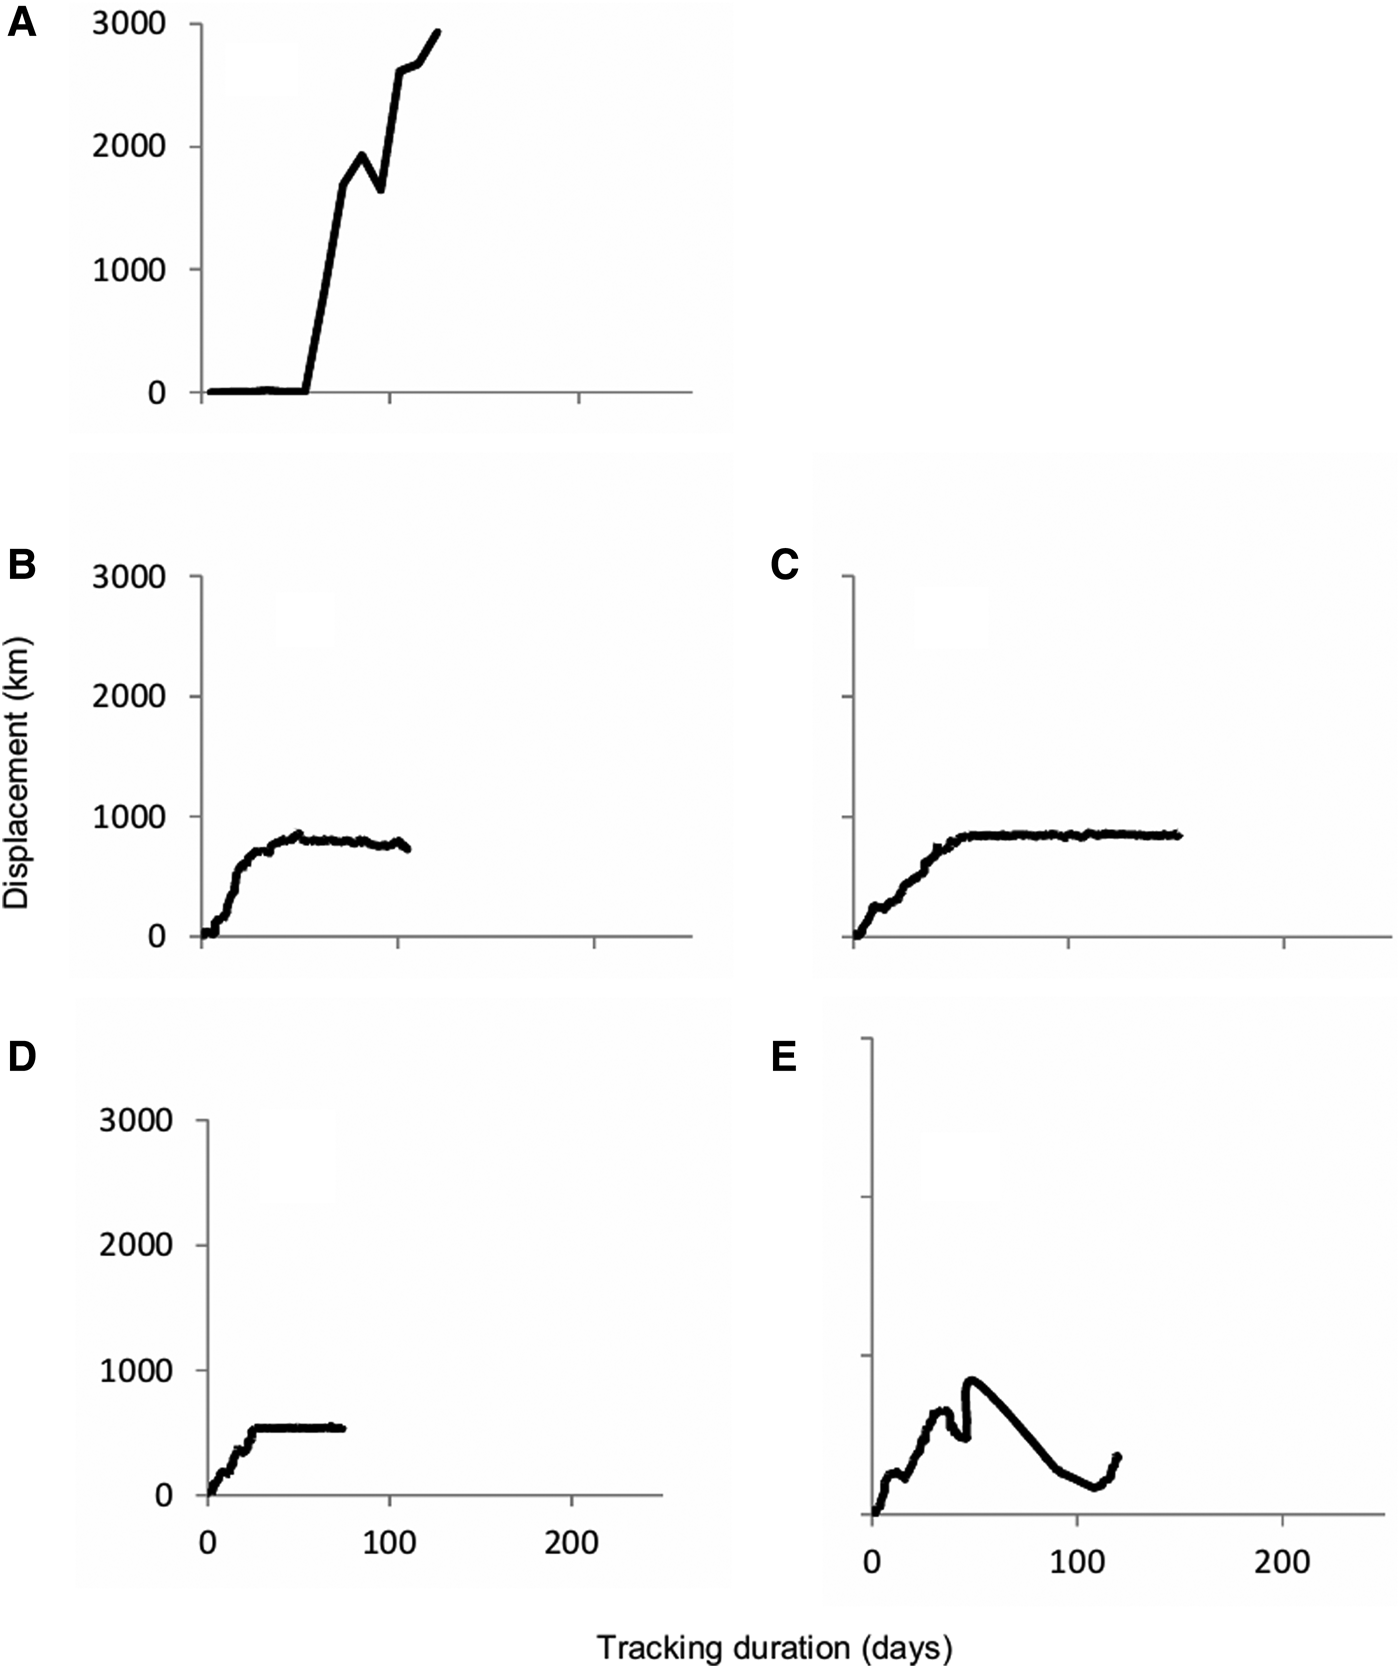
Fig. 1. Displacement (defined as straight-line distance from original point of release) plots for five loggerhead turtles (A–E) tracked in the Gulf of California.
MSI ranged from 0.11–0.75, and two of the tracked turtles (Turtle A and D) exhibited highly linear movements (Table 1, Figure 2). We identified five foraging areas: the Upper Gulf (UG), Bahía Los Angeles (BLA), Guaymas Basin (GB), Tiburon Island (TI) and the Northern Limit of the Lower Gulf (NLLG). The NLLG foraging area is composed by three different sub-regions, which are all highly productive areas, including the San Ignacio-Navachiste-Macapule Lagoon System (SINMLS), off-coast Loreto (LTO) and the Sinaloa Canyon (SC) (Figure 3).
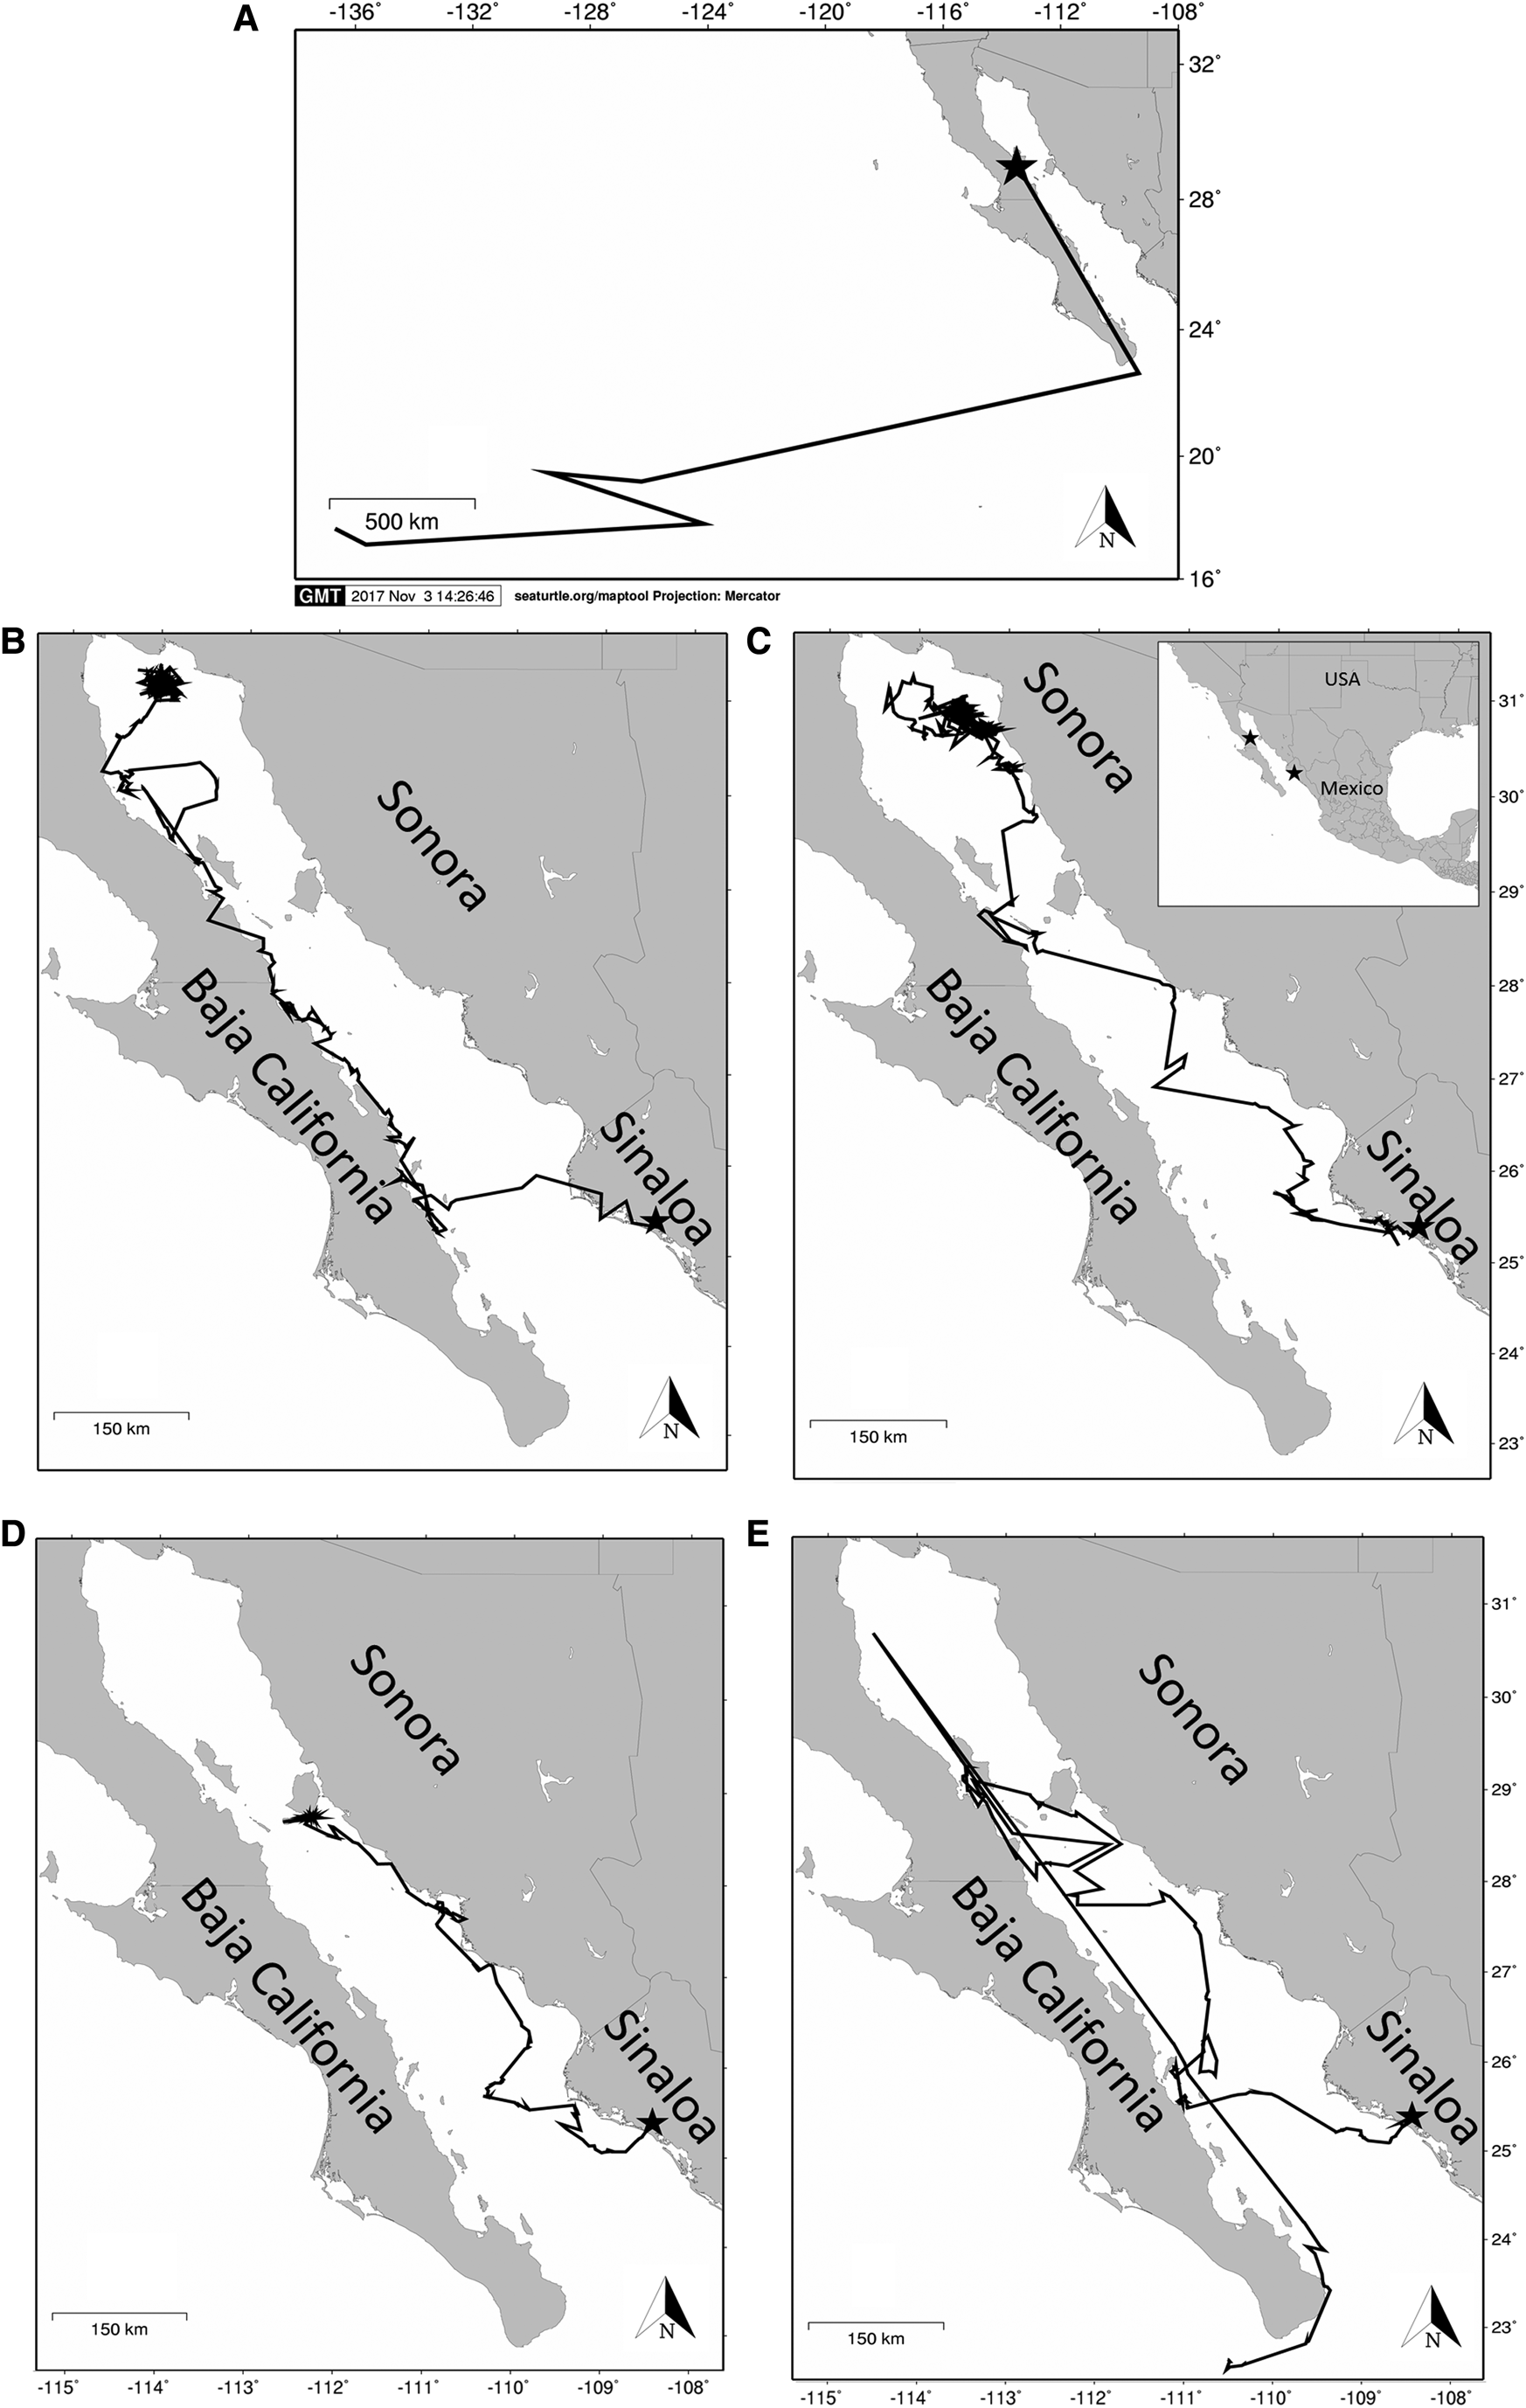
Fig. 2. Loggerhead tracks of five loggerhead turtles (A–E) in the Gulf of California. Stars indicate release locations.

Fig. 3. Kernel density analysis of loggerhead turtle habitat use in the Gulf of California. The 50%, 75% and 100% UDs (utilization distributions) are colour coded, with the 100% UD reflecting the total range and the 50% UD indicating high use areas. The high use areas in this study included Bahía de Los Ángeles (BLA), Upper Gulf (UG), Tiburón Island (TI), Guaymas Basin (GB) and the northern limit of the lower Gulf (NLLG).
Oceanographic data
Chlorophyll-a concentrations during the study period (2004, 2014 and 2015), were significantly different between identified foraging areas (P > 0.05) (Minitab® 17.1.0; Minitab Inc., State College, Pennsylvania, USA) (Table S1, Supplementary material). The highest mean values occurred in the lower Gulf (NLLG), with chlorophyll concentrations ranging from 0.28–13.14 mg m−3 (mean: 3.85 mg m−3); followed by BLA with Chl-a values ranging from 1.71–8.21 mg m−3 (mean: 2.45 mg m−3). Lowest values were registered in the GB with values ranging from 0.12–7.09 mg m−3 (mean: 0.66 mg m−3). SST in the identified foraging areas during the times that turtles were present ranged from 27.8–34.4°C. During migration/transit movements, turtles were tracked in waters >200 m deep, whereas during foraging movements, turtles mainly inhabited waters ranging from 10–80 m deep.
Discussion
A better understanding of the population structure, movements and habitat use of North Pacific Loggerheads is necessary throughout their range to minimize threats such as incidental capture in marine fisheries (NMFS and USFWS, 2009). To the best of our knowledge, this is the first satellite telemetry study characterizing loggerhead turtle movements in the GC. Our results provide novel insights about the location of foraging hotspots for the species in this temperate sea. These data build upon previous loggerhead tracking studies in the Gulf of Ulloa at the Pacific coast of the Baja California Peninsula, the closest known loggerhead foraging hotspot outside of the Gulf.
The mean size of the loggerheads tracked during this study is consistent with the 18 loggerheads reported by Zavala et al. (Reference Zavala-Norzagaray, Ley-Quiñónez, Hart, Aguilar-Claussell, Peckham and Aguirre2017) in the same capture site of the turtles presented here. It is among the largest for loggerheads at foraging sites in the Mexican Pacific (Ramírez-Cruz et al., Reference Ramírez-Cruz, Peña-Ramírez and Villanueva-Flores1991; Resendiz et al., Reference Resendiz, Resendiz, Nichols, Seminoff and Kamezaki1998; Nichols Reference Nichols2002; Seminoff et al., Reference Seminoff, Resendiz, Resendiz and Nichols2004; Peckham et al., Reference Peckham, Maldonado-Diaz, Tremblay, Ochoa, Polovina, Balazs, Dutton and Nichols2011). Due to this, and the minimum drag associated with the tags we used in this study (calculated by Jones et al., Reference Jones, Bostrom, Carey, Imlach, Mickelson, Eckert, Opay, Swimmer, Seminoff and Jones2014 for the tags used for olive ridley (Lepidochelys olivacea) and green (Chelonia mydas) turtles), we infer that drag caused by satellite transmitter placement was not a determinant for loggerhead movements presented here, as other studies have reported (Senko et al., Reference Senko, Megill, Brooks, Templeton and Koch2019).
Tracked loggerheads presented a reduction of travel speeds that might indicate a shift from migratory (or transit) movements to localized foraging activity. For example, Turtles B, C and D had greater travel rates during the initial portion of their tracking durations, but all three eventually slowed down (from 13.38 to 6.84 km day−1, 12.31 to 7.59 km day−1 and 18.87 to 1.39 km day−1, respectively) (Table 1), which indicated their shift to more localized movements and perhaps foraging activity. This was confirmed with the Kernel density analyses that highlight these travel rate reduction segments of the tracks, as areas of high use. Apparently these loggerhead turtles are largely neritic foragers in the GC, which contrasts with their life history in the Central North Pacific where they are exclusively oceanic predators (Polovina et al., Reference Polovina, Howell, Kobayashi and Seki2001, Reference Polovina, Uchida, Balazs, Howell, Parker and Dutton2006; Parker et al., Reference Parker, Cooke and Balazs2005). Migration straightness index (MSI) indicated that, except turtle (A), tracked turtles made exploratory movements within the GC until they found a suitable foraging area, indicated by slower movements and greater tortuosity in the track line (Table 1). Turtle A was released in BLA and performed foraging movements upon release for ~30 days prior to exiting the GC and moving towards the Central Pacific where it was last tracked nearly 3000 km to the west of the entrance of the Gulf. This loggerhead was the largest included in this study (68.3 cm SCL), close to the mean size of nesting loggerheads in Japan (70 cm SCL; Hatase et al., Reference Hatase, Matsuzawa, Sato, Bando and Goto2004), which suggests this turtle may have been returning to its natal nesting beach in Japan for reproduction. Although turtles D and A had the highest MSI value (0.75 and 0.56, respectively) and exhibited the greatest travel rates (mean = 18.87 and 19.18 km days−1 respectively), they presented different migration strategies. While Turtle A remained within the release location, and then initiated a migration towards the Central North Pacific (CNP), Turtle D departed shortly after deployment further inside the GC and exhibited a high travel rate (18.87 km day−1) until it reached Tiburon Island where it presented the lowest travel rate of this study (1.39 km day−1) and remained for ~60 days, ceasing its search behaviour (Zollner & Lima, Reference Zollner and Lima1999; Senko et al., Reference Senko, Megill, Brooks, Templeton and Koch2019). Turtles B, C and E showed low MSI values (range = 0.15–0.44), indicating that they made more sinuous movements, which according to optimal search strategy (Zollner & Lima, Reference Zollner and Lima1999), indicates that these turtles performed search behaviour in greater measure until their arrival to the identified foraging sites. It has also been observed in other studies that turtles with less energetic reserves, such as post-nesting turtles (Luschi et al., Reference Luschi, Hays, Del Seppia, Marsh and Papi1998; Seminoff et al., Reference Seminoff, Zárate, Coyne, Foley, Parker, Lyon and Dutton2008) present higher MSI values than turtles with higher energetic reserves. This can explain why most turtles tracked for this study made sinuous movements and presented search behaviour, consistent also with their Body Condition Index (BCI) (Table 1).
The apparent arrival to foraging areas is also supported by Chl-a values for each of these sites. The areas considered to be putative foraging habitats (based on reduction in travel speeds) had mean values of water chlorophyll concentrations ranging from 0.88–3.85 mg m−3. Seasonality did not appear to affect productivity in the identified foraging zones, as all sites had eutrophic Chl-a values (>1 mg m−3) throughout the year, likely due to local enrichment mechanisms such as tidal mixing and upwelling (Gaxiola-Castro et al., Reference Gaxiola-Castro, Garcia and Botello-Ruvalcaba1995). Although it is well known that loggerhead turtles do not feed directly on primary producers (i.e. phytoplankton, algae, seagrass), high Chl-a concentration is linked to high primary productivity and affects prey diversity and abundance (Barceló et al., Reference Barceló, Domingo, Miller, Ortega, Giffoni, Sales, McNaughton, Marcovaldi, Heppell and Swimmer2013). It is not surprising that areas such as the Upper Gulf, Tiburon Island and the San Ignacio-Navachiste-Macapule Lagoon System – which were determined to be putative foraging areas – are known as productivity hotspots that host rich marine vertebrate (including other species of sea turtles) and invertebrate communities (Gaxiola-Castro et al., Reference Gaxiola-Castro, Garcia and Botello-Ruvalcaba1995; Valencia, Reference Valencia2013). Loggerhead turtles in the North Pacific are known to follow the Transition Zone Chlorophyll Front shifts and are associated with the Kuroshio Extension Bifurcation Region (KEBR) as these fronts provide the basis for potential forage in this region (Polovina et al., Reference Polovina, Howell, Kobayashi and Seki2001, Reference Polovina, Uchida, Balazs, Howell, Parker and Dutton2006; Kobayashi et al., Reference Kobayashi, Polovina, Parker, Kamezaki, Cheng, Uchida and Balazs2008). The high values of Chl-a concentration presented in the foraging areas in the GC are linked to the appearance of rich food patches that predators such as sea turtles take advantage of and it is possible they also ‘follow’. Furthermore, while there is no literature that reports red crab (Pleuroncodes planipes) occurring inside the Gulf of California, remains of this species of red crab were found in the tracked turtles' faeces after their capture. Pleuroncodes planipes occurs in dense patches following high productivity peaks during upwelling season in the GC (pers. comm). It is possible that loggerhead turtles tracked in this study were following these rich food patches, performing an opportunistic habitat use inside the GC as they are recognized as opportunistic foragers (Peckham et al., Reference Peckham, Maldonado-Diaz, Tremblay, Ochoa, Polovina, Balazs, Dutton and Nichols2011).
Loggerhead turtles are known to forage in waters with a wide range of temperatures worldwide, from 10.2–30.4°C (Polovina et al., Reference Polovina, Howell, Kobayashi and Seki2001, Reference Polovina, Uchida, Balazs, Howell, Parker and Dutton2006; Hawkes et al., Reference Hawkes, Broderick, Coyne, Godfrey and Godley2007; Barceló et al., Reference Barceló, Domingo, Miller, Ortega, Giffoni, Sales, McNaughton, Marcovaldi, Heppell and Swimmer2013), although foraging is more prevalent at temperatures above 13°C (Bentivegna et al., Reference Bentivegna, Valentino and Hochscheid2007). The turtles tracked in this study foraged in waters ranging from 27.8–34.4°C with an overall mean value of 30.3 ± 2.4°C. This is a relatively high water temperature for foraging loggerheads, and is likely due to turtles acclimating to the GC's overall higher temperatures (coldest SST value estimated for this study: 17.4°C in winter), which are caused by its unique bathymetry, circulation dynamics and semi-enclosed nature (Gaxiola-Castro et al., Reference Gaxiola-Castro, Garcia and Botello-Ruvalcaba1995; Lavín et al., Reference Lavín, Castro, Beier, Cabrera, Godınez and Buenrostro2014). Indeed, warm temperatures are favourable for sea turtles (Bentivegna et al., Reference Bentivegna, Valentino and Hochscheid2007) and although higher temperatures may result in greater metabolic rate, this was probably offset by more efficient energy acquisition by the tracked loggerheads, including detection, capture and assimilation of prey (Dunham et al., Reference Dunham, Grant and Overall1989; Peckham et al., Reference Peckham, Maldonado-Diaz, Tremblay, Ochoa, Polovina, Balazs, Dutton and Nichols2011). Loggerhead residency in the GC is probably due to the region providing both food availability and thermal requirements.
Conservation implications
So far, loggerheads in the eastern Pacific have primarily been studied in the Gulf of Ulloa on the Pacific coast of the Baja California Peninsula; however, our findings indicate that the GC should also be considered a key area for the foraging distribution of loggerheads for the eastern North Pacific region. Four of the loggerhead foraging areas identified in this study overlap with known foraging areas of east Pacific green turtles Chelonia mydas (Seminoff et al., Reference Seminoff, Resendiz, Resendiz and Nichols2004; Valencia, Reference Valencia2013), and the Upper Gulf is a key foraging area for leatherback turtles Dermochelys coriacea (Seminoff & Dutton, Reference Seminoff and Dutton2009, NOAA unpubl. data). This latter site also hosts the highly endangered Gulf harbour porpoise, Phocoena sinus (known as vaquita marina). These observations underscore the conservation value of satellite telemetry efforts focused on loggerhead turtles. In a broader marine conservation context, it is also apparent that loggerhead conservation efforts focused on the foraging sites identified in this study may benefit multiple sea turtle species as well as an endemic cetacean.
Supplementary material
The supplementary material for this article can be found at https://doi.org/10.1017/S0025315420000636
Acknowledgements
We gratefully acknowledge Adalberto García, Gaspar Angulo, Vladimir De La Toba and the fishers who turned in the turtles. We also thank Red Tortuguera A.C., Grupo Tortuguero de las Californias A.C., and the Wildlife Conservation Program for their help in rehabilitating of Turtle A.
Financial support
This research has been funded through the Secretaría de Educación y Posgrado – Instituto Politécnico Nacional (projects: SIP20141052; SIP20151561; SIP20161935).
Conflict of interest
The authors declare that they have no conflict of interest.
Ethical standards
This research was supported and approved by CONACyT and SEMARNAT. Sampling, handling and care of individuals was carried out under the proper research permits: SGPAC/DGVS/02259/14 and SGPA/DGVS/04478/15.


