


1. INTRODUCTION
In laser–matter interaction, the nature and pressure of ambient gas and laser intensity has significant effects on creation of plasma shielding and plasma parameters (Sdorra & Niemax, Reference Sdorra and Niemax1992; Aguilera et al., Reference Aguilera, Aragon and Penalba1998; Dreyer et al., Reference Dreyer, Mungas, Thanh and Radziszewski2007).
In contrast to vacuum condition, laser–matter interaction in the presence of ambient gases (because of effects such as less ablation, shock wave generation, plasma confinement and deceleration, expanding plasma species collision, and penetration into the ambient gas) is more complicated (Sdorra & Niemax, Reference Sdorra and Niemax1992; Dreyer, et al Reference Dreyer, Mungas, Thanh and Radziszewski2007; Farid et al., Reference Farid, Harilal, Ding and Hassanein2014). Many researchers have studied the effects of nature and pressure of ambient gases on atomic radiation (Iida, Reference Iida1990; Lee et al., Reference Lee, Thiem, Kim, Teng and Sneddon1992), temperature and density (Harilal et al., Reference Harilal, Bindhu, Nampoori and Vallabhan1998a , Reference Harilal, O'Shay, Tao and Tillack2006; Aguilera & Araǵon, Reference Aguilera and Araǵon1999), expansion (Mahmood et al., Reference Mahmood, Rawat, Zakaullah, Lin, Tan, Springham and Lee2009, Reference Mahmood, Rawat, Springham, Tan and Le2010; Galila et al., Reference Galila, Hisham, Yosr and Gamal2010), and surface morphology (Bashir et al., Reference Bashir, Farid, Mahmood and Shahid Rafique2012; Chan et al., Reference Chan, In, Lee and Jeong2013; Khan et al., Reference Khan, Bashir, Hayat, Khaleeq-ur-Rahman and Haq2013; Dawood et al., Reference Dawood, Bashir, Akram, Hayat, Ahmed, Iqbal and Kazmi2015) of laser-induced plasma for different materials. In 2012, Farid et al studied the effects of argon (Ar), air, and helium (He) gases at 5–760 torr on copper plasma and found the maximum plasma line radiation for argon, air, and He at 10, 50, and 20 torr, respectively and also maximum electron temperature and density for Ar, air, and He (Farid et al., Reference Farid, Bashir and Mahmood2012). The plasma shielding effect due to laser intensity (ranging from 8 MW/cm2 to 0.16 GW/cm2) on ablation rate of YBa2Cu3O7 target has been studied in (Singh, Reference Singh1996; Zhang et al., Reference Zhang, Liu, Li, Hou, Yu, Guan, Tan and Lia2005). The effect of plasma shielding for 1–17 J/cm2 laser fluence and buffer gas (air, He, and Ar at 10−5–103 mbar pressure) on ablation rate of Zn, Al, Cu, Ni, Fe, Mo, W, and Ti metals has been reported by Vadillo et al. (Reference Vadillo, Fernándej Romero, Rodríguez and Laserna1999). Also, the influence of the shielding effects related to focusing distance and the pulse energy on nickel laser-induced breakdown spectroscopy (LIBS) analysis has been studied, Aguilera et al. (Reference Aguilera, Aragon and Penalba1998). The experimental and numerical effect of laser intensities (0.5, 0.7, 0.9, 1.1 GW/cm2) and background gas pressure on plasma radiation has been reported in (Mehrabian et al., Reference Mehrabian, Aghaei and Tavassoli2010; Rezaei & Tavassoli, Reference Rezaei and Tavassoli2012). Harilal et al. (Reference Harilal, Bindhu, Issac, Nampoori and Vallabhan1997), showed that the radiation lines of carbon plasma depend on the interacting laser intensity. They showed that as the laser intensity increases from 21 to 90 GW/cm2, plasma temperature, density, and ionic carbon radiation line saturate due to plasma shielding effect. Also, Akram et al. (Reference Akram, Bashir, Hayat, Mahmood, Ahmad and Khaleeq-U-Rahaman2014), investigated the effect of laser intensity (13–100 GW/cm2) on surface morphology and plasma characteristics of zinc target. Moreover, the effect of nature and pressure of ambient environments on the surface morphology, plasma parameters, hardness, and corrosion resistance of laser-irradiated Mg-alloy has been studied by Dawood et al. (Reference Dawood, Bashir, Akram, Hayat, Ahmed, Iqbal and Kazmi2015).
In this paper, the effect of plasma shielding due to laser beam intensity and ambient gas condition on plasma parameters [focused on signal-to-background ratio (S/B)] and plasma plume expansion in laser–copper interaction are investigated both experimentally and numerically to find out the optimum conditions to have the best S/B ratio, which is vital for LIBS applications. LIBS method is used for studying plasma temperature and radiation. Instead of conventional methods for studying plasma expansion such as interferometery, shadowgraphy, and fast photography (Mihaila et al., Reference Mihaila, Ursu, Gegiuc and Popa2010; Gregorcic & Mozina, Reference Gregorcic and Mozina2011; Farahbod et al., Reference Farahbod, Afshari and Agayari2012; Freeman et al., Reference Freeman, Harilal, Diwakar, Verhoff and Hassanein2013; Farid et al., Reference Farid, Harilal, Ding and Hassanein2014), the technique of probe laser absorption and scattering (Azzeer et al., Reference Azzeer, Al-Dwayyan, Al-Salhi, Kamal and Harith1996) is used here to measure plasma front edge velocity through different ambient gases at atmospheric pressure and various laser intensities. The expansion dynamics of pulsed laser generated plasma plume in ambient gas is a topic of great interest in pulsed laser deposition systems.
The paper has been arranged as follows: the experimental setup and the numerical model are described in Sections 2 and 3, respectively. The simulations are carried out by one-dimensional (1D) version of MULTI that is a radiation hydrodynamics code (Ramis et al., Reference Ramis, Schmaltz and Meyer-ter-Vehn1988). Modeling of the laser-produced Cu plasma in the presence of 1000 mbar, room temperature air has shown that the feature of the plasma shielding effect observed in the experiments can be reproduced using a continuum hydrodynamics model, which has provided valuable insight into the hydrodynamic properties of plasma. The results are presented and discussed in Section 4. The experimental observations are compared with the shock wave model (Mahmood et al., Reference Mahmood, Rawat, Zakaullah, Lin, Tan, Springham and Lee2009). The simulated results of the model are fitted to the experimental data, which are used to estimate the values of the ablation parameters using Rankine–Hugoniot jump condition. Finally, the paper is concluded in Section 5.
2. EXPERIMENTAL SETUP
A home-made Nd:YAG laser at 1064 nm with pulse duration of 28 ns at various intensities ranging from 2 to 7.1 GW/cm2 (40–150 mJ energy) is used to produce laser-induced plasma. A part of the laser beam is guided to a calorimeter to monitor energy fluctuations. Air, Ar, neon (Ne), and He at various pressures ranging from 5 to 1000 mbar are injected into a vacuum chamber. Copper with high purity is used as the target and its surface is carefully polished and then cleaned with pure acetone. The target is installed on an automated XY positioner to position a new location of the surface for the exposure of the incident laser beam. A lens with focal length of 7.5 cm is used to focus laser beam on the target. Base on equation
 $D = 2\sqrt 2 f{\rm \theta} $
for diameter (spot size) of a Gaussian laser beam at the focal plane of a focusing lens where θ ≈ 1 mrad and f = 7.5 cm are respectively the beam divergence and lens focal length, the calculated spot size is about 210 µm. The measured spot size on the target is about 310 µm where a calibrated optical microscope is used to observe the effect of the laser beam on the surface of the target. The difference is due to positioning the target slightly before the beam waist to make sure that the laser does not cause probable breakdown in ambient gas. Also, no gas breakdown was detected at the focal point in absence of the target with the highest laser intensity. An optical fiber spectrometer with 1100 line/mm grating (which was designed and constructed by authors) is used to measure plasma radiation. Software for visualization of radiation data from the camera is designed and developed in LABVIEW environment. The desired timing between laser radiation start and camera triggering is provided by an electronic delayer with 1 µs temporal-resolution, which was synchronized with the laser electro-optic driver. Plasma expansion is studied by probe laser absorption and scattering technique (Azzeer et al., Reference Azzeer, Al-Dwayyan, Al-Salhi, Kamal and Harith1996). According to Figure 1, a 2 mW He–Ne laser beam at 632.8 nm wavelength is steered parallel to the target surface with arbitrary distances from it and perpendicular to the interacting laser direction. Two convergent lenses are used to reduce the beam diameter of the probe laser for more exact measurement of probe beam separation from the target surface. Three optical filters with transmission of <1% in 1064 nm and a 3 mm diameter aperture are located in the entry of APD. This setup (i.e., APD, filters, and aperture) are located in a dark box to minimize entrance of the scattered interaction laser into the detector.
$D = 2\sqrt 2 f{\rm \theta} $
for diameter (spot size) of a Gaussian laser beam at the focal plane of a focusing lens where θ ≈ 1 mrad and f = 7.5 cm are respectively the beam divergence and lens focal length, the calculated spot size is about 210 µm. The measured spot size on the target is about 310 µm where a calibrated optical microscope is used to observe the effect of the laser beam on the surface of the target. The difference is due to positioning the target slightly before the beam waist to make sure that the laser does not cause probable breakdown in ambient gas. Also, no gas breakdown was detected at the focal point in absence of the target with the highest laser intensity. An optical fiber spectrometer with 1100 line/mm grating (which was designed and constructed by authors) is used to measure plasma radiation. Software for visualization of radiation data from the camera is designed and developed in LABVIEW environment. The desired timing between laser radiation start and camera triggering is provided by an electronic delayer with 1 µs temporal-resolution, which was synchronized with the laser electro-optic driver. Plasma expansion is studied by probe laser absorption and scattering technique (Azzeer et al., Reference Azzeer, Al-Dwayyan, Al-Salhi, Kamal and Harith1996). According to Figure 1, a 2 mW He–Ne laser beam at 632.8 nm wavelength is steered parallel to the target surface with arbitrary distances from it and perpendicular to the interacting laser direction. Two convergent lenses are used to reduce the beam diameter of the probe laser for more exact measurement of probe beam separation from the target surface. Three optical filters with transmission of <1% in 1064 nm and a 3 mm diameter aperture are located in the entry of APD. This setup (i.e., APD, filters, and aperture) are located in a dark box to minimize entrance of the scattered interaction laser into the detector.
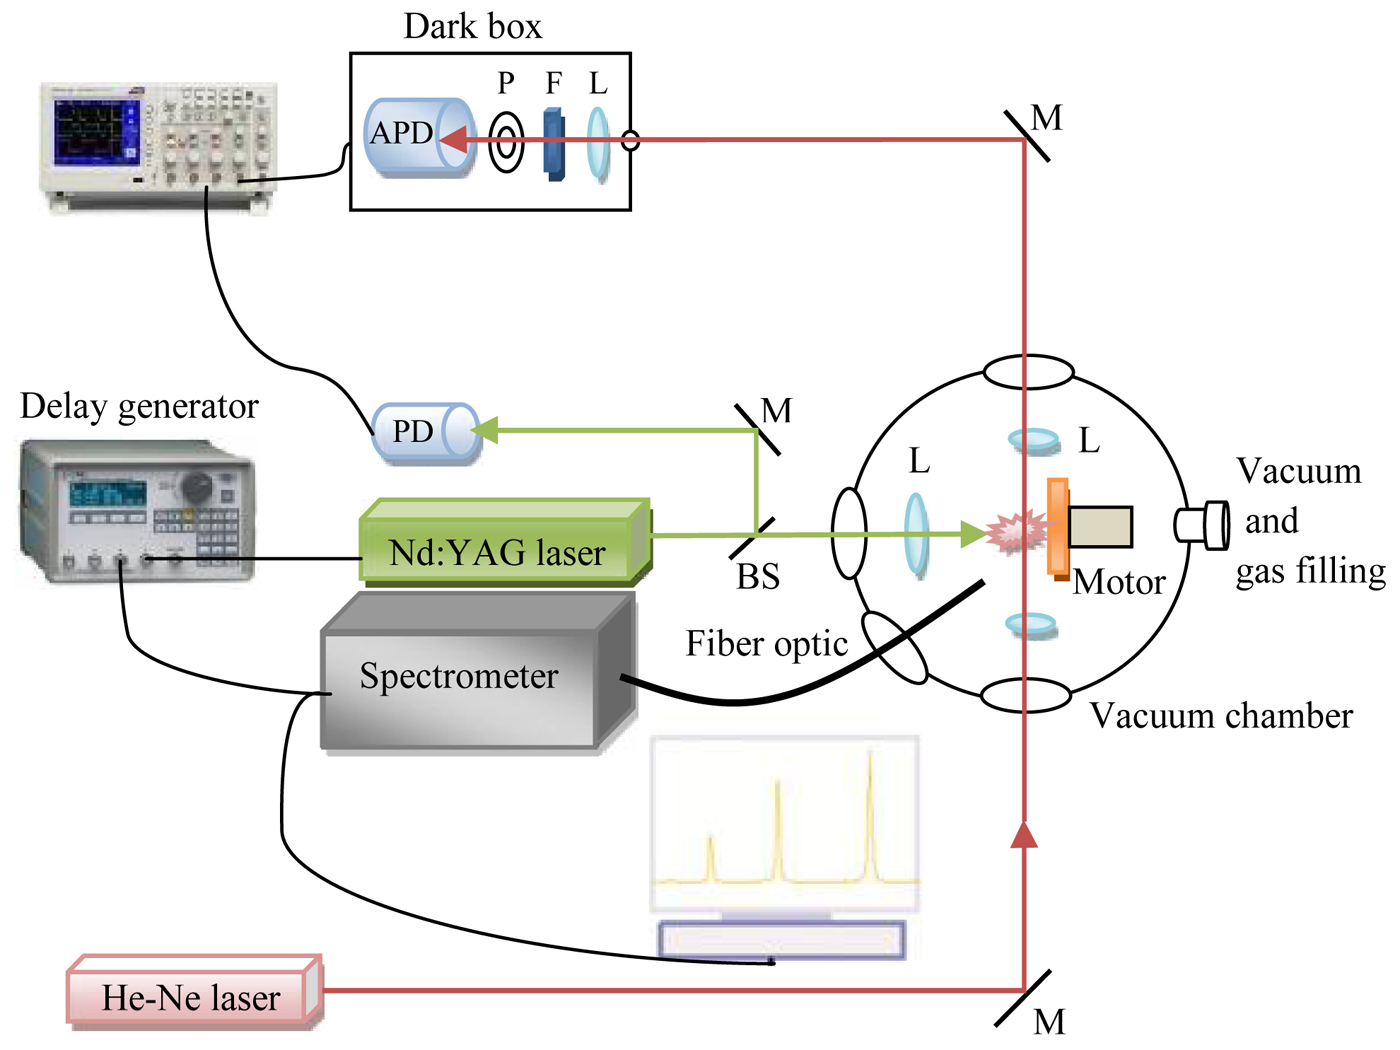
Fig. 1. Experimental setup, M, mirror; APD, avalanche photodiode; PD, photodiode; F, filter; L, lens; P, aperture; BS, beam splitter.
The arrival time of plasma plume to probe beam position is detected at reduced amplitude of probe signal with a digital oscilloscope (Tektronix model TDS3052B). Using this method, it is possible to estimate velocity of the plasma plume at various positions from the target surface.
3. NUMERICAL AND THEORETICAL MODELS
Computational study was done using the MULTI code (Ramis et al., Reference Ramis, Schmaltz and Meyer-ter-Vehn1988). MULTI is a multidimensional radiation hydrodynamic code that simulates the behavior of matter at high densities of energy typically found in inertial fusion and related experiments of laser interaction with matter. In the 1D version of MULTI code the fluid equations of continuity of mass, Eq. (1), momentum, Eq. (2), and energy, Eq. (3), both for ions and electrons, are coupled with thermal radiation transport, heat conduction, and several energy deposition mechanisms such as laser and ion beams.
 $$D_{\rm t}{\rm \rho} = - {\rm \rho} \nabla. v,$$
 $${\rm \rho} D_{\rm t}v = - \nabla P - R,$$
 $${\rm \rho} D_{\rm t}e = - P\nabla. v - \nabla. q - Q + S.$$
The main variables: matter density ρ(r, t), velocity v(r, t), specific internal energy e(r, t), and pressure P(r, t) are considered here to be functions of coordinate and time. D
t is the time derivative in a frame moving with the fluid
 $(D_{\rm t} \equiv \partial {}_{\rm t} + v.\nabla )$
. R and Q are the radiated momentum and energy per unit volume, respectively, q is the thermal flux and S includes other energy sources such as laser or ion beam (laser here). The energy has been written in terms of the specific internal energy e. A simple treatment of the heat transport,
$(D_{\rm t} \equiv \partial {}_{\rm t} + v.\nabla )$
. R and Q are the radiated momentum and energy per unit volume, respectively, q is the thermal flux and S includes other energy sources such as laser or ion beam (laser here). The energy has been written in terms of the specific internal energy e. A simple treatment of the heat transport,
 $\vec q = - {\rm \kappa} \nabla T$
is assumed in the code, where k is the thermal conductivity of electrons. The ideal gas equation of state (EOS) P = ρRT and e = (γ − 1)RT or tabulated SESAME EOS are used to close fluid equations of motion together with mass and energy transport equations. Here, γ = c
p
/c
v and R are the ratio of specific heats at constant pressure and volume, and universal gas constant, respectively. The 1D spherical frame simulation is used. The simulated region is a thin plate of Cu with 2 mm thickness and the environment is air gas at normal condition (300 K, 1 atm, and mass density 1.23 kg/cm3) and the energy of laser beam is completely dumped at the critical density. The MULTI code access matter properties through tables generated by codes SNOP, MPQEOS, or from SESAME library (Ramis, Reference Ramis2012). The code uses the inverted tables of EOS for electrons and ions for selected matter to calculate the temperature and pressure of plasma from the mass density and specific internal energy. Planck and Rosseland opacities are used for calculation of the plasma absorption coefficients (Ramis, Reference Ramis2012). We derived the EOS of copper and air using MPQEOS code and the ideal gas table, respectively. The plasma plume is assumed to be formed with the laser under similar irradiance conditions used in the present experiment except that a linear power ramp pulse is used in simulations rather than a semi Gaussian pulse for the laser power. The hydrodynamic model describes laser metal interaction with treating the target heating, evaporation, and ionization processes.
$\vec q = - {\rm \kappa} \nabla T$
is assumed in the code, where k is the thermal conductivity of electrons. The ideal gas equation of state (EOS) P = ρRT and e = (γ − 1)RT or tabulated SESAME EOS are used to close fluid equations of motion together with mass and energy transport equations. Here, γ = c
p
/c
v and R are the ratio of specific heats at constant pressure and volume, and universal gas constant, respectively. The 1D spherical frame simulation is used. The simulated region is a thin plate of Cu with 2 mm thickness and the environment is air gas at normal condition (300 K, 1 atm, and mass density 1.23 kg/cm3) and the energy of laser beam is completely dumped at the critical density. The MULTI code access matter properties through tables generated by codes SNOP, MPQEOS, or from SESAME library (Ramis, Reference Ramis2012). The code uses the inverted tables of EOS for electrons and ions for selected matter to calculate the temperature and pressure of plasma from the mass density and specific internal energy. Planck and Rosseland opacities are used for calculation of the plasma absorption coefficients (Ramis, Reference Ramis2012). We derived the EOS of copper and air using MPQEOS code and the ideal gas table, respectively. The plasma plume is assumed to be formed with the laser under similar irradiance conditions used in the present experiment except that a linear power ramp pulse is used in simulations rather than a semi Gaussian pulse for the laser power. The hydrodynamic model describes laser metal interaction with treating the target heating, evaporation, and ionization processes.
Continuity equations of mass [Eq. (4)], momentum [Eq. (5)], and energy, [Eq. (6)] at both sides of shock wave through Rankine–Hugoniot jump condition can be written as (Landau et al., Reference Landau and Lifshitz1959):
 $${\rm \rho} _1u_1 = {\rm \rho} _2u_2,$$
 $${\rm \rho} _1u_1^2 + P_1 = {\rm \rho} _2u_2^2 + P_2,$$
 $$\displaystyle{1 \over 2}u_1^2 + e_1 + \displaystyle{{P_1} \over {{\rm \rho} _1}} = \displaystyle{1 \over 2}u_2^2 + e_2 + \displaystyle{{P_2} \over {{\rm \rho} _2}},$$
where ρ1 and ρ2 are mass densities, T 1 and T 2 are temperatures, P 1 and P 2 are pressures, e 1 and e 2 are internal energies, and u 1 and u 2 are velocities in undisturbed ambient gas and behind shock wave, respectively. Dimensionless parameter that determines the shock wave power is Mach number, M, which is the ratio of shock velocity, u sh, to sound velocity in undisturbed ambient, α1:
 $$M = \displaystyle{{u_{{\rm sh}}} \over {{\rm \alpha} _1}} = \left( {\displaystyle{{{\rm \rho} _1u_{{\rm sh}}^2} \over {{\rm \gamma} P_1}}} \right)^{1/2}.$$
Plasma hydrodynamic characteristics such as temperature, pressure, and density can be calculated from Eqs (4)–(6) and shock model:
 $${\rm \rho} _2 = \displaystyle{{{\rm \gamma} + 1} \over {{\rm \gamma} - 1}}{\rm \rho} _1,$$
 $$T_2 = \left( {\displaystyle{{2{\rm \gamma}} \over {{\rm \gamma} + 1}}} \right)\left[ {\displaystyle{{{\rm \gamma} - 1} \over {{\rm \gamma} + 1}}M^2} \right]T_1,$$
 $$P_2 = \left( {\displaystyle{2 \over {{\rm \gamma} + 1}}} \right){\rm \rho} _1u_{{\rm sh}}^2.$$
The experimental results of plasma plume expansion velocity through different gases are used to find out the plasma hydrodynamic characteristics behind shock wave using the above equations.
4. RESULTS AND DISCUSSION
4.1. The influence of plasma shielding effect on electron temperature, density, and atomic line emission
Time integrated intensity of plasma radiations induced in laser–copper interaction at various ambient gas conditions and various laser intensities is experimentally obtained to study plasma shielding effect on S/B ratio. To be more confident, each data point is at least an average value of five measurements. For more accurate investigation of the plasma shielding effects on atomic line emission, changes in intensity of three Cu atomic lines at 510.55, 515.32, and 521.88 nm versus laser intensities at 1000 mbar air were measured and depicted in Figure 2. Increasing laser intensity from 2 to 4 GW/cm2, results in a strong increase of atomic line emission due to increasing plasma temperature and density. The emission intensities are saturated for 4–7.1 GW/cm2. The increasing and saturation behavior of lines intensity has its origin similar to the behavior of plasma temperature and density because of plasma shielding (Figures 4 and 5).

Fig. 2. The variation of three different atomic lines of Cu at 510.55, 515.32, and 521.88 nm at various laser intensities ranging from 2 to 7.1 GW/cm2.
Similar to our results for Cu atomic lines, it has been reported that by increasing laser intensity the first and second carbon ion lines emission intensity at 392 and 580.01 nm increases rapidly at first and finally saturates at higher laser intensities (Harilal et al., Reference Harilal, Bindhu, Issac, Nampoori and Vallabhan1997).
The effect of ambient gases and their pressure on 515.32 nm Cu atomic line emission intensity for 2 GW/cm2 laser intensity are depicted in Figure 3a.

Fig. 3. (a) 515.32 nm Cu plasma atomic line emission intensity and (b) continuum radiation intensity for different gases at various pressures ranging from 5 to 1000 mbar and 2 GW/cm2 laser intensity.
Emission intensity initially increases with increasing pressure up to 70, 100, 40, and 30 mbar for argon, air, Ne, and He respectively and then decreases and finally saturates. These results are consistent with results in references (Farid et al., Reference Farid, Bashir and Mahmood2012; Nakimana et al., Reference Nakimana, Tao, Gao, Hao and Lin2013; Dawood et al., Reference Dawood, Bashir, Akram, Hayat, Ahmed, Iqbal and Kazmi2015). The other atomic lines show the same behavior. At very low pressures, plasma expands fast and freely, causing a low density and temperature plasma. As pressure increases, plasma temperature and density increase which in turn leads to increase in atomic emission intensity. This can be due to increasing collision frequency of plasma species, transferring part of ambient gas energy to the plasma close to the target surface and also plasma confinement. As the pressure increases, more plasma confinement near the target surface results in increase of plasma shielding and less effective laser target interaction. Even though more laser energy is absorbed in plasma in this case, but more increase of electrons elastic interaction frequency with ambient gas atoms at higher pressures reduces free electrons energy produced by inverse bremsstrahlung effect and finally results in reduction of the plasma density and electron temperature (Harilal et al., Reference Harilal, Bindhu, Nampoori and Vallabhan1998a ). The highest and the lowest intensity are for the cases of Ar and He, respectively, and air and Ne have nearly the same intensity. The reason is different first ionization energy, E, to atomic mass, M, ratio of gases and also their different heat conductions. There is more amount of energy loss due to elastic and inelastic collisions with ambient gas atoms in the presence of gases with higher E/M (Harilal et al., Reference Harilal, Bindhu, Nampoori and Vallabhan1998a ; Farid et al., Reference Farid, Bashir and Mahmood2012; Nakimana et al., Reference Nakimana, Tao, Gao, Hao and Lin2013). Heat conduction of the ambient gas has also an important role in plasma energy loss.
According to Table 1, lowest atomic mass and also highest E/M and heat conduction belong to He, Ne, air, and Ar, respectively. The effect of ambient gases and their pressures on continuum radiation of the plasma are depicted in Figure 3b. Continuum radiation has the highest value in the presence of Ar, air, Ne, and He, respectively. Also, as ambient gas pressure increases up to 200 mbar, continuum radiation increases for all the gases and then saturates at higher pressures.
Table 1. Physical characteristics of gases (Farid et al., Reference Farid, Bashir and Mahmood2012; Kramida et al., Reference Kramida, Ralchenko and Reader2012)
Two main mechanisms of plasma continuum radiation are bremsstrahlung and recombination radiation. Bremsstrahlung radiation energy in volume, time, and frequency units at specific frequency, ν, is determined from (Rezaei & Tavassoli, Reference Rezaei and Tavassoli2012):
 $$I_{{\rm brems}}(v) = \displaystyle{{n_{\rm e}e^6} \over {24{\rm \pi} ^2c^3{\varepsilon} _0^3 m_{\rm e}h}}\displaystyle{h \over {K_{\rm B}T}}\sqrt {\displaystyle{{K_{\rm B}T} \over {m_{\rm e}}}} e^{ - hv/K_{\rm B}T}\sum\nolimits_m {n_{\rm m}z_{\rm m}^2},$$
where c is the light speed in a vacuum, m e, n m, and n e are the electron mass, ionic, and electronic density, respectively. Z i and ε0 are the atomic number and vacuum permittivity. As the highest temperature and electron density occur in the presence of Ar, Ne, air, and He (Farid et al., Reference Farid, Bashir and Mahmood2012), respectively, and as Ar and He has the lowest and highest ionization energies (see Table 1), it is reasonable to conclude that plasma continuum radiation to have highest and lowest value in Ar and He, respectively. To calculate T e experimentally, it is supposed that local thermodynamic equilibrium is held in this experiment (Akram et al., Reference Akram, Bashir, Hayat, Mahmood, Ahmad and Khaleeq-U-Rahaman2014; Farid et al., Reference Farid, Harilal, Ding and Hassanein2014; Dawood et al., Reference Dawood, Bashir, Akram, Hayat, Ahmed, Iqbal and Kazmi2015). So, plasma temperature is calculated using Boltzmann equation:
 $$\ln \left( {\displaystyle{{{\rm \lambda} _{{\rm mn}}I_{{\rm mn}}} \over {g_{{\rm mn}}A_{{\rm mn}}}}} \right) = - \displaystyle{{E_{\rm m}} \over {kT_{\rm e}}} + \ln \left( {\displaystyle{{N(T)} \over {U(T)}}} \right).$$
In the above equation I m,n, λm,n, A m,n, g m, and E m are intensity, wavelength, transition probability, degeneracy, and energy for the upper level, respectively. U(T), N(T), k, and T e are the partition function, total number density, Boltzmann constant, and electron temperature, respectively. By drawing the left-hand side of Eq. (12) as a function of upper excited energy E m, electron temperature is determined through the slope of its straight line, Figure 4. Time-integrated intensities of four atomic lines at 510.55, 515.32, 521.88, and 578.58 nm are used to calculate the electron temperature.
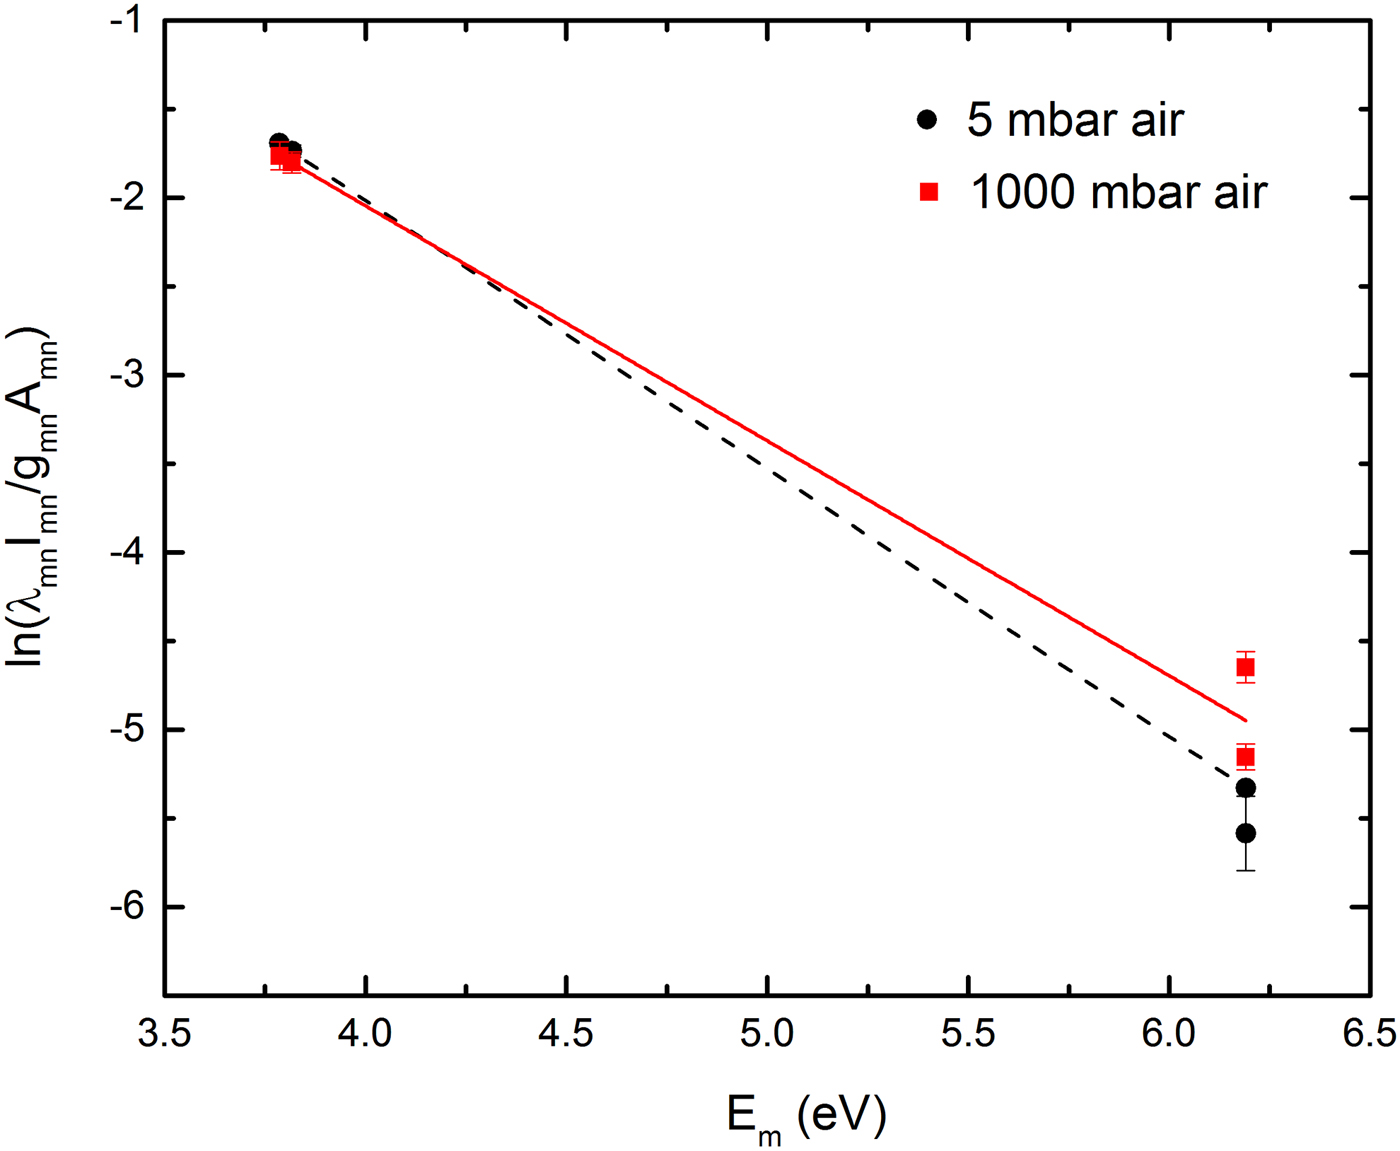
Fig. 4. Boltzmann plot for air at 5 and 1000 mbar and 2 GW/cm2 laser intensity.
The necessary values for calculating electron temperature are listed in Table 2.
Table 2. Necessary data for plasma temperature calculation (Kramida et al., Reference Kramida, Ralchenko and Reader2012)
Electron temperature in Ar has the highest and in He has the lowest values (Farid et al., Reference Farid, Bashir and Mahmood2012; Dawood et al., Reference Dawood, Bashir, Akram, Hayat, Ahmed, Iqbal and Kazmi2015). The results show that electron temperature in air and Ne have nearly the same value especially at higher pressures (Figure 5). Increasing–decreasing and finally saturation behavior of the electron temperature with increasing pressure is obvious that is because of plasma shielding effect at higher pressures. Figure 6 shows simulation results of normalized laser absorption at target surface and electron number density close to the target surface at various laser intensities. These results show the increasing–saturation behavior. We have normalized the peak values to the maximum peak. It is seen that at lower laser intensities, the laser absorption at target surface increases almost linearly with laser intensity. However, as laser intensity rises more than about 3 GW/cm2, the plasma shielding effect happens because of laser energy absorption at the outer layers of plasma and the laser absorption at the target surface reduces leading to less effective laser target interaction.
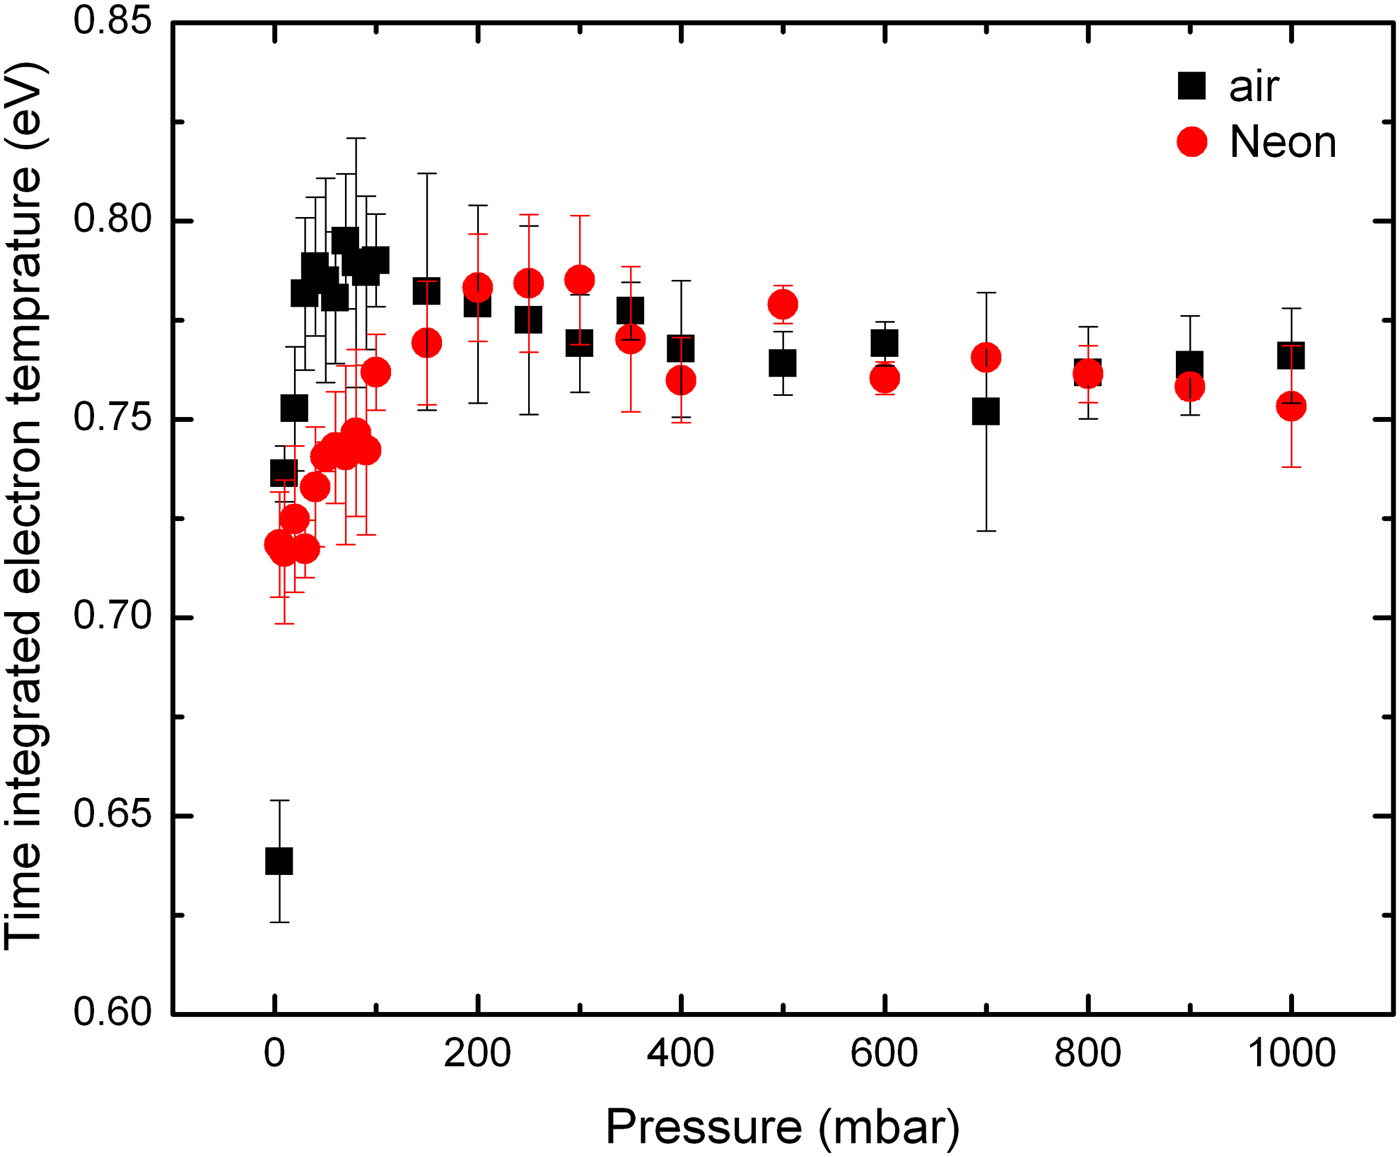
Fig. 5. Time-integrated electron temperature at various air and Ne pressures ranging from 5 to 1000 mbar.
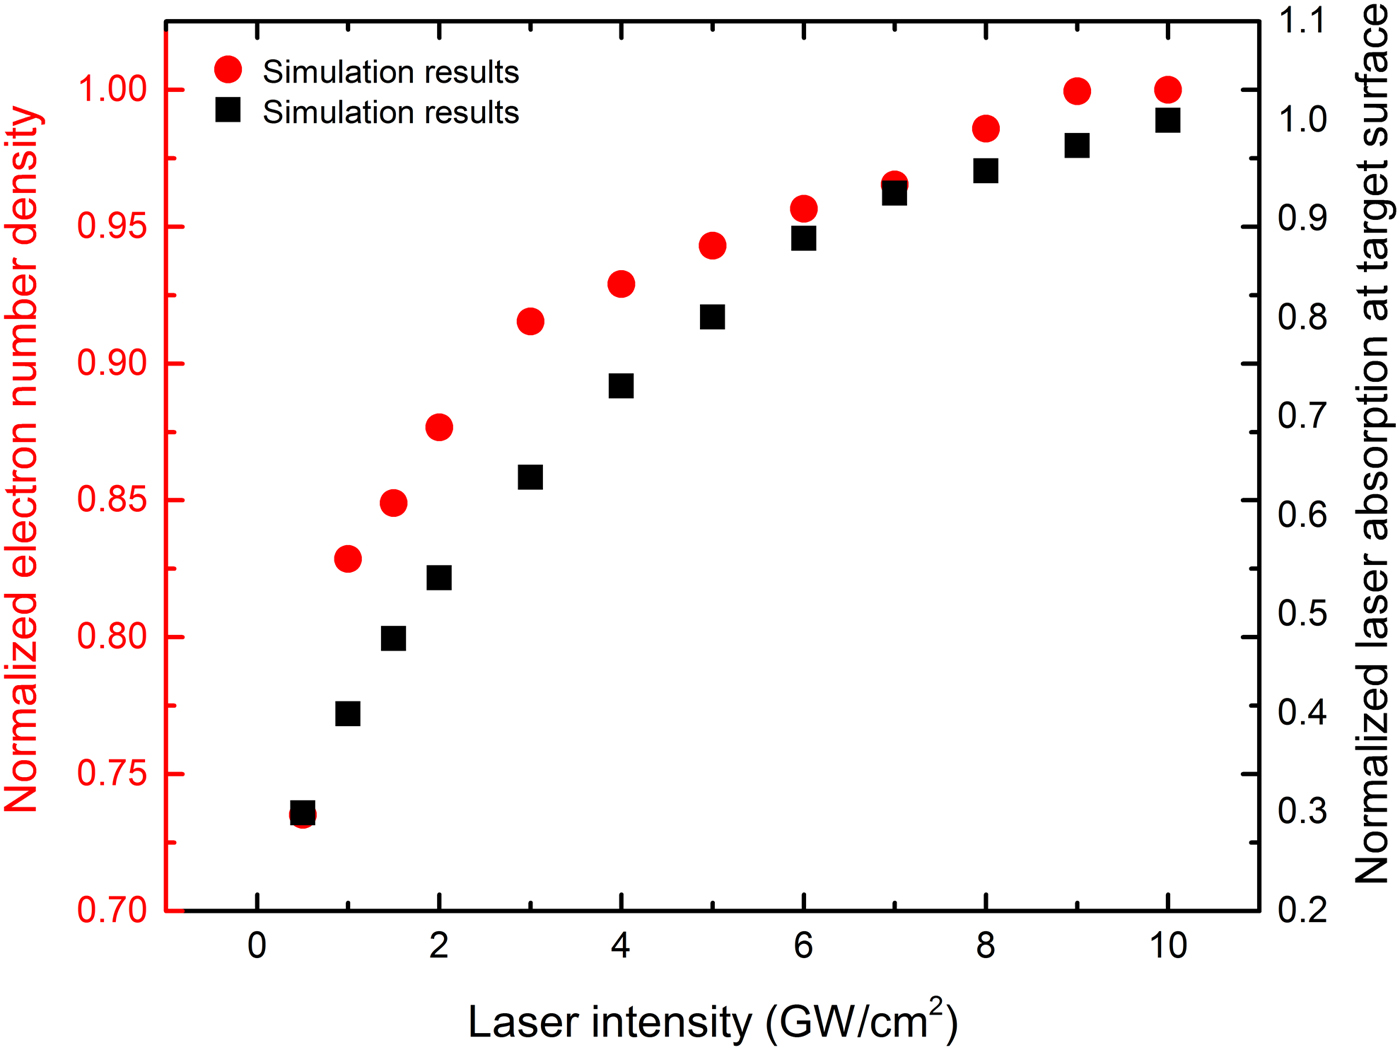
Fig. 6. The variation of laser absorption at target surface and electron density at various laser intensities ranging from 0.5 to 10 GW/cm2.
The line broadening of the emission spectrum can be used to determine the electron density. The radiating species in the plasma are majority under the influence of electric fields by fast-moving electrons and relatively slow-moving ions. This perturbing electric field acts on atoms and ions and shift their energy levels, which cause Stark line broadening. Moreover, other mechanisms such as Doppler, resonance pressure broadening and instrumental broadening also contribute. When the radiating atoms or ions are surrounded by dense plasma, the Doppler broadening mechanism is ignorable in comparison with Stark broadening (Farid et al., Reference Farid, Bashir and Mahmood2012). The electron density related to the full-width at half-maximum (FWHM) of the Stark-broadened line is given by Eq. (13),
 $$\eqalign{\Delta {\rm \lambda} _{1/2} &= 2{\rm \omega} \left( {\displaystyle{{N_{\rm e}} \over {{10}^{16}}}} \right) \cr & \quad+ 3.5A\left( {\displaystyle{{N_{\rm e}} \over {{10}^{16}}}} \right)^{1/4}\left[ {1 - 1.2N_{\rm D}^{ - 1/3}} \right] \times {\rm \omega} \left( {\displaystyle{{N_{\rm e}} \over {{10}^{16}}}} \right),}$$
where N e is the electron number density (cm−3), ω is the electron impact width parameter, and A is the ion-broadening parameter. Both ω and A are weak functions of temperature (Zeng et al., Reference Zeng, Mao, Mao, Yoo, Greif and Russo2004; Zmerli et al., Reference Zmerli, Ben Nessib, Dimitrijevic and Sahal-Bréchot2010). N D is the number of particles in the Debye sphere. The first term in Eq. (13) refers to the electron broadening and the second term refers to the ion broadening, which is very small in our case and can be neglected. Therefore, Eq. (13) reduces to Eq. (14), (Farid et al., Reference Farid, Harilal, Ding and Hassanein2014).
 $$\Delta {\rm \lambda} _{1/2} = 2{\rm \omega} \left( {N_{\rm e}/{10}^{16}} \right).$$
The Cu(I) line at 510.55 nm was used for determination of electron density, which its shape is well fitted by a Lorentzian function, indicating that self-absorption is not a major concern, (Baudelet et al., Reference Baudelet, Willis, Shah and Richardson2010; Farid et al., Reference Farid, Bashir and Mahmood2012; Takahashi et al., Reference Takahashi, Thornton, Ohki and Sakka2015). The value of ω is taken from (Konjevic & Wiese, Reference Konjevic and Wiese1990). The spectrometer also contributes the broadening of a spectral line called instrumental broadening. Generally, the instrumental broadening Δλinst must be measured separately for each device and it is neither completely Lorentzian nor Gaussian (Hahn & Nicolo, Reference Hahn and Nicolo2010). The instrumental broadening of spectrometer is determined by using a He–Ne laser with line-width ~2 × 10⁻³ at 632.8 nm, (Parsons, Reference Parsons1968). It is found that the spectrometer response was closely a Gaussian profile with Δλinst ≈ 2 nm (FWHM). The Stark broadening Δλstark can be calculated by deconvolution process and using Eq. (15), (Hahn & Nicolo, Reference Hahn and Nicolo2010).
 $$\Delta {\rm \lambda} _{{\rm stark}} = \Delta {\rm \lambda} _{{\rm tot}} - \Delta {\rm \lambda} _{{\rm inst}}^2 /\Delta {\rm \lambda} _{{\rm tot}}.$$
Typically the Stark effect is the main contributor for line broadening in the laser plasmas, which is given by a Lorentzian profiles. Figure 7 shows the resulting variation in the evaluated electron density of Cu plasma varying from 1 × 10¹⁶ to 9 × 1016 cm−3 for various laser intensities in air. In general, an increase in broadening is observed with increasing laser intensity caused by the Stark effect.
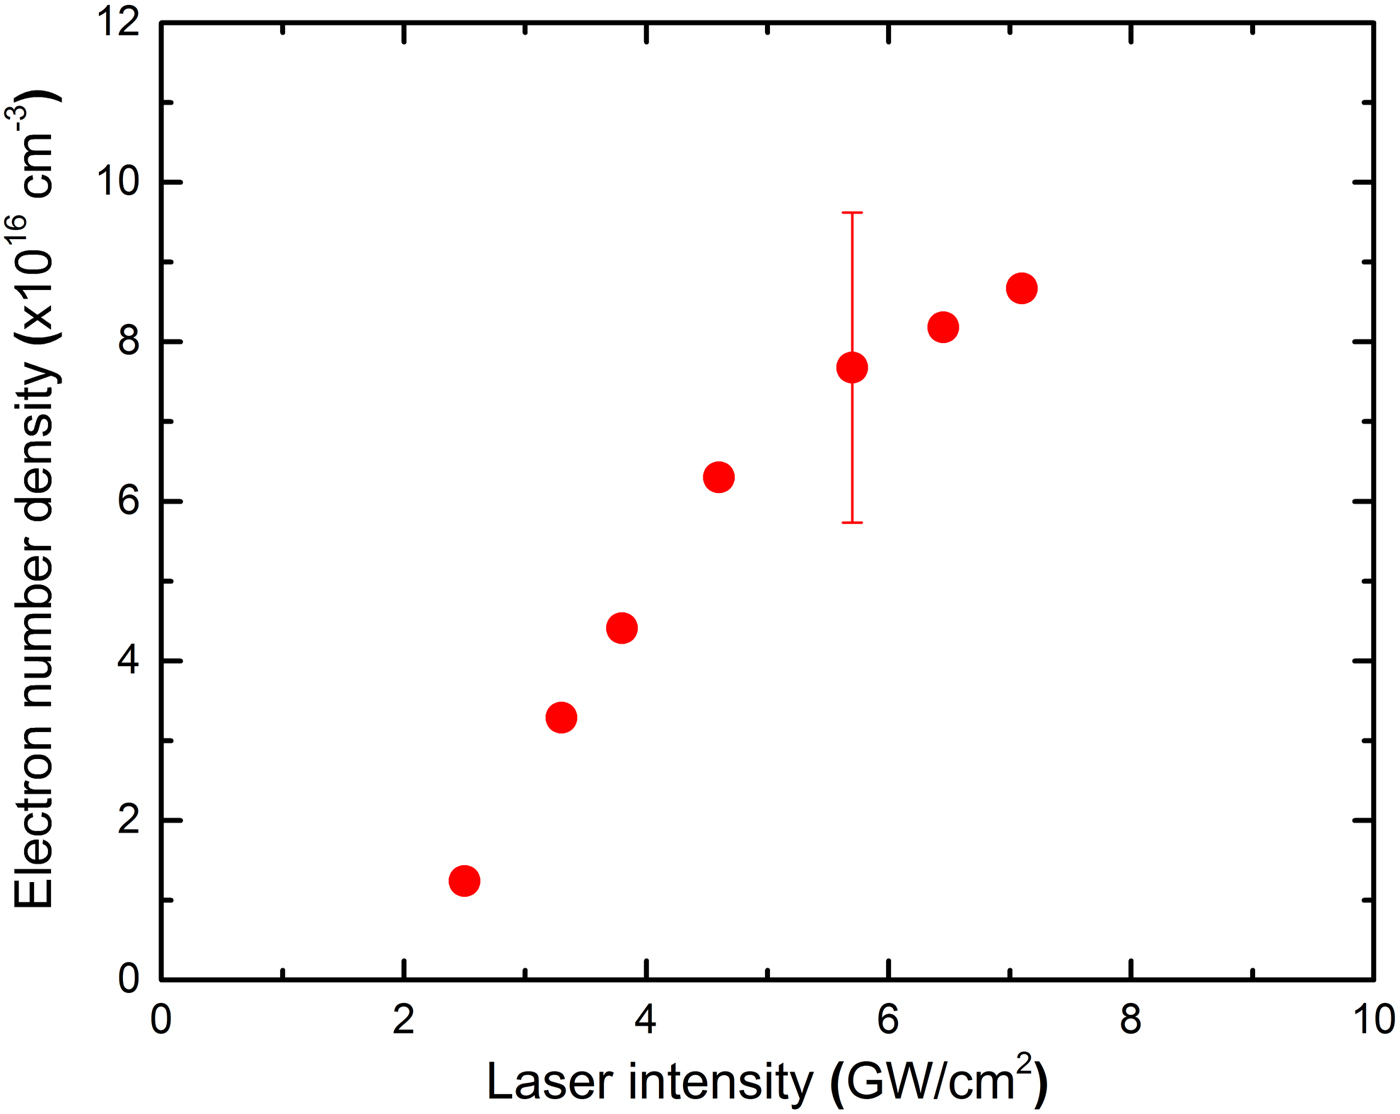
Fig. 7. The experimental results of the electron density variation at various laser intensities ranging from 2 to 7 GW/cm2.
This suggests that the density of the plume is related to the laser intensity and increasing–saturation effect is obvious because of plasma shielding effect. Also, it has been shown an increase in broadening with increasing ambient pressure caused by the Stark effect (Farid et al., Reference Farid, Bashir and Mahmood2012, Reference Farid, Harilal, Ding and Hassanein2014).
Figure 8 shows the simulation and experimental results of the normalized electron temperature at 2 mm distance from the target surface and time-integrated electron temperature at various laser intensities, respectively. Simulation results show that increasing laser intensity up to about 3 GW/cm2 raises the electron temperature and then it shows saturation behavior with laser intensity increment. According to the experimental results as laser intensity increases to about 3.5 GW/cm2, plasma temperature raises up to 1.15 eV, and then more increase of the laser intensity leads to temperature reduction and its final saturation.
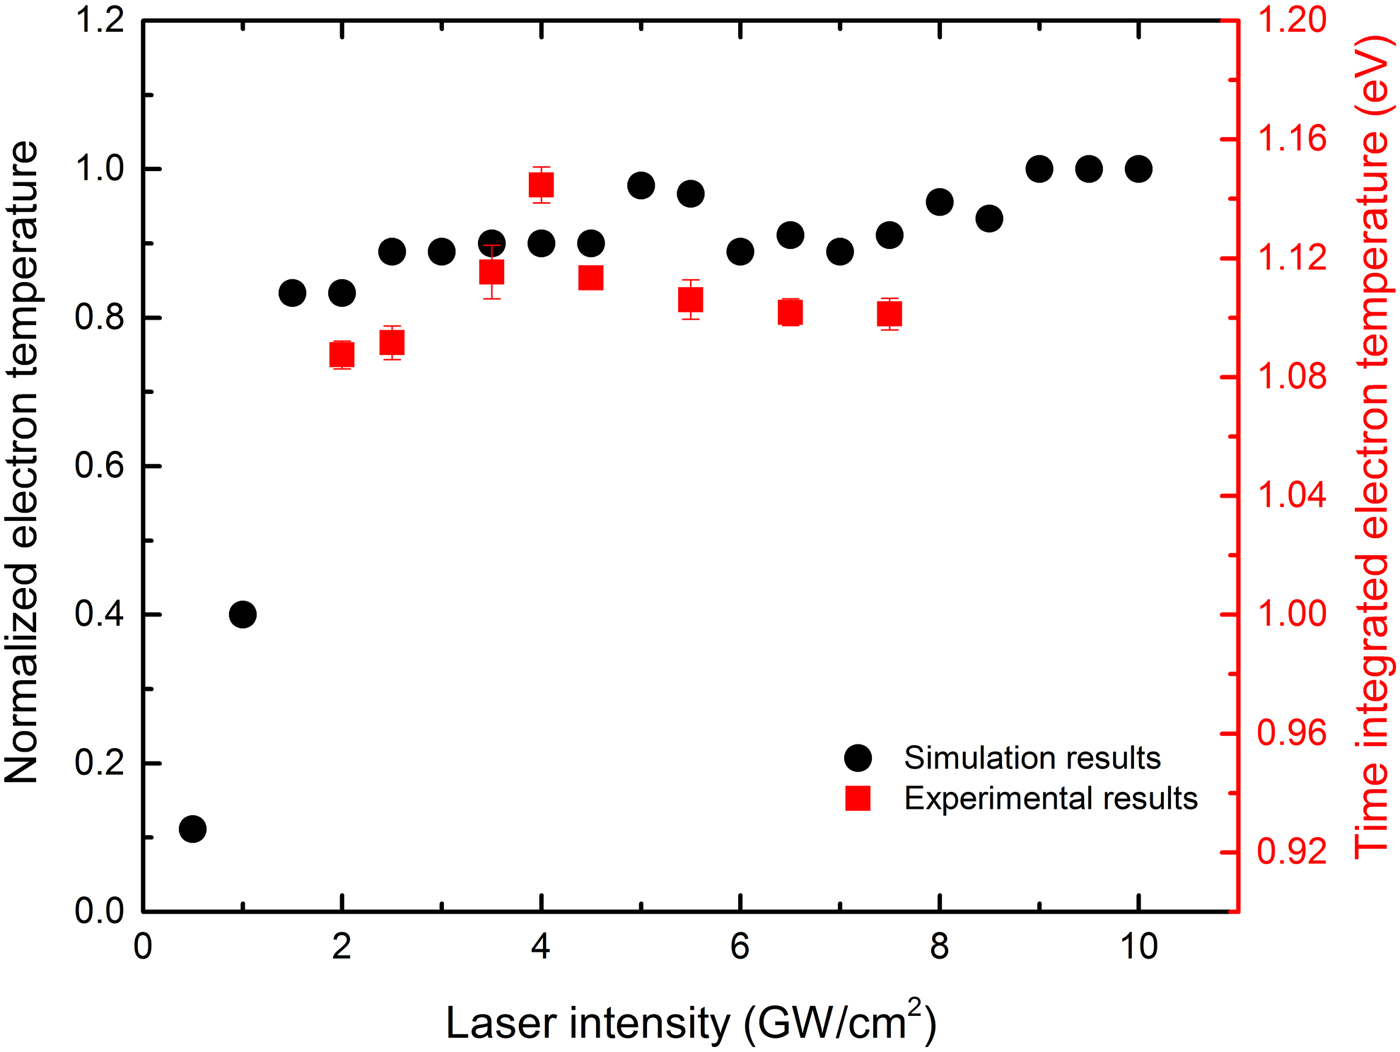
Fig. 8. Simulation results of the normalized electron temperature close the target surface and experimental results of time-integrated electron temperature, at various laser intensities.
According to the simulation results in Figure 6, saturation of plasma electron temperature and electron density at higher laser intensities (Figs 7 and 8) and lines emission intensities (Fig. 2) is due to the increased plasma shielding effect, absorption, and/or reflection of laser beam from the plasma, which results in an ineffective laser–target interaction. Reflection of incident laser depends on plasma frequency, νe, and laser frequency, νl where laser frequency used in this research is νl = 2.828 × 10¹⁴ Hz. Also, plasma frequency is calculated using Eq. (16)
 $$v_{\rm p} = 8.9 \times 10^3n_{\rm e}^{0.5},$$
where n e is the electron density. According to the laser characteristics used in this research and the expected value of electron density (Farid et al., Reference Farid, Bashir and Mahmood2012; Akram et al., Reference Akram, Bashir, Hayat, Mahmood, Ahmad and Khaleeq-U-Rahaman2014; Dawood et al., Reference Dawood, Bashir, Akram, Hayat, Ahmed, Iqbal and Kazmi2015), it is expected that the plasma frequency to be in order of 1012 Hz, which is much less than the laser frequency. Therefore, laser absorption seems to be more effective than laser reflection by the plasma. Two main absorption mechanisms in this kind of plasma are inverse bremstrahlung and photo-ionization effects (Bekfi, Reference Bekfi1976). First-stage increase and the subsequent saturation in temperature and number density diagram of Figures 6–8 can now be interpreted.
At intensities ranging from 2 to 3.5 GW/cm2, increasing of the laser intensity leads to more powerful laser–target interaction and hence more ablation rate, which consequently causes more plasma density, higher temperature, and increased inverse bremsstrahlung absorption (Luo et al., Reference Luo, Zhao, Sun, Gao, Tang, Wang and Zhao2010). Increased absorption by inverse bremstrahlung and photo-ionization effects and rising plasma density leads to formation of plasma shielding resulting in the ablation rate decrease (Singh, Reference Singh1996; Cabalín et al., Reference Cabalín, Romero, Baena and Laserna1999; Vadillo et al., Reference Vadillo, Fernándej Romero, Rodríguez and Laserna1999; Zhang et al., Reference Zhang, Liu, Li, Hou, Yu, Guan, Tan and Lia2005; Dan & Duan-Ming, Reference Dan and Duan-Ming2008) and hence reduction of density of charged species and plasma temperature (Harilal et al., Reference Harilal, Bindhu, Nampoori and Vallabhan1998b ).
For more intense laser beams, because of formation of self-regular plasma region in addition to plasma shielding effect, saturation region appears (Bleinner & Bogaerts, Reference Bleinner and Bogaerts2006; Cristoforetti et al., Reference Cristoforetti, Legnaioli, Palleschi, Tognoni and Benedetti2008). In this region, temperature, density, and plasma dimension regulate in a manner that plasma absorbs the same amount of laser energy so that it can stay in the self-regulated region (Harilal et al., Reference Harilal, Bindhu, Nampoori and Vallabhan1998b ; Hafeez et al., Reference Hafeez, Shaikh, Rashid and Baig2008). These effects are valid only for the laser-induced plasma that has heating time much less than the plasma expansion time and would result in homogenous temperature and density in the plasma. In the same research reported in (Harilal et al., Reference Harilal, Bindhu, Issac, Nampoori and Vallabhan1997) for graphite target and laser intensities of 20–90 GW/cm2, it has been shown that as laser intensity increases, plasma temperature, density, and inverse bremstrahlung absorption in the plasma increases and finally saturates at higher laser intensities. The same results are reported in (Akram et al., Reference Akram, Bashir, Hayat, Mahmood, Ahmad and Khaleeq-U-Rahaman2014) for zinc target.
4.2. The effect of plasma shielding on S/B ratio
Both line emission and background continuous radiations are influenced by interacting laser intensity and the nature and pressure of ambient gas. Hence, the S/B ratio which is extremely important for LIBS applications is affected as well. Using the intensity of the most intense line of copper atomic lines, I p, and the mean value of background radiation, I b, the S/B ratio can be formulated by Eq. (17) (Farid et al., Reference Farid, Harilal, Ding and Hassanein2014):
 $$\displaystyle{S \over B} = \displaystyle{{I_{\rm p} - I_{\rm b}} \over {I_{\rm b}}}.$$
Figure 9 shows the behavior of three Cu atomic lines S/B ratio against laser intensities. As laser intensity increases, the value of S/B also grows to an optimum value at about 3.5 GW/cm2 and then reduces and finally saturates at higher laser intensity.
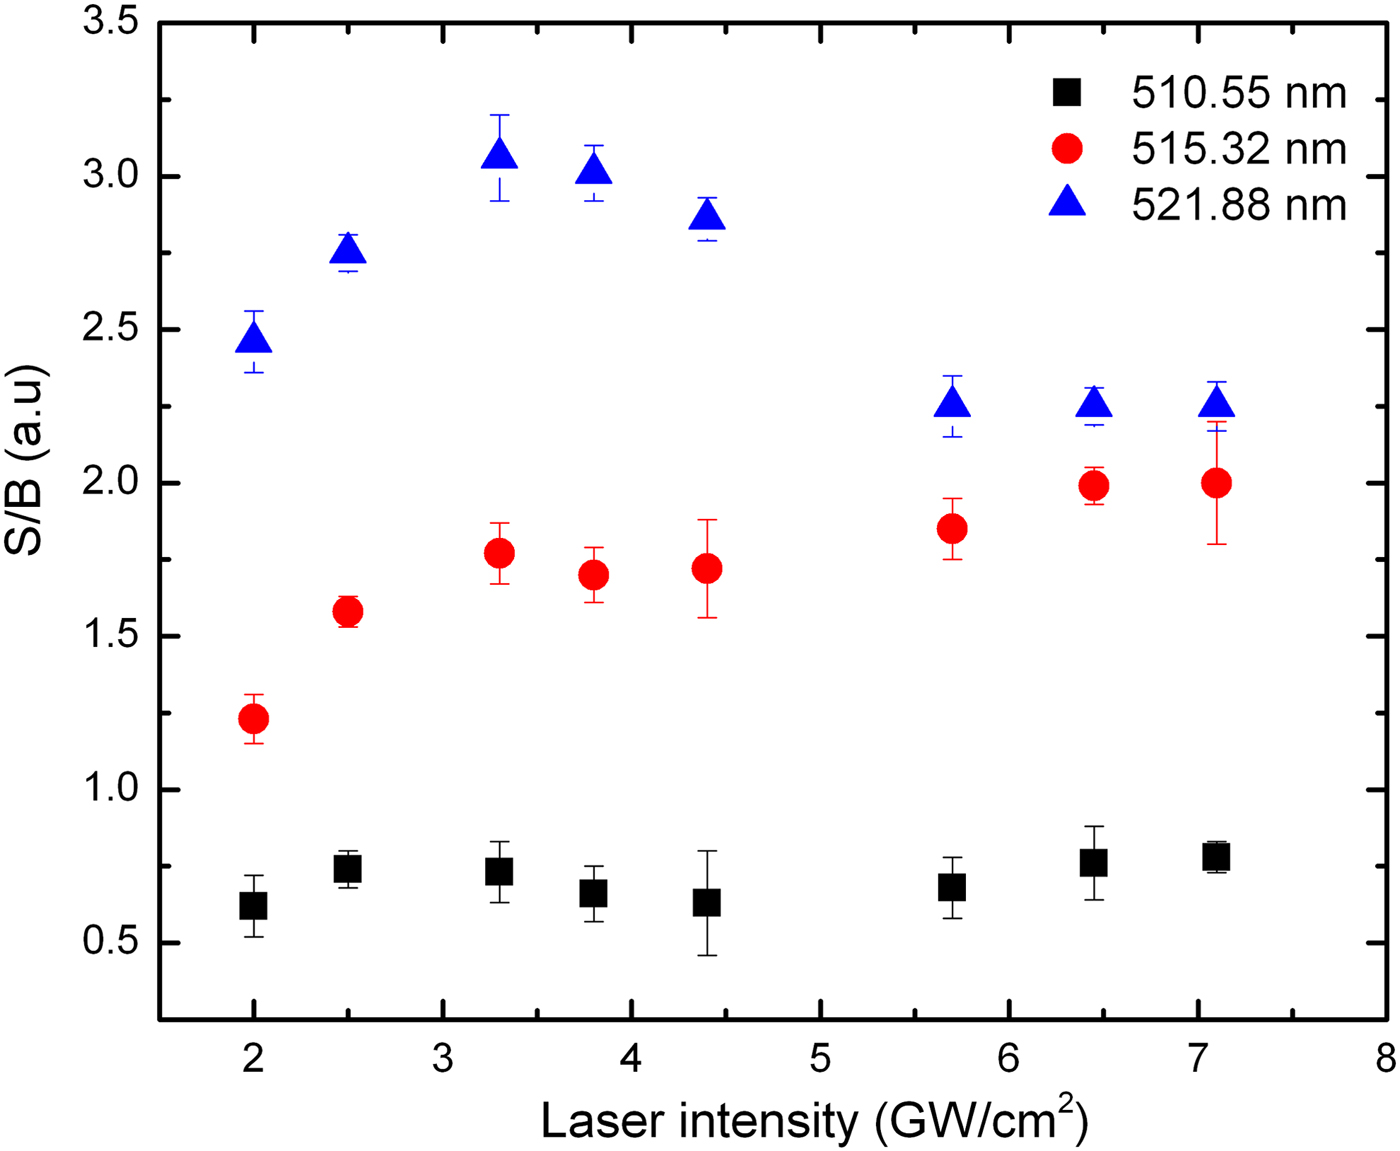
Fig. 9. S/B ratio against laser intensity for Cu atomic lines at 510.55, 515.32, and 521.88 nm at various laser intensities ranging from 2 to 7.1 GW/cm2.
Figure 10 also shows the behavior of S/B for Cu line at 521.82 nm for Ar, air, Ne, and He at various pressures ranging from 5 to 1000 mbar. He, Ne, air, and Ar show the best S/B, respectively, and also the best S/B is found for air, Ar, He, and Ne at 10, 5, 10, and 20 mbar pressures, respectively.
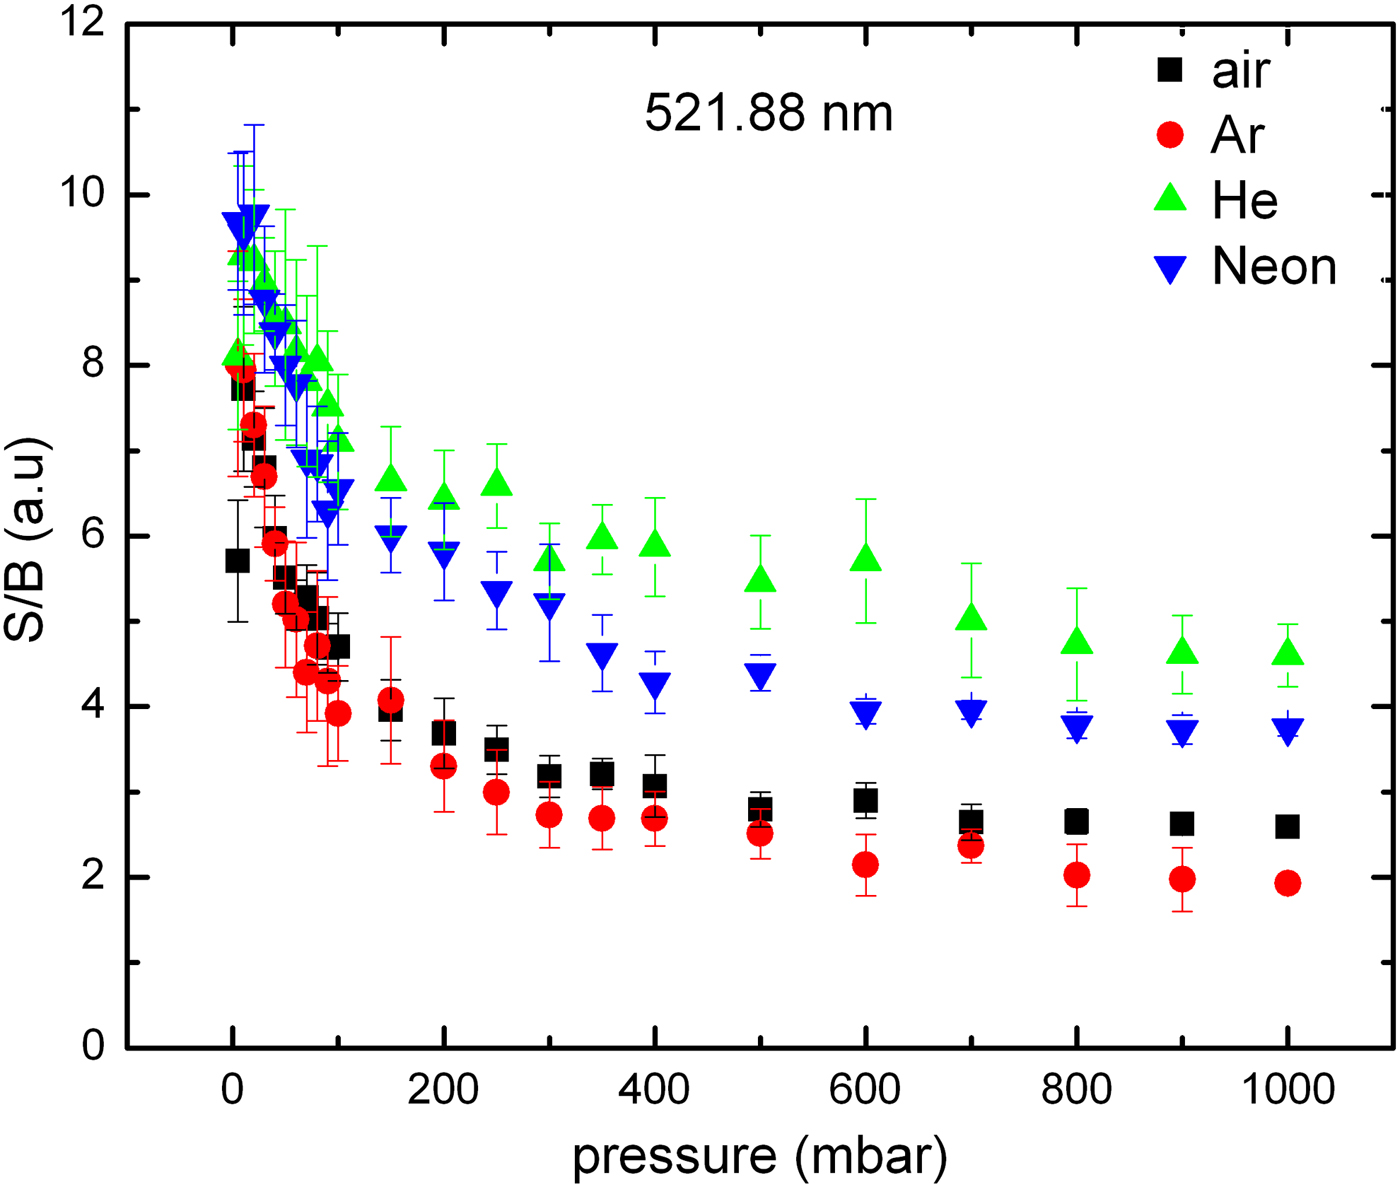
Fig. 10. S/B for Cu 521.82 nm line at various gases pressures ranging from 5 to 1000 mbar.
4.3. Hydrodynamic properties of plasma and the effect of plasma shielding on plasma plume velocity
The hydrodynamic equations for non-steady-state expansion of plasma plume are numerically solved in Lagrangian formulation using MULTI code. The temporal evolution of pressure, density, electron and ion temperature, and velocity of different layers of plasma at various laser intensities (0.5–10 GW/cm2) are calculated. Figure 11 shows the simulation domain of Cu ablation and ablated plasma expansion through ambient gas for 2 GW/cm2 laser intensity.
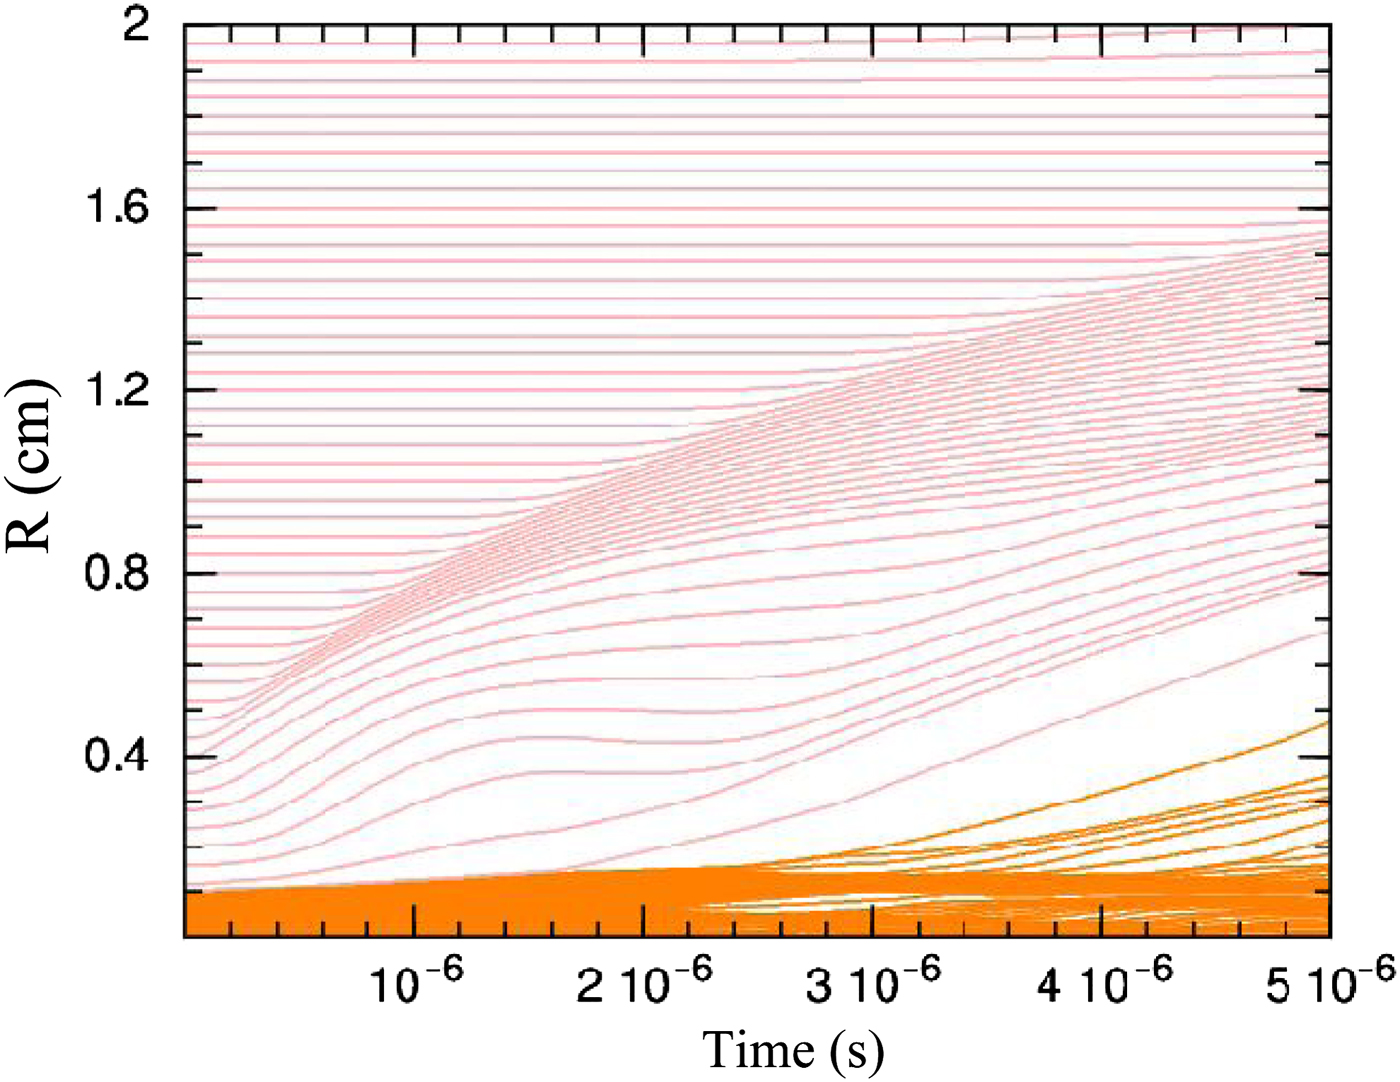
Fig. 11. Schematic of simulation domain of Cu ablation and ablated plasma expansion through ambient gas for 2 GW/cm2 laser intensity.
The orange color region in the lower part of Figure 11 shows the copper target position. The air gas that fills the simulation grid up to 2 cm is shown with pink color lines. As it is obvious, during laser irradiation on the target, ablation takes place and copper vapor pushes the ambient gas and induces an expanding shock wave in ambient gas. The dynamics of the expanding plasma changes rapidly in space and in time. According to Figure 12a the shock wave raises the air density to about three times the initial value (1.23 kg/cm3). As the shock wave expands, it compresses other layers of ambient gas and raises their density. At the onset times, the asymmetric jet-like expansion is very fast and a strong shock wave is formed. When the shock wave expands to further distances it weakens and the peak value of plasma density reduces. Also, the background gas slows down the plasma plume. At later times, the motion of plume front is significantly decelerated. The temporal evolution of plasma pressure at various distances from the target surface has been shown in Figure 12b. As an example the peak pressure of plasma is about 1 × 10⁸ dynes/cm2 at 2.4 mm and reduces with time and distance. As the shock wave expands, it compresses other layers of ambient gas and raises their pressure. According to Figure 12c, electron temperature is about 1 eV at about 2.4 mm and is about twice the ion temperature but they get closer at further distance and finally reach to the ambient temperature.
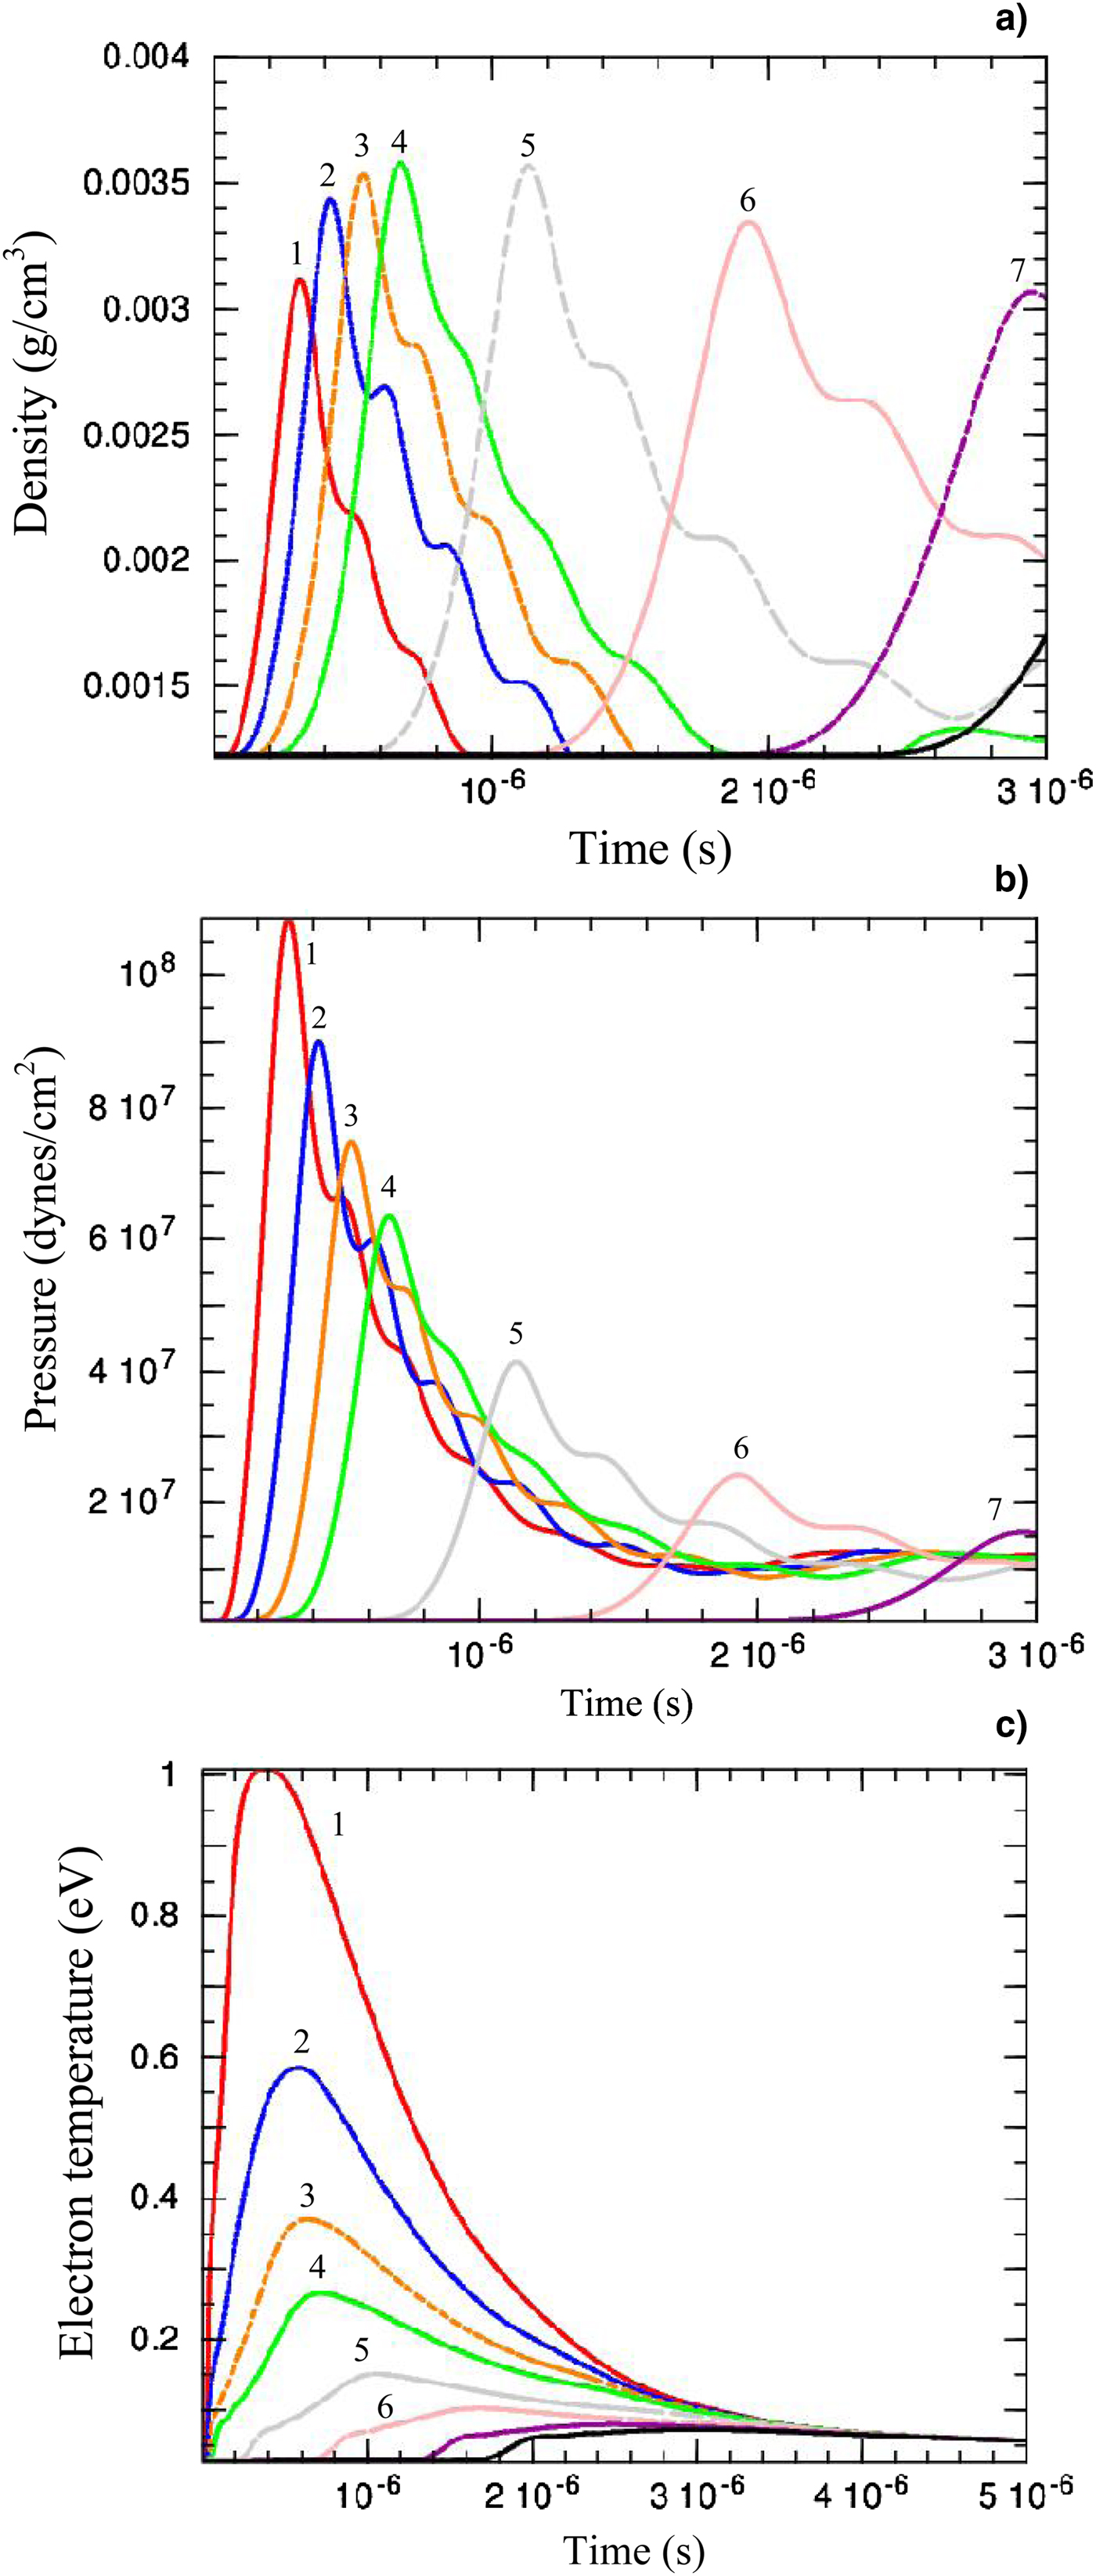
Fig. 12. Simulation results of temporal evolution of plasma (a) density, (b) total pressure, and (c) electron temperature at various distances from the target surface. 1, 2, 3, 4, 5, 6, and 7 numbers indicate the 2.4, 2.8, 3.2, 3.6, 4.8, 6.4, and 9 mm, respectively.
Plasma plume dynamics was also demonstrated in many studies using a 1D and 2D hydrodynamic model (Lee et al., Reference Lee, Kumar and Lee1998; Harilal et al., Reference Harilal, Miloshevsky, Diwakar, LaHaye and Hassanein2012 as examples).
Usually, the study of laser-induced plasma expansion and measurement of its velocity is technically complicated and expensive (Mihaila et al., Reference Mihaila, Ursu, Gegiuc and Popa2010; Gregorcic & Mozina, Reference Gregorcic and Mozina2011; Farahbod et al., Reference Farahbod, Afshari and Agayari2012; Freeman et al., Reference Freeman, Harilal, Diwakar, Verhoff and Hassanein2013). We have used a simple and effective method based on the absorption and scattering of a continuous He–Ne laser beam (probe) to determine the plasma front velocity (Azzeer et al., Reference Azzeer, Al-Dwayyan, Al-Salhi, Kamal and Harith1996; Elhassan et al., Reference Elhassan, Abd Elmoniem, Kassem and Hairth2010). Because of the continuous operation of the He–Ne laser, the rigorous task of synchronization between interacting laser and imaging apparatus is removed. Additionally, the expensive high-speed camera is simply replaced by a cheap fast photodiode. According to Figure 1 probe beam after pass above the target surface at various distances, enters into the fast avalanche photodiode. Arrival time of plasma plume to the certain distances above the target is recorded by using a combination of photodiode and a digital oscilloscope as an obvious drop in probe signal intensity in the oscilloscope. The probe beam is fixed at 2 mm from the target surface. The experimental and simulation results of plasma plume velocity at 2 mm distance from target in 1000 mbar air and at various laser intensities is depicted in Figure 13.
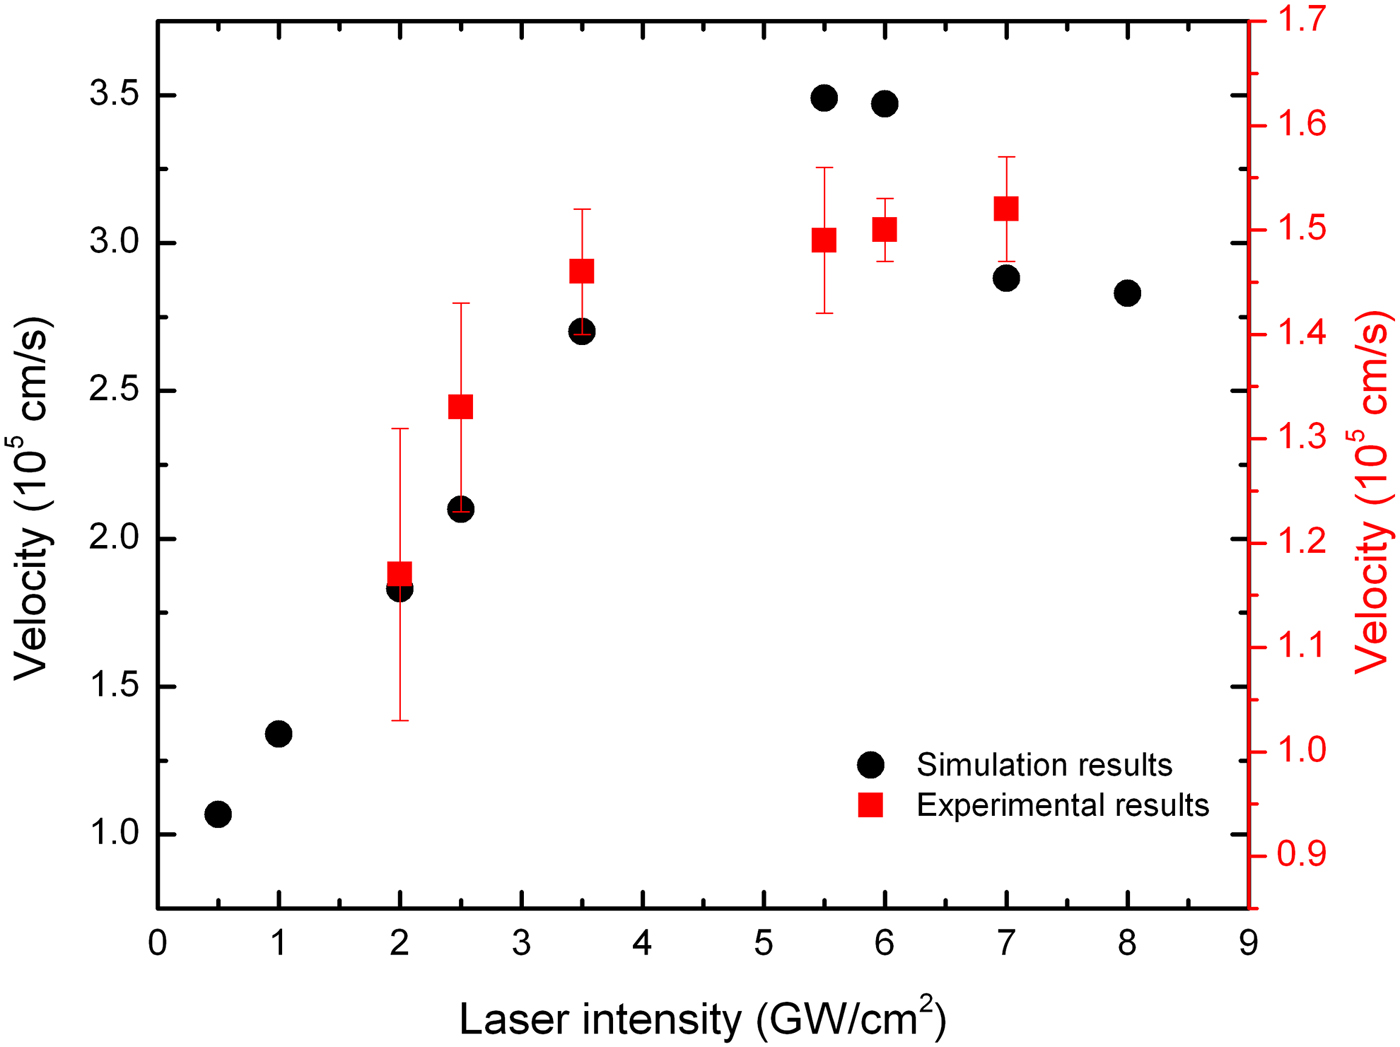
Fig. 13. Simulation and experimental values of plasma plume expansion velocity at the distance 2 mm from the target surface at various laser intensities.
Experimental results show that increasing the laser intensity to about 3.5 GW/cm2 results in a noticeable increase in plume velocity but subsequently it saturates due to formation of plasma shielding and reduction in effective laser target interaction at higher intensities. At lower intensities, increasing the interaction laser intensity increases internal and kinetic energy of the plasma, which leads to an increase in expansion velocity. The measured plasma plume expansion velocity at 2 mm is of the order of 1.5 × 105 cm/s. The experimental findings are consistent with the results obtained by the shadowgraphy method reported in (Farahbod et al., Reference Farahbod, Afshari and Agayari2012). Simulation results also show that the plasma plume velocity increases with laser intensity and gets to the maximum value of 3.5 × 105 cm/s at about 5 GW/cm2 and then decelerates with laser intensity increment. As is evident, there is a about 2-fold difference between experimental and numerical results of expansion velocity but they show nearly the same increasing–saturation behavior. The difference can be due to different laser pulse shapes that are used in the simulations and experiments. We also used this technique to determine the influence of the nature of ambient gases (Ar, air, Ne, and He at 1000 mbar) on plasma plume velocity. The plasma ablation parameters were estimated by using the experimental data and the shock wave model [R s = ξ0(E s/ρ1)1/5 t 2/5]. ξ0 is a constant, which depends on the gas-specific heat constant ratio, E s is the ablation energy and ρ1 is the background gas density (Mahmood et al., Reference Mahmood, Rawat, Zakaullah, Lin, Tan, Springham and Lee2009). As an example the fitted plots for the results of experimental and shock wave model plume front edge position versus time at 1000 mbar Ne background gas pressures are given in Figure 14. It can be observed from the plot that the experimental results fit well with shock wave model. The experimental data in Figure 14 is used to obtain the estimated values of the laser ablation parameters.
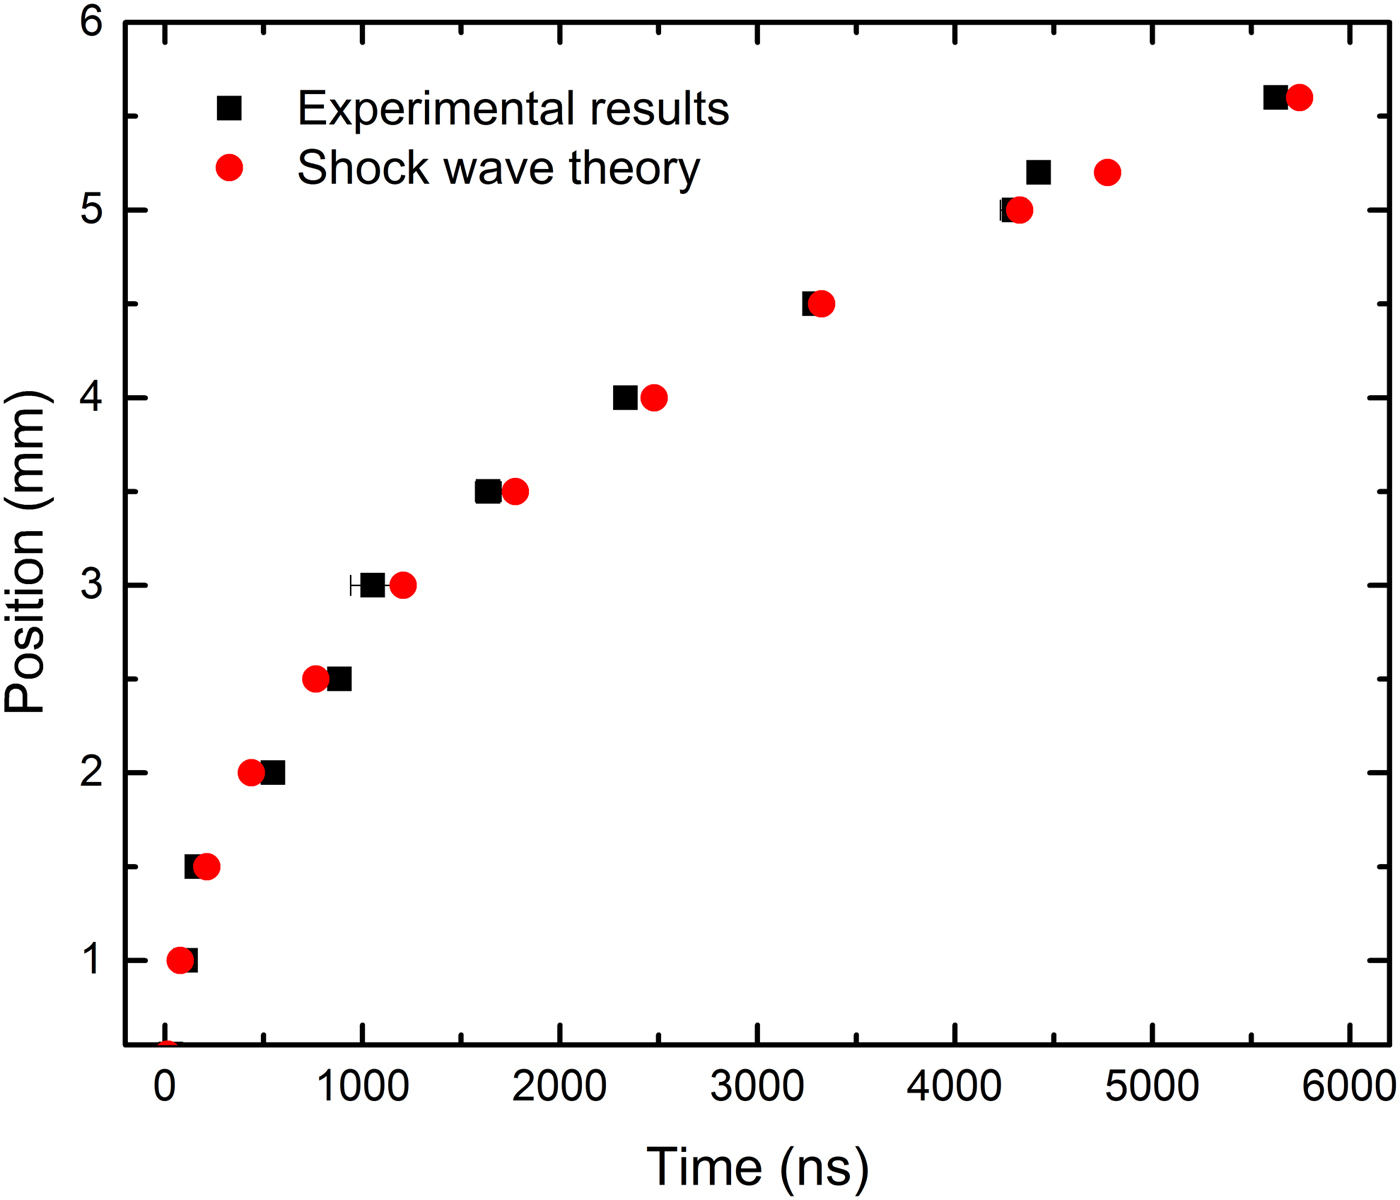
Fig. 14. Experimental and the shock wave model results of position versus time evolution plot of the front edge of the expanding Cu plasma plume at 1000 mbar ambient Ne gas pressure.
Plasma front edge velocity through Ar, air, Ne, and He at atmospheric pressure at various distances from the target surface ranging from 2 to 6 mm is depicted in Figure 15. The velocity through He and Ar has the highest and the lowest values, respectively, which according to Table 1 could be related to the lower atomic mass of He, Ne, Ar, and air respectively and so less confinements of plasma in He rather than others. The velocity through different gases has remarkable difference close to the target surface but they get closer at farther distances. The velocity at 2 mm from the target for He, Ne, air, and Ar are about 9 × 10⁵, 3.6 × 10⁵, 3 × 10⁵, 3 × 105 cm/s, and 2.5 × 10⁵, 1 × 10⁵, 0.7 × 10⁵, 0.7 × 10⁵ at about 6 mm from the target, respectively. The post-shock temperature and pressure of the shocked gas layer at various positions, calculated for 1000 mbar of ambient Ar, air, Ne, and He gas pressures using Eqs (7), (9), and (10), is shown in Figure 16a, 16b. The temperature at 2 mm is in the range of 0.4–0.7 eV for all ambient gases and has the lowest value in He that can be related to the generation of weaker shock waves in He because of its lower atomic mass and also its higher heat conduction (Table 1). The temperature reduces at farther distances and at 6 mm reaches to the twice of the ambient temperature because of energy loss through expansion, radiation, and heat conduction. The pressure at 1.5 mm is about 16 × 108, 13 × 108, 6 × 10⁸, and 2 × 10⁸ dynes/cm2 for Ar, air, Ne, and He respectively and drops off from the surface and finally reaches to about the ambient pressure at 6 mm.
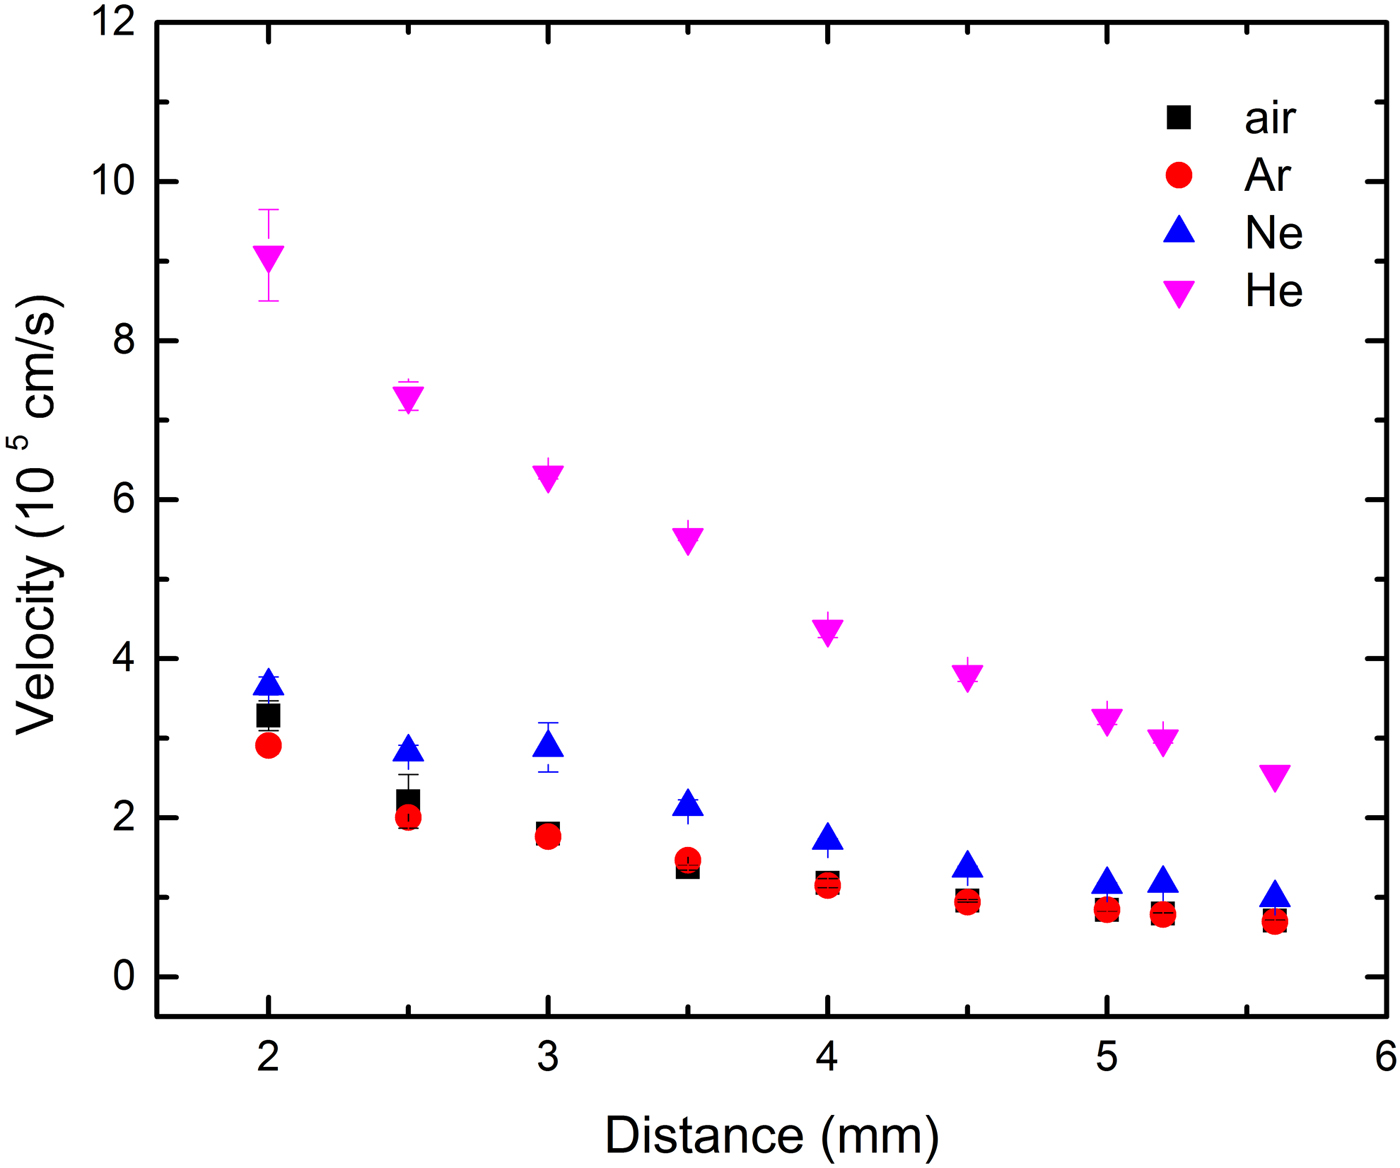
Fig. 15. Plasma front edge velocity at various distances from target in the presence of different ambient gases at 1000 mbar pressure.
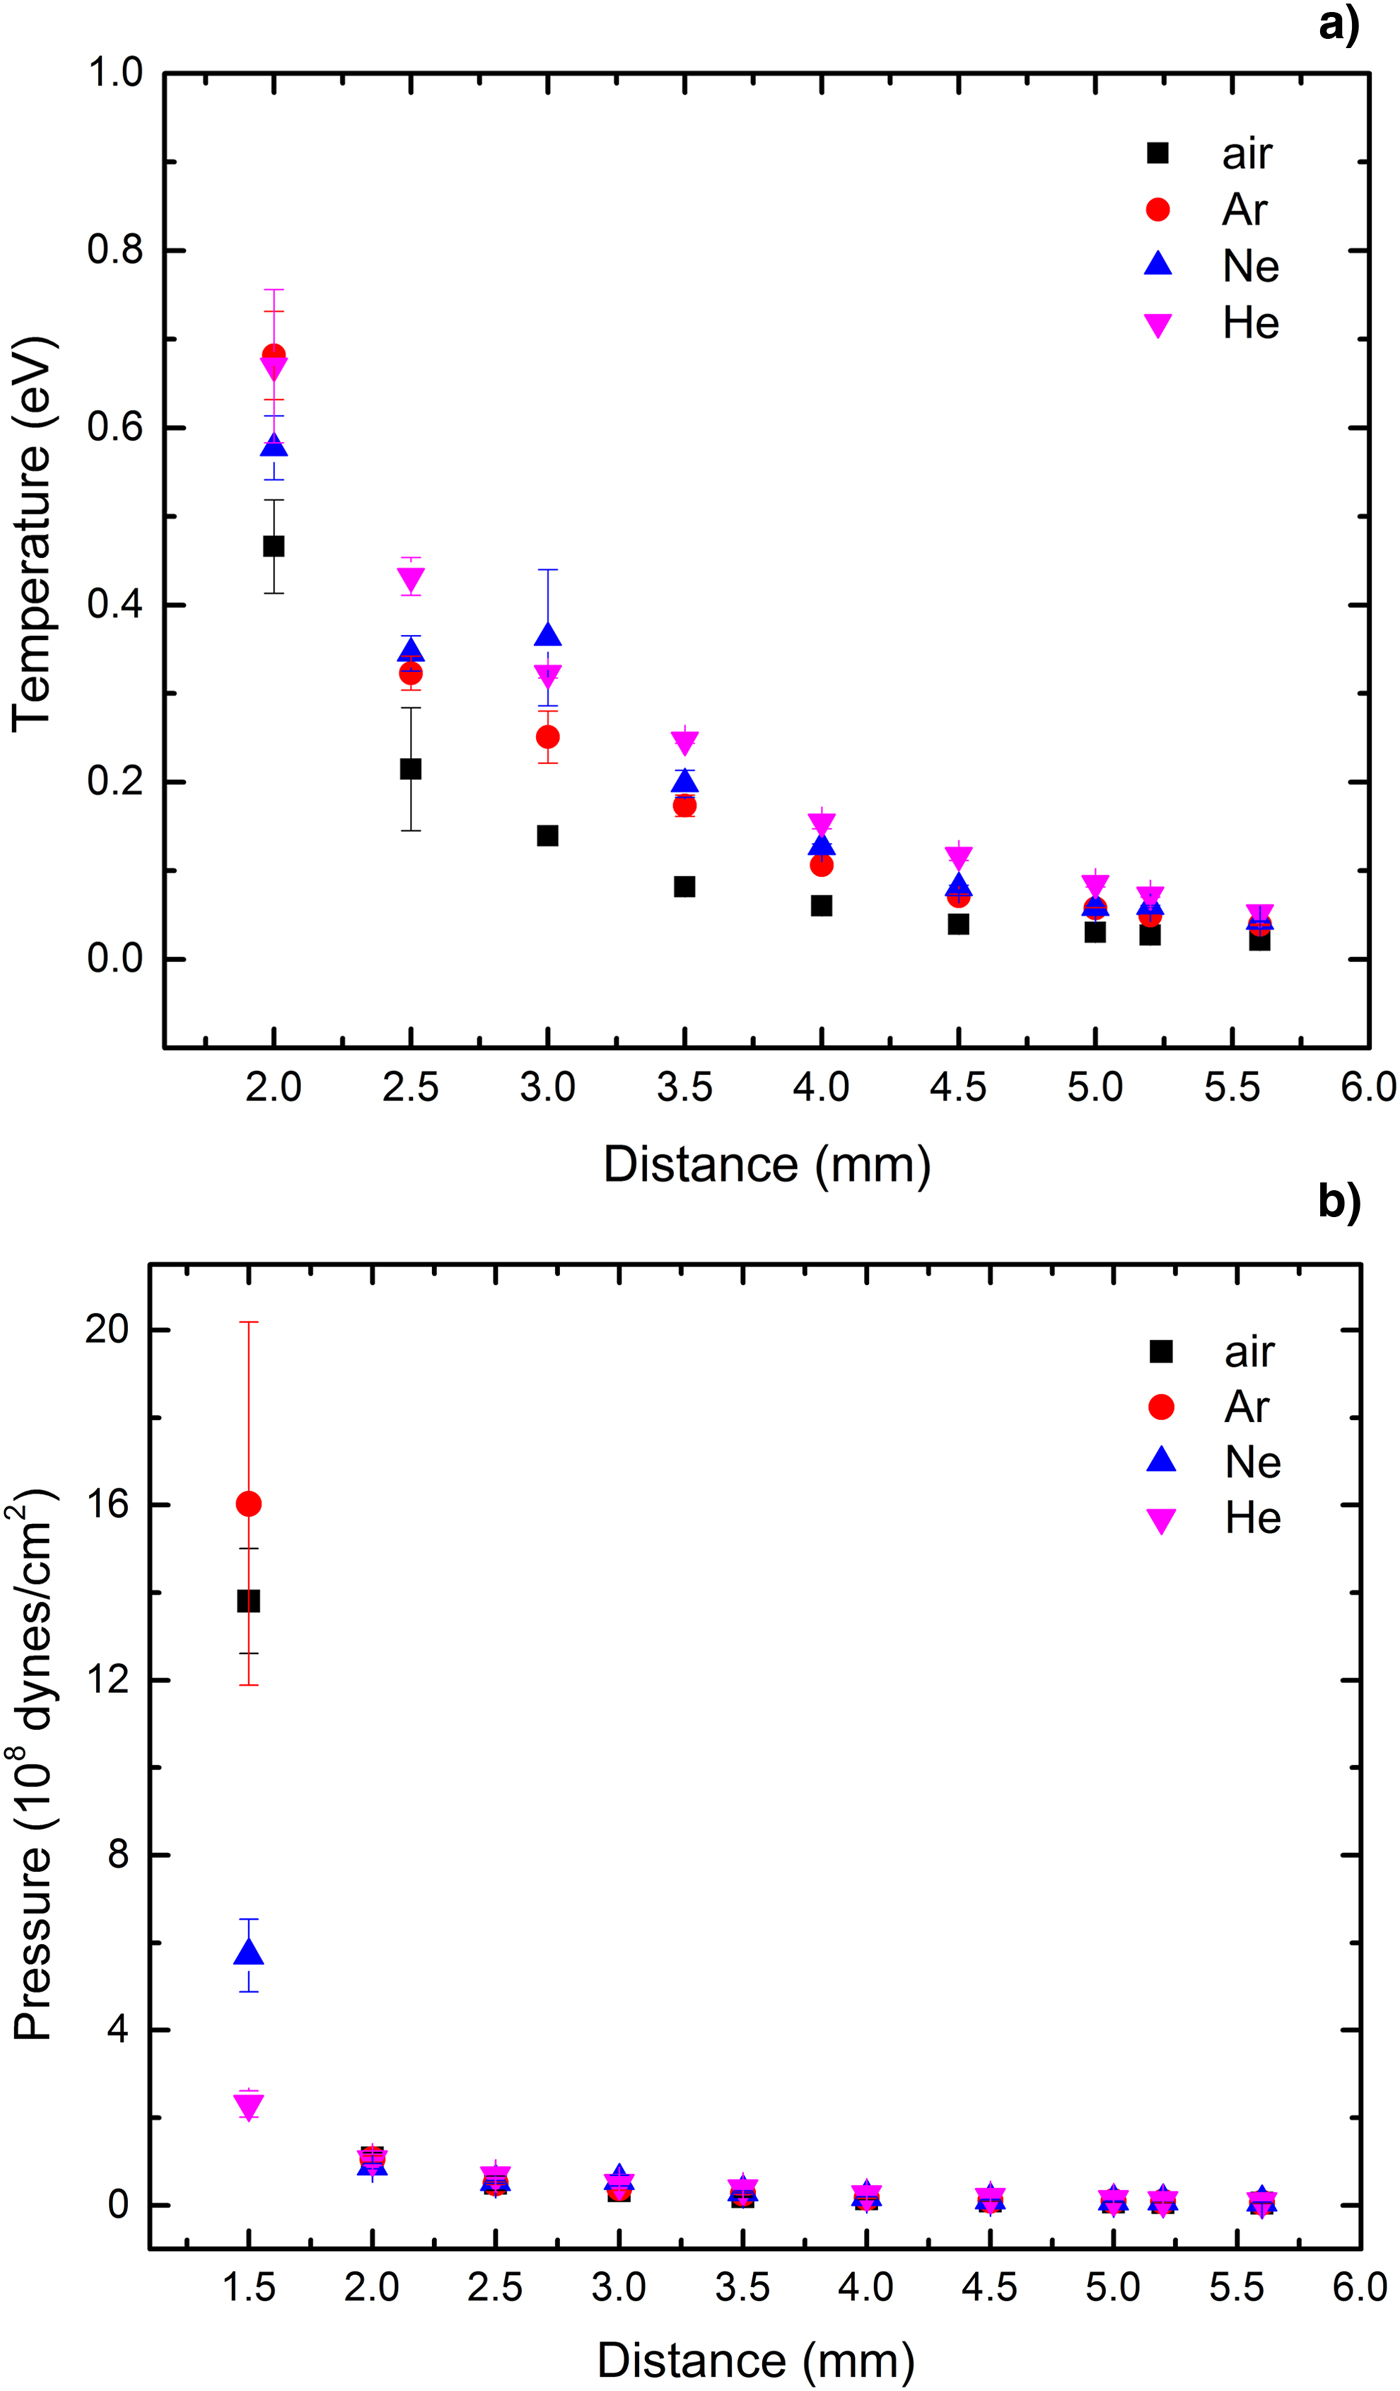
Fig. 16. (a) Temperature, (b) pressure, behind plasma front at various distances from target in the presence of different ambient gases at 1000 mbar pressure.
5. CONCLUSION
The influence of plasma shielding induced by laser intensity (ranging from 2 to 7.1 GW/cm2) and ambient Ar, He, Ne, and air gases at various pressures (ranging from 5 to 1000 mbar) on the behavior of radiations, S/B ratio, and expansion of Cu plasma produced by Nd:YAG laser has been studied experimentally and numerically. LIBS is used to study the plasma temperature and its line radiation and simple and effective probe beam absorption technique was used for determination of plasma shielding effect on plasma plume expansion velocity at various incident laser intensities and various ambient gas conditions. Plasma hydrodynamic characteristics were found from shock wave model and Rankine–Hugoniot jump conditions. The radiation hydrodynamic code, MULTI, was used for laser–metal interaction and expansion of plasma in air. Cu atomic lines radiation and volume expansion of the plasma plume are strongly dependent on the laser intensity, ambient gas condition, and so plasma shielding effect. As the laser intensity increases, the electron temperature, electron density, emission intensity of atomic lines, and plasma plume expansion velocity increases, but finally saturates because of plasma shielding effect. The optimum value of S/B ratio, which is important from experimental and spectroscopic points of view, found out at about 3.5 GW/cm2 laser intensity. Cu atomic line radiation has highest value in Ar, Ne, air, and He, respectively and has the maximum value at 70, 100, 40, and 30 mbar for Ar, air, Ne, and He. Electron temperature increases as pressure rises to about 100 mbar but then reduces and saturates at higher pressures. Also, raising the ambient gas pressure up to 200 mbar results the increasing of continuum radiation and subsequent saturation at higher pressures. He, Ne, air, and Ar show the best S/B, respectively and also the best S/B is found for air, Ar, He, and Ne at 10, 5, 10, and 20 mbar pressures, respectively.
Increasing the laser intensity up to about 3.5 GW/cm2 results in a noticeable increase in plume velocity, but subsequently it saturates at higher laser intensity due to formation of plasma shielding. The plasma ablation parameters were estimated by using experimental data and the shock wave model. The experimental results fit well with shock wave model. The velocity of shock wave through He and Ar has the highest and the lowest value, respectively. The velocity through different gases has remarkable difference close to the target surface, but they get closer at farther distances. The value of post-shocked temperature at distance 2 mm from the target surface is in the range of 0.4–0.7 eV for all ambient gases and has the lowest value for He. The pressure at 1.5 mm is about 16 × 108, 13 × 108, 6 × 10⁸, and 2 × 10⁸ dynes/cm2 for Ar, air, Ne, and He respectively and drops off from the surface and finally reaches nearly to the ambient pressure at 6 mm.
We have shown that the feature of plasma shielding effect observed in the experiments can be reproduced using a continuum hydrodynamics model, which provides valuable insight into the hydrodynamic properties of the plasma.
ACKNOWLEDGEMENT
The authors thank Prof. A.H. Farahbod for his comments and suggestions on improving the paper significantly.


