


NOMENCLATURE
- AIP
Aeronautical Information Publication
- ATCO
Air Traffic Controller
- AYT
Antalya Airport
- BADA
Base of Aircraft Data
- BFFM2
Boeing Fuel Flow Method 2
- BJV
Mugla Milas-Bodrum Airport
- CCO
Continuous Climb Operations
- EI
Emission Index
- ESB
Ankara Esenboga Airport
- FDR
Flight Data Recorder
- GNSS
Global Navigation Satellite System
- ICAO
International Civil Aviation Organization
- ILS
Instrument Landing System
- MRVA
Minimum Radar Vectoring Altitude
- RNAV
Area Navigation
- SAW:
Sabiha Gokcen Airport
- SID
Standard Instrument Departure
- SR
Specific Range
- STAR
Standard Instrument Arrival
- TMA
Terminal Manoeuvring Area
- TOC
Top of Climb
- TOD
Top of Descent
1.0 INTRODUCTION
Air transportation is one of the most popular methods for carrying passengers or cargo, but increasing air traffic results in much more fuel consumption and associated pollutant emissions. These air-traffic-related aviation emissions have negative environmental and health effects. Carbon dioxide (CO2) has a greenhouse effect and creates positive radiative forcing (warming) due to the sorption and re-radiation of thermal energy. Carbon monoxide (CO) alters the hydroxyl radical (OH) and ozone (O3) concentrations. Emissions of nitrogen oxides (NOx) affect the concentrations of ozone and result in net positive radiative forcing. The primary source for hydrocarbon (HC) emissions in aircraft engines is incomplete combustion and, therefore, their emissions factors are higher at low power settings(Reference Lee, Pitari, Grewe, Gierens, Penner, Petzold and Lachetti1,Reference Goodish2) .
In order to mitigate any negative environmental impact and minimise the operational cost for operators, technological improvements have been made to aircraft airframe and engine efficiency and the material used in aircraft construction(Reference Lee and Mo3). In addition to these technological improvements, another way to decrease fuel consumption and associated emissions is by lowering vertical profile inefficiency occurring in the arrival and departure phases of a flight. A vertical profile inefficiency is defined as a temporary level-off at low altitude before top of climb (TOC) for the departure phase and after top of descent (TOD) for the descent phase.
A typical flight basically consists of three main phases; namely climb, cruise and descent. In particular, in short-haul flights, fuel consumption in the climb and descent phases forms the greatest part of fuel consumed in a total flight. Therefore, in order to conduct fuel-efficient departure and arrival operations, aircraft should climb and descend with an optimum vertical profile. For departing aircraft, the optimum vertical profile is one with a continuous climb at optimum climb thrust and speed until an aircraft attains cruise flight altitude. For descending aircraft, it is one with a continuous descent at low-thrust setting and with minimum drag configuration that results in a reduction of fuel and emissions(Reference Lee and Mo3,4) . These operations with optimum vertical profiles are known as continuous climb operations (CCO) for departure operations and continuous descent operations (CDO) for arrival operations. An aircraft implementing CDO to descend from cruise altitude to a threshold with an uninterrupted profile has a configuration with engines set to low power. An aircraft implementing CCO to climb from take-off to cruise altitude, with a profile optimised to aircraft performance, has great potential to minimise the amount of fuel burned and pollutants emitted. Furthermore, the operations aiming at lower engine power during climb or descent also help to abate aircraft noise, which might be a major concern for those particularly living under the flightpath. While aircraft noise is beyond the scope of this study, it has been extensively studied elsewhere(Reference Clarke5-8).
There have been several studies which give information concerning the metrics and methodology used to evaluate the flight efficiency of arrival and departure operations(Reference Kettunen, Hustache, Fuller, Howell and Bonn9-Reference Peeters, Koelman, Koelle, Galaviz-Schomisch, Gulding and Meekma17). Dorfman et al(Reference Dorfman, Daily, Gonzalez and Kondo12) describe a methodology and identify metrics for the National Airspace System (NAS-Wide) vertical profile analysis. This methodology and metrics, such as geographic location, altitude and duration of level-off, level-off number according to aircraft category, were applied to arrival and departure traffic at Hartsfield-Jackson Atlanta Airport (ATL). Alcabin et al(Reference Alcabin, Schwab, Soncrant, Tong and Cheng11) propose a methodology developed by the Boeing Company to estimate NAS-wide excessive fuel burned due to vertical profile inefficiencies. In addition to the studies that state the methodology and metrics for vertical profile efficiency analysis and its applications, the economic and environmental benefits provided by implementing CCOs and CDOs in terminal area procedures have been investigated by several studies(Reference Sprong, Klein, Shiotsuki, Arrighi and Liu18-Reference McConnachie, Bonnefoy and Belle26). Shresta et al(Reference Shresta, Neskovic and Williams20) performed a study for Denver International Airport (DEN) by using radar track data and a Base of Aircraft Data (BADA) model. In this study, an unrestricted CDO scenario resulted in significant fuel and emissions savings, although the authors concluded that although some level-offs are inevitable, it is possible to provide fuel and emissions savings by executing descent operations with minimum level-offs. Clarke et al(Reference Clarke, Brooks, Nagle, Scacchioli, White and Liu24) designed and implemented a new flight procedure, the Optimum Profile Descent (OPD) at Los Angeles International Airport (LAX) which reported a reduction in noise, fuel and emissions for each flight.
When compared to CDO studies, there are few on CCO. In the study by Roach and Robinson(Reference Roach and Robinson25), the potential benefits of CCO were analysed and it was noted that if the level-offs at low-level altitude during climb had been performed at cruise altitude, 22 kg fuel saving would be achieved per flight. In another study, McConnachie et al(Reference McConnachie, Bonnefoy and Belle26) investigated vertical profile inefficiencies during climb in the NAS considering variables such as airports, aircraft category, operator, level-off duration and altitude. They found that if CCO operations had been executed instead of these level-offs during climb, the potential fuel savings from CCO would range between 6 and 16 kg per departure.
In this study, a vertical profile inefficiency analysis of arrival operations at three major airports, Ankara Esenboga Airport (ESB), Antalya Airport (AYT) and Mugla Milas-Bodrum Airport (BJV) in Turkey, is performed using in-real-time flight data recorded by flight data recorders (FDR). This FDR data was taken from one of the most frequently used narrow-body twin-engine commercial aircraft. The scope of the study consists of fuel, time and emissions (i.e., CO2, NOX, CO and HC) savings in the event of shifting low-level flight segments during descent to cruise altitude. In other words, the analyses looked at what the potential savings would be by implementing CDO procedures instead of descent operations with temporary level-offs. The main significance of this study is that the analyses were performed by using real flight data to better characterise the real-world condition The study, conducted using real-time flight data, may be a guide for authorities and operators in the identification of points of inefficiency in the arrivals operations of inspected airports. In addition, this study is the first research paper that has presented CDO performance statistics for three selected airports in Turkey. Another outcome of the paper is that area navigation (RNAV) and conventional procedures affect flight efficiency in terminal manoeuvring areas (TMA) for the three Turkish airports evaluated.
2.0 MATERIAL AND METHODOLOGY
In this part of study, the FDR database, GPSVISUALIZER used to visualise the flight path and EXCEL macro, which was used to filter the level-off segments of the FDR data, are described.
2.1 FDR database
The FDR system records many flight parameters almost every second. A typical record starts with departure from one airport's gate and ends with arrival at the destination airport's gate. FDR records held in a special database by operators were received in EXCEL format. The parameters recorded by FDRs include latitude, longitude, altitude, take-off runway, landing runway, temperature, aircraft speed, heading, fuel flow, flight path angle and so on. These parameters were used to calculate the fuel, time and emission savings and to filter the level-off segments. In order to systemise and expedite the calculation of savings and filtering operations, the EXCEL macro has been used.
2.2 GPSVISUALIZER
GPSVISUALIZER software is used to visualise the track of real flights using the latitude, longitude and altitude data of the aircraft. The software has the ability to read excel, text, and zip files, which makes it extremely easy to visualise the track of many flights in only a few minutes.
2.3 Methodology
Steps used for data collection and analyses of the vertical profile of arrival traffic to ESB, AYT and BJV airports are explained in detail below.
2.3.1 Airport selection and amount of data used
The scope of this paper includes an analysis of actual flights at three major airports ESB, AYT and BJV in Turkey. Because this study analyses domestic flights, these airports are selected from the ten busiest airports that have the busiest domestic flight operations according to the General Directorate of State Airports (DHMI) 2014 statistics(27). All of the flights inspected departed from Sabiha Gokcen Airport (SAW) during the months of July and August. The number of analysed flights landed at ESB, AYT and BJV airports are 138, 128 and 146, respectively.
2.3.2 Level-off detection algorithm and vertical profile analysis outputs
The level-off segments of arriving flights are found using FDR parameters of air/ground logic, flight phase, altitude, flight-path angle (FPA) and time. The flight phases are split into 14 parts in the FDR database. In this paper, the climb, cruise, descent and approach phases are handled and others are neglected due to the scope of the paper. In order to accept a level-off as a low-level flight segment, three parameters are defined and utilised in an EXCEL macro algorithm. These parameters are: maximum altitude threshold, instant altitude and FPA change threshold, and duration threshold. The maximum altitude threshold is that the level-off segment altitude during the descent phases and must be below 25,000 ft; otherwise, it is accepted as a cruise flight. This altitude constraint is determined with respect to an upper limit of the TMA of selected airports (i.e., ESB: 24,000 ft, AYT: 24,500 ft, BJV: 24,500 ft)(28). The instant altitude and FPA change threshold is the instant change of altitude in the range of ±10 ft or instant FPA change in the range of 0-0.35 degrees, and these segments are considered as level-off. The final condition, duration threshold, is the duration of the level-off segment. The duration threshold is only considered as a level-off if the duration is equal to or greater than 20 seconds. Durations shorter than 20 seconds are not accepted as a level-off. This duration is determined as a result of an FDR data examination. It can be seen that level-off segments shorter than 20 seconds, for instance in the descent phase, are inadequate for seeing a change in fuel flow rate with transition from descent to the level-off segment. Therefore, level-off segments longer than 20 seconds are taken into consideration for the statistical analysis of level-off segments.
In order to evaluate the vertical profile efficiency of arrival operations, certain useful metrics have been derived from studies in literature(Reference Dorfman, Daily, Gonzalez and Kondo12,Reference Dearmon, Mahashabde and Hogan15,Reference Roach and Robinson25,Reference McConnachie, Bonnefoy and Belle26) . These are defined below with short descriptions:
Amount of traffic with level-off: This shows the frequency of traffic including at least one level-off in arrival
Amount of level-offs in each altitude: This shows the amount of traffic in each altitude bin exposed to level-offs.
Time in level-offs: This shows the determined average duration of level-offs.
Distance in level-offs: This shows the determined average distance of level-offs.
Geographic location of level-offs: This is used to visualise and determine the position of level-offs
Amount of fuel and emissions: This is used to compare fuel consumption and emissions in level-offs to the fuel consumption and emissions in cruise for the same distance.
Specific Range (SR): SR is the distance an aircraft travels per unit of fuel consumed. This is used to determine the efficiency of a low-level flight and a cruise flight.
2.3.3 Potential time, fuel and emissions benefit analysis steps
Three possible ways to the mitigate level-off segments in arrival and departure operations are by reducing the distance and duration of level-offs, raising the altitude of level-offs, and completely eliminating level-offs(Reference Dorfman, Daily, Gonzalez and Kondo12). In this paper, the best scenario is considered and potential time, fuel and emissions savings, in the case of eliminating and replacing inefficient low-level flight segments with the cruise segment of equal distance, are calculated (Fig. 1). In other words, the potential benefits by conducting continuous descent procedures are calculated.
Figure 1. Comparison of actual flight profile and proposed continuous descend profile.
For the potential fuel, time and emissions savings analysis, in the case of shifting level-offs to cruise altitude, the lower limit of duration threshold is increased to 60 seconds and level-offs longer than 60 seconds are taken into consideration. Level-offs shorter than 60 seconds seem to have the potential to save fuel and time, but due to fluctuations in FDR fuel flow data, the lower limit is increased to 60 seconds for precise results. On the other hand, statistical results of level-offs that are longer than 20 seconds will provide information about the number of flights exposed to cut-offs which cause extra fuel consumption for climbing or descending aircraft. For this purpose, all of the level-off segments in arrival operations are detected and the duration, distance flown, fuel consumed and emissions in each of the temporary level-offs are calculated with reference to FDR records. The calculated distance in each one of the temporary level-offs is then shifted to its own cruise conditions and in answer to the question of what the time, fuel and emissions would be if the temporary level-offs distance is conducted in cruise phase is investigated and compared with the low-level flight segments’ results.
2.3.4 Emissions calculation method
In this paper, 412 flights by 24 aircraft of the same type are analysed. All of the aircraft had CFM56-7B series engines and sixteen were flown with CFM56-7B26E engines. Therefore, the CFM56-7B26E engine is the reference for our emissions calculation. In order to calculate total emissions during a flight segment, the emissions index (EI), defined as the amount of emissions released per unit of fuel, must be calculated for CO2, CO, HC and NOX. Because the emissions of CO2 is directly related to fuel burned, EI (CO2) = 3.156 g/kg is accepted in the literature(Reference Schaefer29-Reference Masiol and Harrison31). Unlike CO2 emissions, CO, HC and NOX emissions indexes are strong functions of engine power. In the International Civil Aviation Organization (ICAO) emissions database, fuel flow rates and emissions indices under the International Standard Atmosphere (ISA) conditions at sea level are given by the engine model for the following flight phases; take-off, climb, approach, and idle. Because the given EIs in the ICAO emissions data bank cannot be used directly to calculate emissions at any altitude, the EIs of CO, HC and NOX in the ICAO databank are calibrated by altitude and ambient conditions using the Boeing Fuel Flow Method 2 (BFFM2)(Reference Dubois and Paynter32).
In order to calculate EIs using BFFM2, the first step is to apply a correction factor to the fuel flow values of CFM56-7B26E given in the ICAO databank. These correction factors are due to the installation effect and 1.01 for take-off, 1.013 for climb, 1.02 for approach and 1.1 for taxi(Reference Dubois and Paynter32). The fuel flow values for the CFM56-7B26E engine given in the ICAO data bank(36) and the adjusted fuel flow values are outlined above in Table 1.
Table 1 ICAO landing and take-off emissions indices for CFM56-7B26E
In order to make a correlation between fuel flow and the EIs of CO, HC and NOX, intermediate values are found using linear interpolation method(Reference Kendal33) and equations and graphs created are shown in Fig. 2 using EXCEL's property of regression equation and the curve fitting method.
Figure 2. Fuel flow versus emissions indexes and their regression equations.
In order to calculate EIs at any flight altitude using BFFM2, the remaining steps given in Reference Dubois and PaynterRef. 32 are applied and the total emission (X) released in a temporary level-off or in a flight phase is calculated using Equation (1)(Reference Masiol and Harrison31):
 $$\begin{equation}
{\rm{Emission}}(X) = {E_n} \cdot {\it EI(X)} \cdot {\it TIM} \cdot FF,
\end{equation}$$
$$\begin{equation}
{\rm{Emission}}(X) = {E_n} \cdot {\it EI(X)} \cdot {\it TIM} \cdot FF,
\end{equation}$$
where EI(X) denotes the emissions index for pollutant X, and En, TIM and FF represent the number of engines, time in mode (in seconds) and fuel flow (in kg/s), respectively.
3.0 RESULTS AND DISCUSSION
Analyses are executed according to the aforementioned metrics given in part of ‘the level-off detection algorithm and vertical profile analysis outputs’ to measure vertical profile efficiency and potential time, fuel and emissions savings in the case of shifting level-off to cruise level calculated for arrival operations to selected airports. The characterisation of level-off segments and the benefit analysis results are reported below for each airport in a separate section. The results are given in a separate section for each airport because each airport has specific arrival and departure procedures. Esenboga approach centre applies the radar vectoring technique for all arrival and departure traffic. Hence the inspected arrival flight routes to ESB have a dispersed plan view. AYT has RNAV (GNSS) STAR and RNAV (GNSS) SID charts and routes drawn by GPSVISUALIZER that mostly overlap with RNAV routes on charts. On the other hand, BJV has RNAV (GNSS) STAR and RNAV (GNSS) SID charts, but routes drawn by GPSVISUALIZER do not generally overlap with RNAV routes on charts and, it is understood from the analyses, that radar vectoring techniques are generally applied for arrival and departure traffic under Minimum Radar Vectoring Altitude (MRVA) conditions.
3.1 ESB results
For ESB arrivals, 138 arrivals from SAW airport to ESB airport were analysed and it was found that 95 flights were exposed to at least one level-off during the descent phase. Statistical results of level-offs, such as the frequency of level-offs at each altitude bin, average duration of level-offs and distribution of level-offs in ESB arrival flights were marked via GPSVISUALIZER using latitude, longitude and altitude are shown in Fig. 3.

Figure 3. Visualisation and statistical analysis of level-off segments in the descent phase of arrivals at ESB airport.
ESB airport is located in Ankara and has two parallel runways in configuration of 03R/21L and 03L/21R. It can be seen from Fig. 3(a) that the arrival paths of flights do not conform and that the majority of them landed at runway 03L/R. A possible reason for the lack of conformity of the flight paths is related to the radar vectoring technique applied by air traffic controllers (ATCOs) for arrival and departure operations in ESB. When we look at the location of the level-offs, they mostly occurred in the range of 10 to 20 NM from threshold while turning for final approach to capture the Instrument Landing System (ILS). In Fig. 3(b) and (c) the level-offs distribution for each flight level and average level-off durations are shown. As can be seen from Fig. 3(b), 60% of the level-off segments took place within the range of 6,000 ft to 8,000 ft while turning for final approach and this part makes up the greater portion of the 5_10 altitude bin that has an average duration of 73 s. In the 5_10 altitude bin, level-offs that have longer durations than average are due to irregular flight tracks turning to runway course and flown at low altitudes to capture ILS. Another significant level-off segment took place around 13,000 ft and has an average duration of 110 s. These level-offs are probably due to the AKINCI military airspace restriction published in the Turkish Aeronautical Information Publication (AIP). The results of analyses show that aircraft levelled off at 13,000 ft while passing over AKINCI military airspace although the MRVA published in the AIP permits flight at a minimum 9,000 ft.
The potential time, fuel and emissions savings analysis of level-off segments of the arrival traffic at ESB airport were analysed for level-offs of longer than 60 seconds. This lower limit was used to achieve more precise results. After filtering the level-offs shorter than 60 seconds, the level-off segments decreased by 51% in total and 64 level-off segments longer than 60s were examined. The potential fuel and time savings in the case of an aircraft shifting level-offs to cruise altitude of its own flight are shown in Fig. 4.
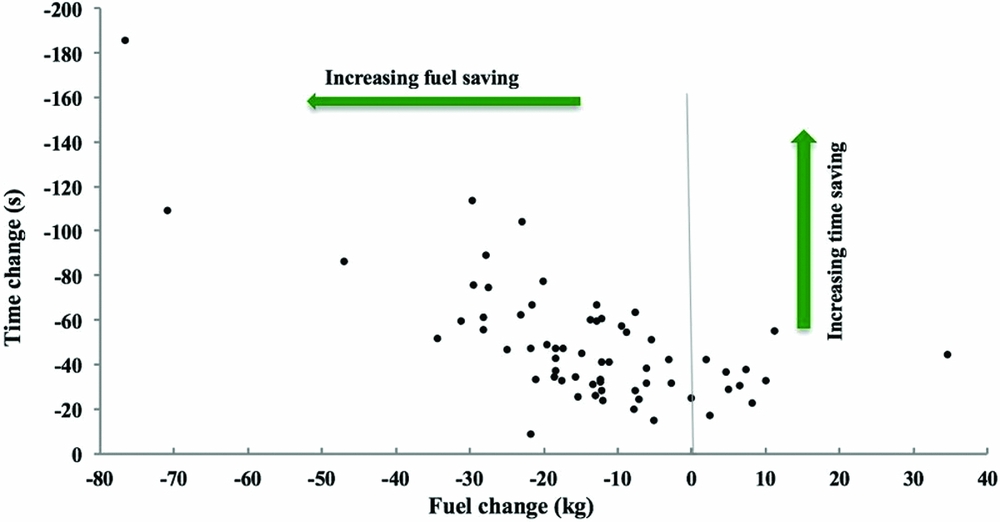
Figure 4. Time and fuel saving in the case of replacing low-level flight segments with cruise segment of equal distance.
As can be seen from Fig. 4, shifting low level flight segments to higher altitudes provides time saving for each level-off and, when putting the outliers out of the calculation, an average of 45 s time saving per level-off is achieved. However, fuel savings for each level-off could not be provided even though 10 of 64 level-offs resulted in extra fuel burned. In order to understand the reasons for this unexpected case, the SR values, aircraft masses and fuel flow changes in both the level-off segment and the cruise phase were analysed in detail. It was noted that possible causes were lower aircraft masses in the descent phase than in the cruise phase and unchanged fuel flow values during transition from descent to level flight. Although fuel savings for each individual level-off could not be provided, an average saving of 17 kg for each level-off is computed when disregarding outliers
Because the amount of CO2 emissions released is found by applying a coefficient to fuel consumed, potential CO2 emission savings are found by directly multiplying the average fuel saving by coefficients of 3.156 for CO2. The average CO2 saving was calculated as 54 kg per level-off. In contrast to CO2 emissions, CO, HC and NOX emissions savings showed a different response to shifting level-offs to higher altitudes. The results are shown in Fig. 5.
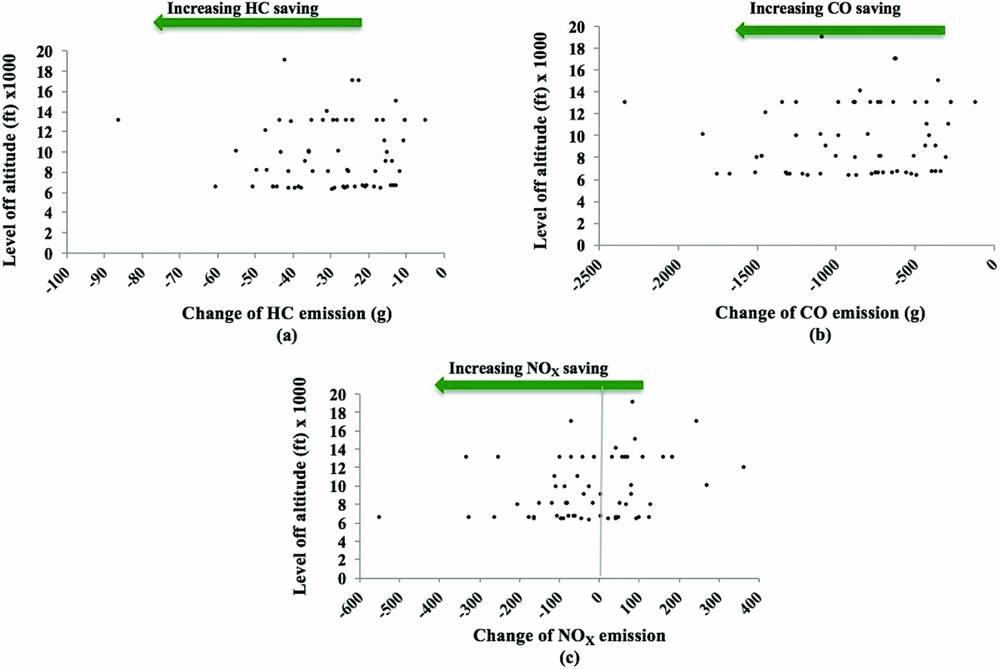
Figure 5. Emissions saving of CO, HC and NOX in the case of replacing low-level flight segments with cruise segments of equal distance.
CO and HC emissions have higher EI coefficients under low combustion efficiency and low thrust settings(Reference Rudey and Kempke34,35) . Because aircraft have higher combustion efficiency during cruise flight due to high thrust settings, CO and HC emissions indexes are lower. Results for CO and HC emissions in Fig. 5(a) and (b) support this thesis. Emissions saving were achieved for each level-off with an average of 865 g CO and 29 g HC per level-off. NOX emissions saving showed a completely different response. In contrast to HC and CO, the NOX emissions index is highest at higher thrust settings due to higher combustion temperatures(Reference Rudey and Kempke34). Hence, in a cruise flight, the thrust setting of an aircraft is higher and, as a result the NOX emissions index is higher. Furthermore, the fuel flow rate in a cruise flight is higher than low-level flight due to higher thrust settings and the higher speed of the aircraft. In conclusion, when all conditions are considered together, it can be seen from Fig. 5(c) that average NOX emissions changed between −120 g and +120 g for each level-off. This means that for some level-off segments a reduction in the duration of level-off, when shifting to cruise level, did not compensate for the increase in the emissions index and fuel flow rate for certain level-offs and resulted in additional NOX emissions.
3.2 AYT results
For AYT arrivals, 128 arrivals from SAW airport were analysed and it was found that 95 sample arrival flights were exposed to at least one level-off during the descent phase. Statistical results of level-offs, such as the frequency of level-offs at each altitude bin, average duration of level-offs and distribution of level-offs in ESB arrival flights were marked via GPSVISUALIZER using latitude, longitude and altitude are shown in Fig. 6.

Figure 6. Visualisation and statistical analysis of level-off segments in the descent phase of arrivals at AYT airport.
AYT airport, located in Antalya, has three parallel runways in configurations of 18L/36R, 18C/36C and 18R/36L. There are no arrivals to runway 18R/36L because it is not available for civil use as it is only open for military aircraft operations. Contrary to ESB arrival traffic paths, the AYT arrival paths of flights that landed at 18L/36R or 18C/36C have conformance. This is the result of RNAV (GNSS) STAR applied for AYT arrival traffic. AYT airport is busy with traffic and aircraft generally follow the prescribed standard arrival routes unless ATCOs give shortcut instructions in the case of low-density air traffic. Open STAR, where aircraft maintain a current heading up to the instructions from ATCOs for turning to final approach, is used at AYT airport.
It can be seen from Fig. 6(a) that the majority of level-offs occurred on the arrival path of runways 36C and 36R. When we look at the location of the level-offs, they mostly occurred within the range of 5 to 20 NM from threshold. The level-offs that are closer to the threshold occurred after turning for final approach to capture the ILS. On the other hand, distant level-offs occurred on downwind while waiting for clearance from ATCOs for final approach. In Fig. 6(b) and (c), level-off distribution for each flight level and average level-off durations are shown. As can be seen from Fig. 6(b), 39% of level-off segments took place within the range of 1,500 ft to 2,000 ft while turning for final approach and 25% of level-off segments took place within the range of 3,000 ft to 4,000 ft on downwind waiting for final approach clearance. Aircraft that were exposed to a level-off during the downwind leg had to fly above 3,000 ft due to noise reduction procedures applied to AYT arrivals. The total level-offs in 0_5 altitude formed 64% of total level-offs and have an average duration of 90 s. In the 0_5 altitude bin, the difference between upper quartile and maximum is greater due to higher level-off durations on the downwind leg. The level-offs that occurred in 5_10 and 10_15 altitude bins are generally on the flight paths that are out of the standard arrival routes though it is difficult to comment with any certainty.
Potential time, fuel and emissions saving analyses of level-off segments for arrival traffic to AYT airport were analysed for level-offs longer than 60 s. After filtering the level-offs shorter than 60 s, the level-off segments decreased by 51% in total and 71 level-off segments lasting longer than 60 s were examined. Potential fuel and time savings in the case of an aircraft shifting level-offs to cruise altitude are shown in Fig. 7.
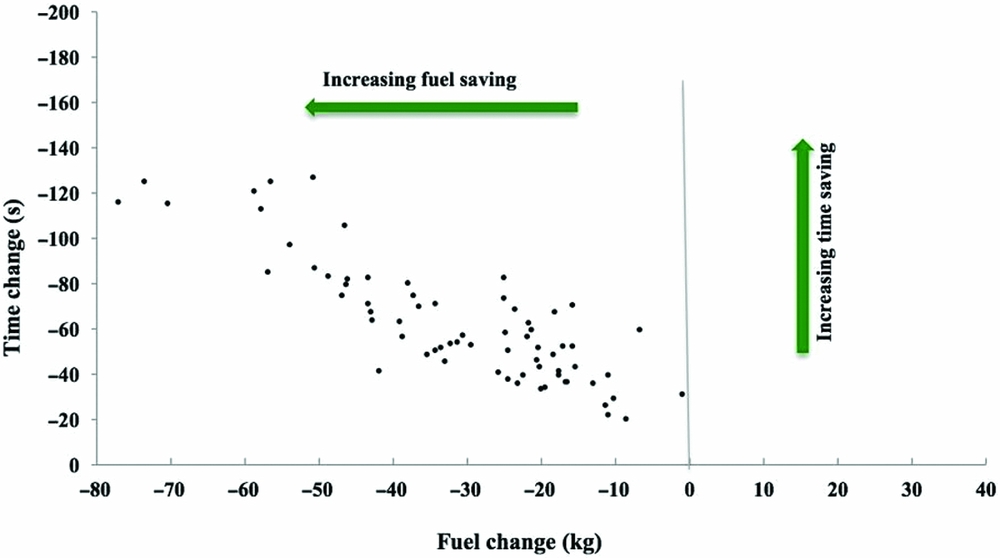
Figure 7. Time and fuel savings in the case of replacing low-level flight segments with cruise segments of equal distance.
As can be seen from Fig. 7, shifting low-level flight segments to higher altitudes provided time and fuel savings for each level-off and, when taking the outliers out of the calculation, an average of 65 s and 33 kg fuel savings per level-off was achieved. Multiplying the average fuel saving by coefficients of 3.156 for CO2, the average CO2 savings were calculated as 105 kg for each level-off.
CO, HC, NOX emissions distribution showed similar behaviour with ESB results. Because CO and HC have higher combustion efficiency in cruise flight due to high thrust settings, CO and HC emissions indexes are lower(Reference Rudey and Kempke34,35) . The results for CO and HC emissions in Fig. 8(a) and (b) support this thesis. Emissions savings were achieved for each of the level-offs and at an average saving of 240 g CO and 11 g HC per level-off. NOX emissions savings showed a completely different response. In contrast to HC and CO, the NOX emissions index showed negative changes for some level-offs and the average NOX emissions varied between -101 g and +74 g for per level-off.
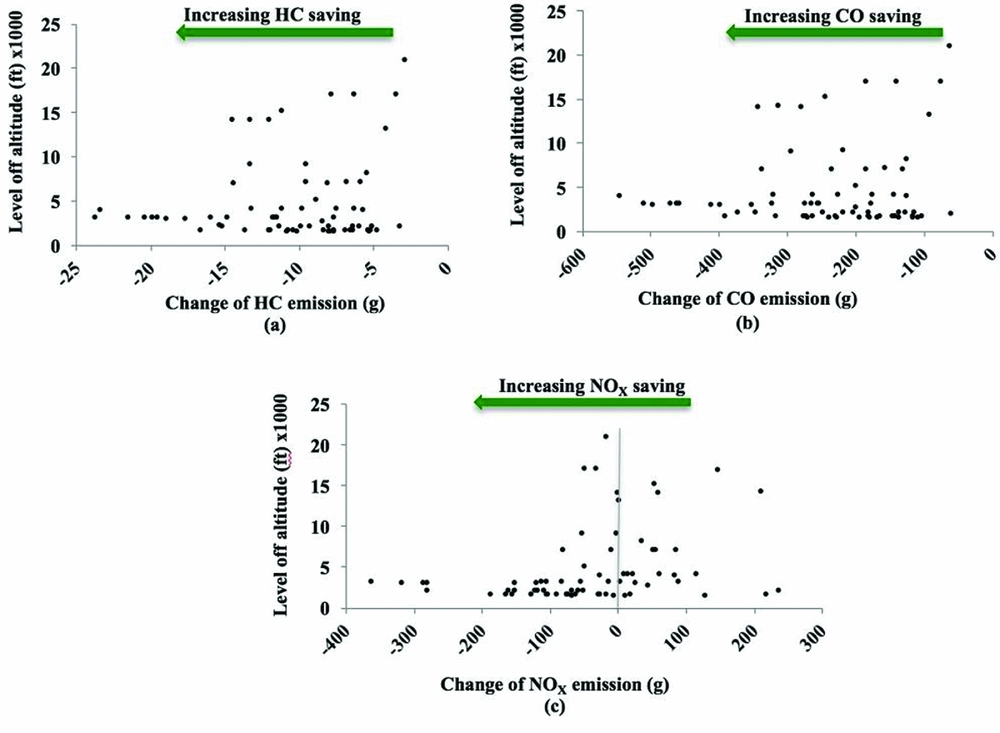
Figure 8. Emissions savings of CO, HC and NOX in the case of shifting low-level flight segments to cruise segments of equal distance.
3.3 BJV results
For BJV arrivals, 146 arrivals from SAW airport were analysed and it was found that 117 flights were exposed to at least one level-off during the descent phase. Statistical results of level-offs, such as the frequency of level-offs at each altitude bin, average duration of level-offs and distribution of level-offs in BJV arrival flights were marked via GPSVISUALIZER using latitude, longitude and altitude are shown in Fig. 9.

Figure 9. Visualisation and statistical analysis of level-off segments in the descent phase of arrivals at BJV airport.
BJV airport is located in Mugla and has a runway in the configuration of 10/28. In contrast to the open STAR applied for AYT arrivals, there is a closed RNAV (GNSS) STAR for arrival traffic at BJV airport. Closed STAR differs from open STAR where aircraft fly up to the Final Approach Point (FAP) and do not wait for a final approach turning clearance from ATCOs. Arrival traffic that landed on runway 10 have a conformance with the RNAV arrival path, but the RNAV STAR route altitude requirements were not provided. The altitudes of level-off segments that mostly occurred during turns to final approach on the runway 10 arrival path overlap with the MRVA altitudes. Contrary to the runway 10 arrival paths, arrival paths to runway 28 do not overlap with the RNAV STAR routes and altitude limitations. They have a dispersed plan view and their altitudes showed conformance with the MRVA limitations. This condition shows that, generally, a radar-vectoring technique is applied to arrival traffic at BJV airport under MRVA limitations although closed RNAV (GNSS) STAR are available for both runway configurations. This is probably the result of a lower density of air traffic. In conditions of low air traffic, ATCOs prefer to give shortcuts to fixes in order to provide time and fuel savings. In conclusion, level-off segments were concentrated at around 6,000 ft and made up 82% of total low-level flight segments. Most of the level-off segments were in the 5_10 altitude bin, with an average 110 s and took place 5 to 35 NM from runway threshold during turns to final approach course.
Potential time, fuel and emissions saving analyses of level-off segments of arrival traffic at BJV airport were analysed for level-offs longer than 60 s. After filtering the level-offs shorter than 60 s, the level-off segments decreased by 26% in total and 108 level-off segments longer than 60 s were examined. Potential fuel and time savings in the case of an aircraft shifting level-offs to cruise altitude are shown in Fig. 10.
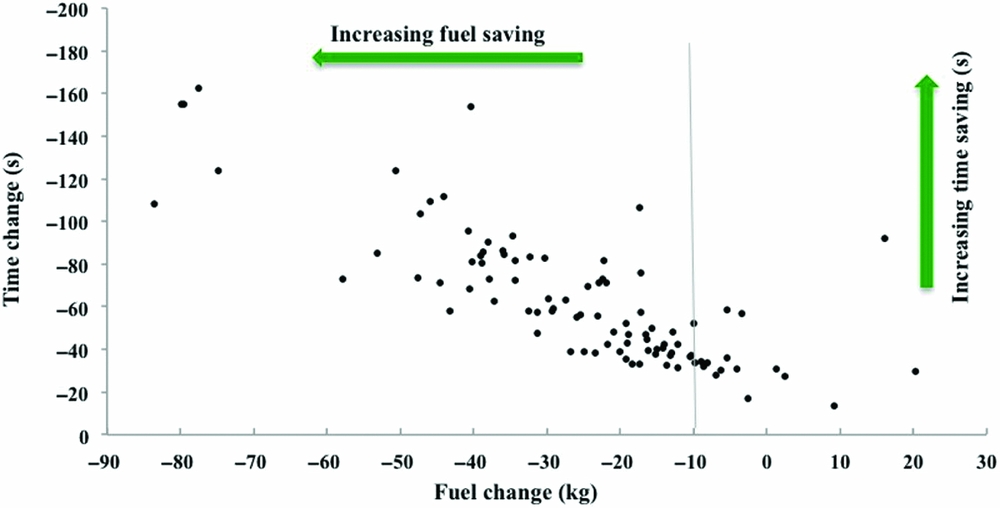
Figure 10. Time and fuel savings in the case of replacing low-level flight segments with cruise segments of equal distance.
As can be seen from Fig. 10, shifting low-level flight segments to higher altitudes provided time saving for each level-off and, when taking outliers out of the calculation, an average 65 s time-saving per level-off was achieved. However, the fuel-saving for each level-off could not be provided. Eleven of 108 level-offs resulted in extra fuel burned. Although fuel savings for each individual level-off could not be provided, an average saving of 27 kg for each level-off was computed when disregarding outliers. Multiplying the average fuel saving by coefficients of 3.156 for CO2, the average CO2 saving was calculated as 85 kg for each level-off.
CO, HC, NOX emissions savings are shown in Fig. 11. Because CO and HC have higher combustion efficiencies in cruise flight due to high thrust settings, the CO and HC emissions indexes are lower. In addition to the lower CO and HC emissions indexes, the duration of the level-offs decreased and emissions savings were achieved for each level-off with an average saving of 302 g CO and 13 g HC per level-off. The NOX emissions saving showed a completely different response. In contrast to the HC and CO, the NOX emissions index showed negative changes for some level-offs and average NOX emissions varied between −114 g and +82 g per level-off.
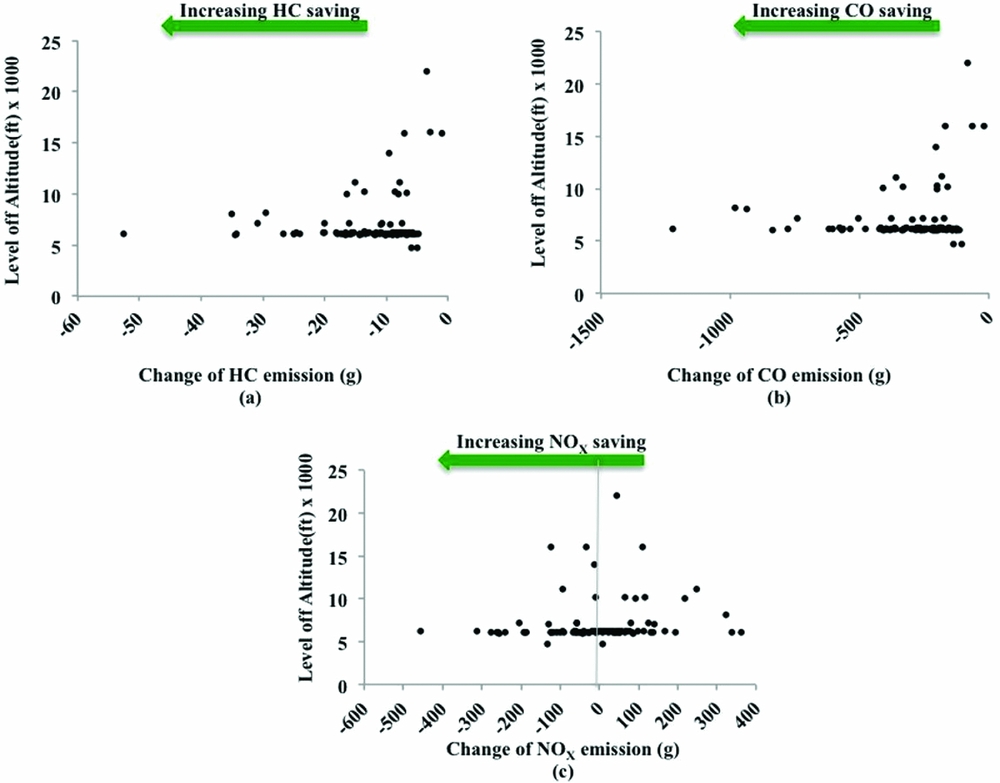
Figure 11. Emissions savings of CO, HC and NOX in the case of replacing low-level flight segments with cruise segments of equal distance.
3.4 Comparison of airport results
A comparison of the percentage of arrival traffic exposed to at least one level-off, and average level-off durations with maximum and minimum values are shown in Fig. 12. Because the minimum level-off duration for the analyses of fuel, time and emissions savings are taken as 60 s, two separate percentages and average duration graphics are shown in Fig. 12.
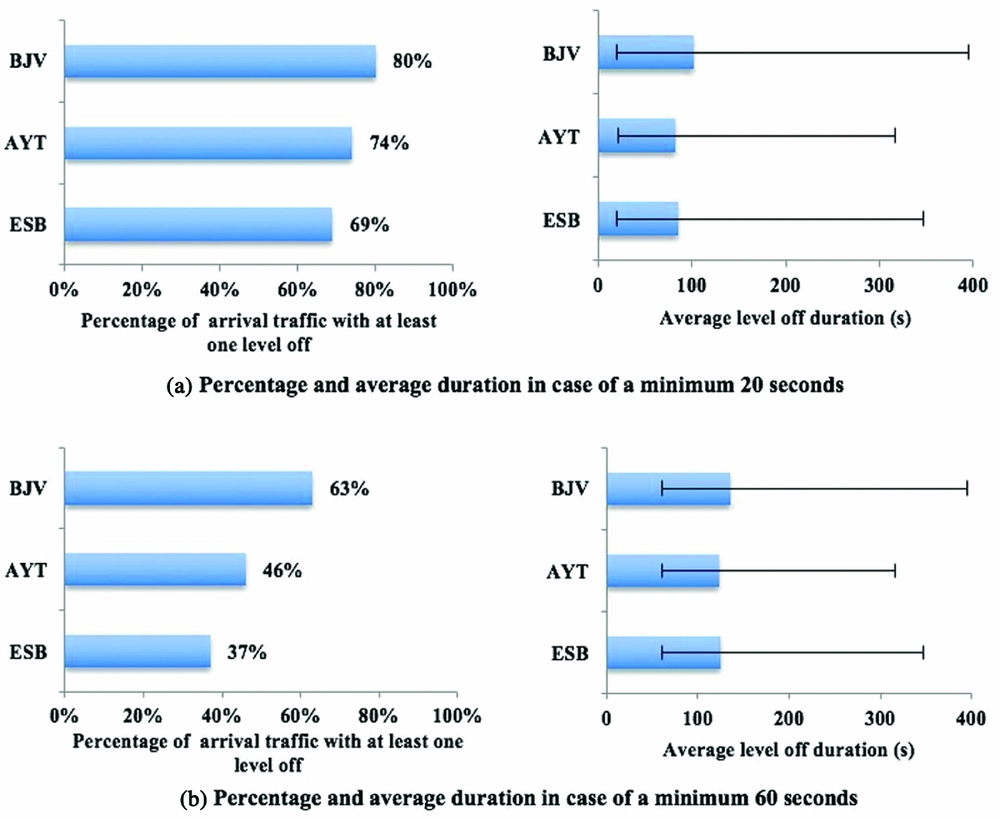
Figure 12. Percentage of arrival traffic with at least one level-off and an average duration of level-offs when the minimum duration of level-off is taken as 20 and 60 s.
Figure 12 shows that the lower limit of 20 or 60 s for level-off duration, percentage of BJV arrival traffic exposed to at least one level-off and an average level-off duration are a maximum across the three airports. When the lower level-off duration limit is increased to 60 seconds, the % of arrival traffic with level-offs for BJV airport decreased from 80% to 63% and the average duration increased from 102 s to 135 s. The difference between the percentages and level-off durations are lowest for BJV airport across the three airports. This condition shows that arrival traffic of BJV airport was exposed to longer level-offs than those for AYT and ESB airports. On the other hand, a reduction in the percentage of arrival traffic with level-offs at AYT and BJV airports is greater. The percentages of arrival traffic with level-offs at AYT and ESB airports decreased from 74% to 46% and 69% to 37%, respectively; the average level-off durations for AYT and ESB airports increased from 83 to 123 ss and 85 to 125 s. For the ESB arrival traffic especially, the percentage reduction is significant and this showing that ESB arrival traffic is generally exposed to level-offs of lower durations.
Fuel, time and emissions savings were calculated after filtering level-offs greater than 60 s. The potential average fuel and time savings for BJV, AYT and ESB airports are given below in Fig. 13.
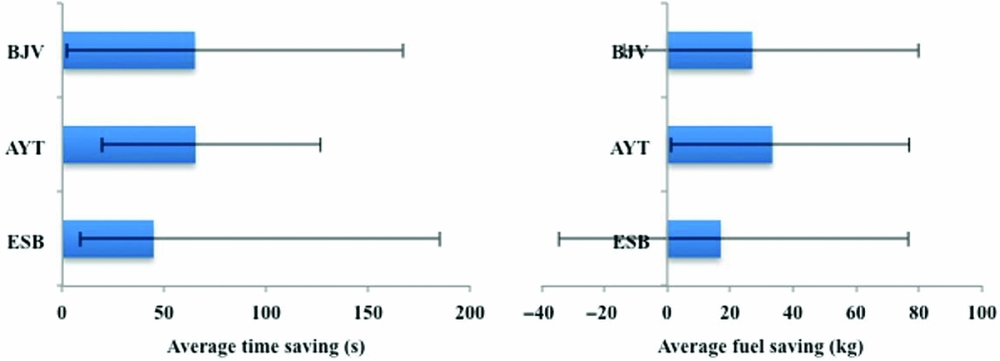
Figure 13. Average time and fuel saving for BJV, AYT and ESB airports.
The average time savings for BJV and AYT are approximately equal at around 65 s, whereas it is found to be 45 s for ESB airport. The average fuel savings for BJV, AYT and ESB airports are 27 kg, 33 kg and 17 kg, respectively. Although time savings are identical for BJV and AYT airports, average fuel saving for AYT is higher. This is probably due to lower level-off altitudes of AYT arrival traffics compared to the level-off altitudes of BJV arrivals. Average CO2 emissions saving are found to be 85 kg, 105 kg and 60 kg for BJV, AYT and ESB, respectively. Average CO emissions savings for level-offs during arrivals at BJV, AYT and ESB are calculated as 301 g, 240 g and 865 g CO. Average HC and NOX emissions savings for the airports are found to be insignificant.
4.0 CONCLUSION
This paper focuses on the vertical profile inefficiency analysis of arrival traffic at BJV, AYT and ESB airports using FDR data taken from a widely used narrow-body aircraft. The location and frequency of vertical inefficiencies (low-level flight segments) in terms of altitude, latitude and longitude are determined. For the benefit analyses, a best scenario is considered and potential time, fuel and CO2, HC, CO and NOX emissions savings are calculated in the case of an aircraft shifting low-level flight segments in the arrival phase to its own cruise altitude and replacing inefficient low-level flight segments with a cruise segment of equal distance. Average savings found for a low-level flight segment in arrival traffic are 65 s time, 27 kg fuel, 85 kg CO2, 301 g CO for BJV, 65 s time, 33 kg fuel, 105 kg CO2, 240 g CO for AYT and 45 s time, 17 kg fuel, 60 kg CO2, 865 gr CO for ESB. HC and NOX savings are found to be insignificant.
This paper also identifies the effects of different types of arrival procedures on level-off segments. Esenboga approach centre only applies radar-vectoring techniques for arrival and departure traffic in TMA and this method seems to result in especially dispersed arrival paths. Long and dispersed paths mean extra fuel, time and emissions. RNAV procedures may provide benefits for ESB airport. The Antalya approach centre applies RNAV STAR and RNAV SID and it seems to be beneficial for an airport with busy air traffic that there are not any longer dispersed paths. Level-off segments during the application of Open STAR may be decreased by the better organisation of sectors and controllers. For the arrival and departure operations of BJV airport, there is a defined RNAV STAR and RNAV SID, but it is understood that these procedures are not preferred for use under low and moderate traffic densities. Future work will focus on the inefficiencies of descending and climbing traffic in terminal manoeuvring areas due to the interaction of arrival and departure traffic.
ACKNOWLEDGEMENTS
This study was supported by the Anadolu University Scientific Research Project Commissions (project no. 1504F176) of Turkey. The authors would like to thank the Pegasus Airlines for providing flight data records.


