


INTRODUCTION
The Saginaw lobe has been studied by glacial geologists for well over a century (Chamberlin, Reference Chamberlin1878; Leverett, Reference Leverett1899, Reference Leverett1904, Reference Leverett1911; Russell and Leverett, Reference Russell and Leverett1908; Lane, Reference Lane1907; Leverett and Taylor, Reference Leverett and Taylor1915), being one of several major outlet-glacier lobes of the Laurentide Ice Sheet, which crossed the Great Lakes region during Marine Oxygen Isotope Stage 2 (Mickelson et al., Reference Mickelson, Clayton, Fullerton, Borns and Wright1983; Blewett et al., Reference Blewett, Lusch, Schaetzl, Schaetzl, Darden and Brandt2009). The Saginaw lobe flowed into southern Michigan, out of the Lake Huron basin, eroding Saginaw Bay and depositing a variety of glaciogenic sediments and landforms (Fig. 1). By the last glacial maximum, the Saginaw lobe had formed interlobate zones, as it abutted the Lake Michigan lobe to the west, the Huron–Erie lobe to the southeast, and less-studied lobe(s) to the north and northwest (Rieck, Reference Rieck1979; Schaetzl et al., Reference Schaetzl, Lepper, Thomas, Grove, Treiber, Farmer, Fillmore, Lee, Dickerson and Alme2017).

Figure 1. Map of the southern Great Lakes region, showing the general flow paths of the major glacial lobes and the boundaries of the Saginaw lobe terrain as defined in five previous studies (Burgis, Reference Burgis1977; Lineback et al., Reference Lineback, Bleuer, Mickelson, Farrand and Goldthwait1983; Monaghan and Larson, Reference Monaghan and Larson1986; Meek and Winters, Reference Meek and Winters1989; Kehew et al., Reference Kehew, Esch, Kozlowski and Ewald2012). For more detail in Indiana, see Lineback et al. (Reference Lineback, Bleuer, Mickelson, Farrand and Goldthwait1983).
Maps of the extent of the Saginaw lobe generally place its southeastern margin at the southeastern interlobate region (Schaetzl et al., Reference Schaetzl, Enander, Luehmann, Lusch, Fish, Bigsby, Steigmeyer, Guasco, Forgacs and Pollyea2013) and its northwestern extent at the large, hummocky West Branch moraine (Figs. 1 and 2). The location of the boundary between the Lake Michigan and Saginaw lobes in western lower Michigan varied with time (Kehew et al., Reference Kehew, Nicks and Straw1999), but during deglaciation was probably located in a roughly north–south zone somewhere just east of Grand Rapids and Kalamazoo (Kehew et al., Reference Kehew, Beukema, Bird and Kozlowski2005, Reference Kehew, Esch, Kozlowski and Ewald2012; Colgan et al., Reference Colgan, Vanderlip and Braunschneider2015). Identifying the boundaries of the Saginaw lobe closer to its southernmost extent has proven difficult, as the retreat of the Lake Michigan, Erie, and Saginaw lobes was asynchronous (Kehew et al., Reference Kehew, Nicks and Straw1999, Reference Kehew, Beukema, Bird and Kozlowski2005, Reference Kehew, Esch, Kozlowski and Ewald2012; Curry et al., Reference Curry, Hajic, Clark, Befus, Carrell and Brown2014); during deglaciation, each of the lobes became progressively segregated (Brown et al., Reference Brown, Newell, Stone, Kincare and O'Leary2006).
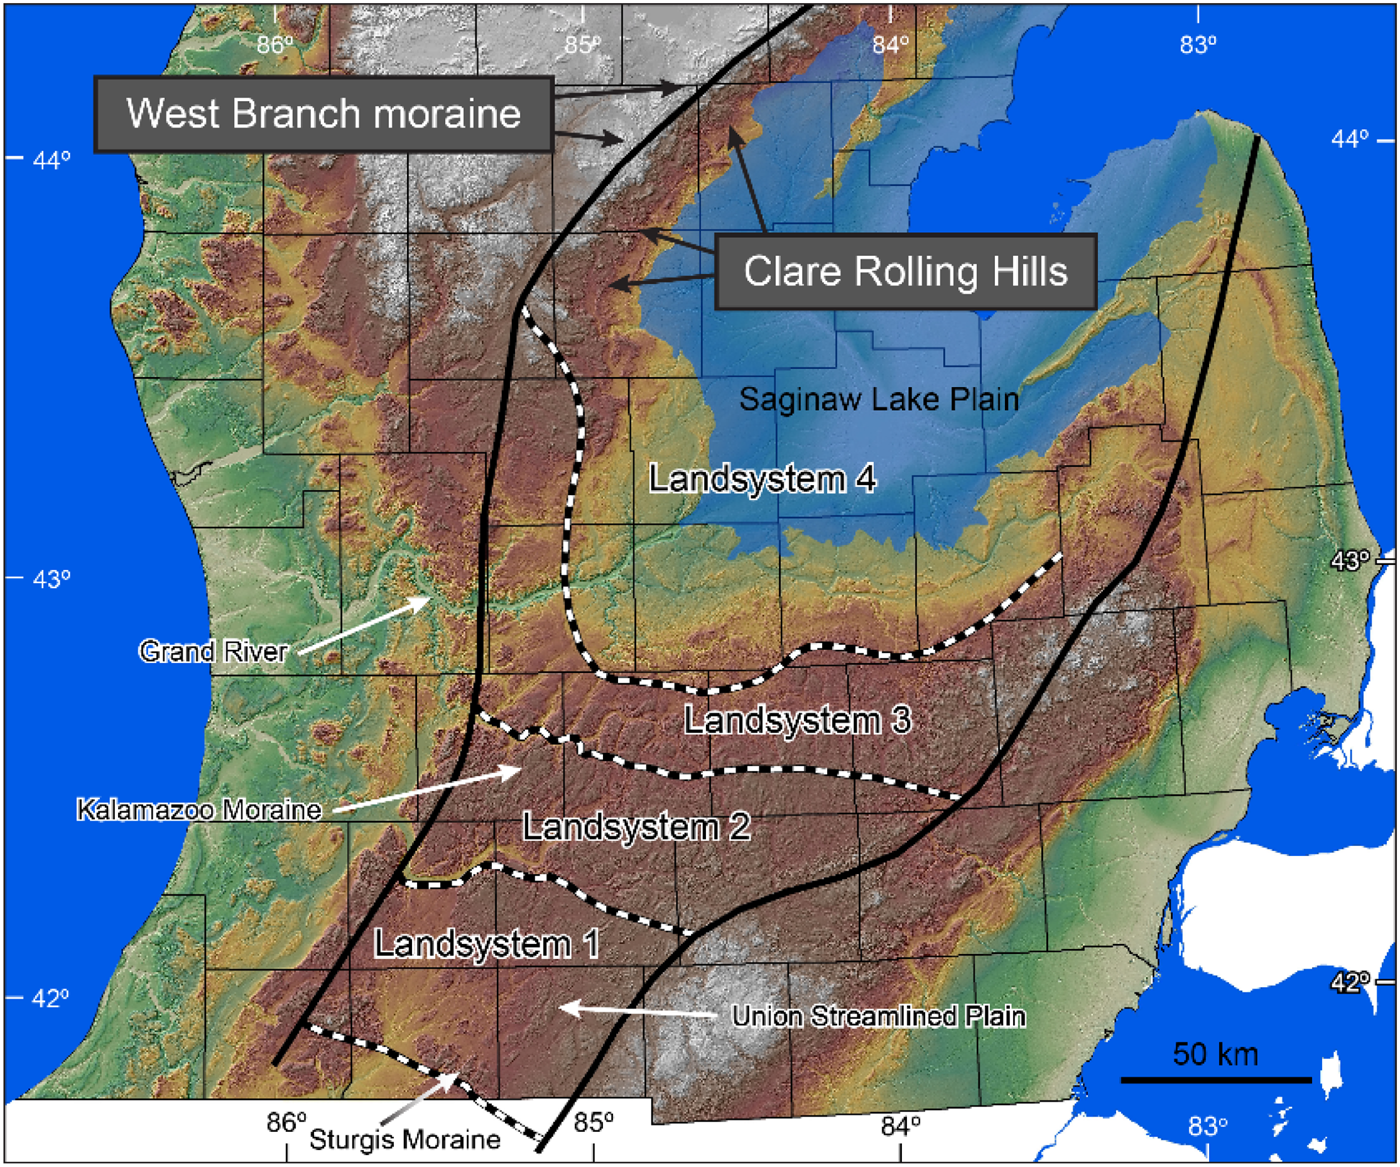
Figure 2. Landsystems of the Saginaw lobe, as delineated by Kehew et al. (Reference Kehew, Esch, Kozlowski and Ewald2012). The area shaded blue represents the maximum extent of glacial Lake Saginaw (after Lusch et al., Reference Lusch, Stanley, Schaetzl, Kendall, van Dam, Nielsen and Blumer2009). Landsystem boundaries have been slightly altered, as per personal communication with A.E. Kehew.
Crosscutting relationships of glacial landforms and meltwater channels in this area (Kehew et al., Reference Kehew, Nicks and Straw1999, Reference Kehew, Beukema, Bird and Kozlowski2005, Reference Kehew, Esch, Kozlowski and Ewald2012; Curry et al., Reference Curry, Hajic, Clark, Befus, Carrell and Brown2014) indicate that the Saginaw lobe had retreated early from this region, and subsequently, the initially deglaciated landscapes were later partially overridden by both the Lake Michigan and Huron–Erie lobes (Kehew et al., Reference Kehew, Nicks and Straw1999, Reference Kehew, Beukema, Bird and Kozlowski2005, Reference Kehew, Esch, Kozlowski and Ewald2012; Brown et al., Reference Brown, Newell, Stone, Kincare and O'Leary2006). In sum, as the Saginaw lobe retreated from southern Michigan, the adjoining lobes—at least occasionally—continued to advance. We point this out to emphasize that the boundaries of the Saginaw lobe “terrain” are not well defined and were not static during initial ice advance and retreat. Nonetheless, our purpose is not to strictly delimit or map the extent of this landscape. Rather, we characterized tills in those parts of the Saginaw lobe terrain that are clearly central to, and affiliated with, the lobe. Our goal is to use this approach to develop insight into glacial entrainment, transport, and deposition processes of the Saginaw lobe through the analysis of hundreds of till samples from across almost 22,000 km2 of this terrain and to use these data to develop a sediment-mixing process model of till genesis. This approach seems appropriate, as upland landforms in many areas at the margins of the lobe are mainly composed of surpraglacial and glaciofluvial sediment, but basal till dominates the central part of this terrain.
Recent work on glacial history, till provenance, and glacial processes has taken a turn toward using spatial data, along with a variety of statistical and multivariate analyses: for example, Curry et al. (Reference Curry, Porter, Irvine-Fynn, Rees, Sands and Puttick2009), Grunsky et al. (Reference Grunsky, Mueller and Corrigan2014), McMartin et al. (Reference McMartin, Dredge, Grunsky and Pehrsson2016), and Mueller and Grunsky (Reference Mueller and Grunsky2016). Haldorsen (Reference Haldorsen1981) showed the utility of using a spatial sampling approach for interpreting [1] till genesis and [2] the processes of glacial abrasion and crushing identified by researchers in both ancient and modern subglacial depositional systems (e.g., Dreimanis and Vagners, Reference Dreimanis, Vagners and Goldthwait1971; Boulton Reference Boulton1978). Our work uses a distinctly spatial approach and may also be the first attempt at using grouping analysis of spatially assembled till data for the purposes of understanding factors that control spatial patterns across a till sheet.
The purpose of our study, therefore, is to analyze and interpret—via mapping—textural and clay mineralogical variations in the tills of the Saginaw lobe terrain in order to understand entrainment and sedimentation processes at the scale of a glacial lobe. Our work, therefore, should be viewed as a type of land-system analysis, which is becoming more common as a method of interpreting glaciated landscapes (Colgan et al., Reference Colgan, Mickelson, Cutler and Evans2003; Lusch, Reference Lusch2006; Kehew et al., Reference Kehew, Esch, Kozlowski and Ewald2012; Darvill et al., Reference Darvill, Stokes, Bentley, Evans and Lovell2017; Bickerdike et al., Reference Bickerdike, Cofaigh, Evans and Stokes2018). Spatial analyses like those we present here have proven uniquely insightful for eolian deposits in the Great Lakes region of the United States, for example, Luehmann et al. (Reference Luehmann, Schaetzl, Miller and Bigsby2013, Reference Luehmann, Peter, Connallon, Schaetzl, Smidt, Liu, Kincare, Walkowiak, Thorlund and Holler2016) and Schaetzl and Attig (Reference Schaetzl and Attig2013). However, ours is the first such study to examine lobe-scale till variation in Michigan in a spatial manner.
STUDY AREA
County-scale soil maps across the Saginaw lobe terrain, as generally delineated in Figure 1, indicate that soils with parent materials of till are loamy in texture. Soils range from fine sandy loam and sandy loam in the far southwest, through loam and clay loam in the central portion (core) of the terrain, to clay loams and silty clay loams in the north and northwest.
Outside the Saginaw Lake plain, the Saginaw lobe terrain has a variety of classic glacial landforms, particularly large drumlin fields, several low-relief end moraines and intervening till plains, and a number of well-formed tunnel channels. The region has been divided into distinct subregions, each of which has a distinctive suite of landforms, sediments, and glacial history. For example, using existing maps, digital data, and early digital elevation models (DEMs), Colgan et al. (Reference Colgan, Mickelson, Cutler and Evans2003) mapped the region as a composite of several landsystems including low-relief till plains and moraines in the central part of the Saginaw terrain, drumlins and hummocky moraines in the southeast, and a glaciolacustrine plain in the north and northeast. Evans (Reference Evans and Evans2005) defined glacial landsystems as tracts of glaciated terrain with sediments and landforms that can be related to the style or dynamics of the glacier that formed them. Kehew et al. (Reference Kehew, Esch, Kozlowski and Ewald2012) identified four different landsystems for the Saginaw lobe terrain that formed time-transgressively during retreat, one of which is the Saginaw Lake plain (Fig. 2). Schaetzl et al. (Reference Schaetzl, Enander, Luehmann, Lusch, Fish, Bigsby, Steigmeyer, Guasco, Forgacs and Pollyea2013) also divided the region into several distinct physiographic regions (Fig. 2). Our focus here is on the landsystems of Kehew et al. (Reference Kehew, Esch, Kozlowski and Ewald2012).
Landsystem 1 is composed mainly of the sandy Sturgis moraine—a head of outwash incised by tunnel channels near the Indiana border—and the Union streamlined plain—a drumlin field composed of sandy loam tills (Dodson, Reference Dodson1985; Luehmann et al., Reference Luehmann, Peter, Connallon, Schaetzl, Smidt, Liu, Kincare, Walkowiak, Thorlund and Holler2016; Fig. 2). The general NE–SW alignment of the drumlins confirms that the Saginaw lobe was flowing to the southwest while forming these features. Tunnel channels, valley trains, and outwash channels both parallel and crosscut the drumlin field, indicating that meltwater flowed both to the south and west during deglaciation.
Kehew et al. (Reference Kehew, Esch, Kozlowski and Ewald2012) described Landsystem 2 as bounded generally by the Kalamazoo River valley on the south and west and the Thornapple River valley on the north (Fig. 2). Both river systems carried meltwater during glacial retreat (Kehew et al., Reference Kehew, Beukema, Bird and Kozlowski2005; Kozlowski et al., Reference Kozlowski, Kehew and Bird2005). Landsystem 2 generally consists of the high-relief Kalamazoo moraine and associated down-ice landscapes such as the outwash plains associated with the Kalamazoo moraine, and the Union streamlined plain. Many landforms here are suggestive of ice stagnation, burial of ice by supraglacial sediments, and sediment collapse as buried ice melted. Thus, many of the upland landscapes are mantled with supraglacial sediment, although this mantle is often absent on uplands in the southwestern part of the landsystem. Between these till-mantled uplands are deep, wide valleys—former tunnel channels, many of which contain eskers and most of which serve as modern tributaries to the Kalamazoo and Thornapple Rivers.
Tunnel channels are best expressed (widest, longest, most continuous) in Landsystem 3 (Kehew et al., Reference Kehew, Esch, Kozlowski and Ewald2012). Most of this upland landscape is a low-relief till plain, but it is cut by several prominent, regularly spaced tunnel channels, some of which now drain north to the Grand River or Thornapple River valleys; others drain south to the Kalamazoo River valley. The dominance of “till plain” landforms, coupled with the general lack of high relief–collapse features, implies that much of this landscape has basal till exposed at the surface. In the eastern sections of Landsystem 3, nearer the interlobate, more of the landscape is composed of coarse-textured sediments, many of which have glaciofluvial origins or may represent supraglacial drift.
A prominent drainage divide—both at the surface and on the bedrock topography—occurs within Landsystem 3 (Fig. 2). The divide on the bedrock surface aligns closely with the boundary between Landsystem 3 and 4; at the surface the drainage divide is farther south. Thus, Landsystem 4 represents the part of the Saginaw terrain that slopes northward, toward Saginaw Bay, including a low-relief till plain that lies above the highest shoreline, as well as the lake plain proper. Several small moraines occur in Landsystem 4, formed as the ice margin was in retreat, downslope toward Saginaw Bay. Other parts of this landsystem reflect channels formed by ice-marginal drainage.
The northern part of the Saginaw lobe terrain was not defined or discussed by Kehew et al. (Reference Kehew, Esch, Kozlowski and Ewald2012), so we briefly discuss it here. The prominent West Branch moraine, presumably a Saginaw lobe feature, is broad and extremely hummocky, typically 10 to 12 km in width, with local relief values that are commonly 10 to 50 m (Schaetzl et al., Reference Schaetzl, Enander, Luehmann, Lusch, Fish, Bigsby, Steigmeyer, Guasco, Forgacs and Pollyea2013; Fig. 2). Proximal to the moraine but above the lake plain is a till plain landscape of moderate relief and fine-textured soils, named by Schaetzl et al. (Reference Schaetzl, Enander, Luehmann, Lusch, Fish, Bigsby, Steigmeyer, Guasco, Forgacs and Pollyea2013) as the Clare Rolling Hills.
METHODS
Our work was conducted as part of a graduate seminar at Michigan State University. First, we broadly delimited the Saginaw lobe terrain, based on maps from previous studies (Fig. 1) and by using the physiographic map of Schaetzl et al. (Reference Schaetzl, Enander, Luehmann, Lusch, Fish, Bigsby, Steigmeyer, Guasco, Forgacs and Pollyea2013; https://www.esrs.wmich.edu/mgs/webmgs/physiography/physio.html, accessed January 4, 2020; Fig. 1). We included some of the West Branch moraine in the Saginaw lobe terrain, as most consider it to be a Saginaw lobe feature and it is dominated by tills, but excluded most areas within the topographically and sedimentologically diverse interlobate moraine of southeastern Michigan, where glaciofluvial sediments make up most of the landscape (Rieck, Reference Rieck1979; Rieck et al., Reference Rieck, Winters, Mokma and Mortland1979). The uppermost limit of glacial Lake Saginaw was taken from Lusch et al. (Reference Lusch, Stanley, Schaetzl, Kendall, van Dam, Nielsen and Blumer2009), and initially all of our sample sites were restricted to areas above this shoreline, that is, till landscapes that had not been covered by the lake. Then, using digital soils data from county-wide soil maps from the Natural Resources Conservation Service (NRCS), we identified the soils on the delimited landscape that have “till” listed as the lowermost parent material in their official series description. By downloading these data onto a laptop computer equipped with a GPS and by overlaying the soils data onto a shaded-relief DEM, we were able to navigate to and obtain ≈500–750 g samples of till from 336 upland sites across the Saginaw lobe terrain, meeting our goal of sampling at regular spacing of ≈2–10 km. At each site we used a bucket auger to obtain a sample of minimally weathered C horizon sediment, typically from 100 cm to 175 cm depth. In the calcareous parent materials of the Saginaw lobe, we could readily verify that the auger had penetrated through the profile and into unleached parent material by exposing the sediment to dilute HCl. Knowing that the till in this area is loamy, based in the NRCS soils data, we rejected any abnormally sandy samples.
Texture analysis
All 336 samples were air-dried and lightly ground to pass a 2 mm sieve. Because laser diffraction of clay-rich samples requires only ≈0.2 g for analysis, sample homogenization is critical. Thus, each ground and sieved sample was run through a sample splitter three times. Diffractometry pretreatment involved shaking subsamples for 15 minutes in a water-based solution of (NaPO3)13⋅Na2O. Dispersed samples were then analyzed with a Malvern Mastersizer 2000E laser particle-size analyzer. Because of the textural variation that occurs within the sample bags, even after homogenization, we ran each sample twice and then compared the data using an in-house quality control (QC) method. This method compares each pair of sample data with precision standards initially established by Miller and Schaetzl (Reference Miller and Schaetzl2012) and recently updated. QC analyses indicated which samples required further particle-size analysis (i.e., additional runs) until the data from two runs were statistically similar enough so that a mean value could be taken to represent the sample. In some instances, as many as five different runs on the laser diffraction unit were necessary to arrive at two suites of data that met the QC criteria. Mean grain-size data for each sample were then exported into a spreadsheet and graphed as continuous particle-size distribution plots, which we call textural curves (Luehmann et al., Reference Luehmann, Schaetzl, Miller and Bigsby2013), and were grouped into more traditional particle-size classes (very fine sand, silt, very coarse silt, etc.).
Laser diffraction underestimates the content of the clay fraction relative to the older but more established pipette method (Wen et al., Reference Wen, Aydin and Duzgoren-Aydin2002; Eshel et al., Reference Eshel, Levy, Mingelgrin and Singer2004; Yang et al., Reference Yang, Zhang, Li, Jia, Wei and Shao2015). This effect is probably caused by the nonsphericity of the clay particles (Konert and Vandenberghe, Reference Konert and Vandenberghe1997). Two “correction” options are typically used to address this issue: (1) statistical correlations between pipette and laser data and/or (2) adjustments of the clay–silt boundary (upward) from its traditional 2 μm position to a higher number, typically 5, 6, or 8 μm (e.g., Schaetzl et al., Reference Schaetzl, Bettis, Crouvi, Fitzsimmons, Grimley, Hambach and Lehmkuhl2018). Following previous work (Nyland et al., Reference Nyland, Schaetzl, Ignatov and Miller2018), we chose the latter approach; for this study we have defined the clay–silt boundary as occurring at 8 μm.
Sediments of glacial landscapes exhibit considerable spatial variation, so we analyzed the data in a GIS for textural outliers, that is, samples that are vastly different, texturally, from their nearest neighbors, following the protocol of Luehmann et al. (Reference Luehmann, Peter, Connallon, Schaetzl, Smidt, Liu, Kincare, Walkowiak, Thorlund and Holler2016). We used ESRI's cluster and outlier analysis (Anselin local Moran's I) to identify outliers (ESRI, 2012). This method identifies statistically significant high-value clusters, low-value clusters, and spatial outliers, as compared with surrounding sample points. We used inverse distance conceptualization of spatial relationships across a comprehensive suite of grain-size data, ensuring that the neighboring features would have the greatest influence on the generated statistics. From our initial suite of 336 samples, six were identified as statistical outliers for more than half of the grain-size data metrics and thus were discarded, resulting in a final sample data set for Saginaw lobe tills of 330.
Initial exploration of the data suggested that tills become progressively coarser textured to the southwest, implying that textural mixing and dilution of fines may have occurred during till entrainment, transport, and deposition. Thus, we opted to collect 17 additional samples from two different areas on the Saginaw Lake plain (Fig. 3), where soils identified by the NRCS as having formed in lacustrine clays are widespread. We hypothesized that older lake plain sediments similar to those of glacial Lake Saginaw were the source of the silt–clay fraction in the till. Although our lake plain samples are younger than the tills, we assumed that they are texturally similar to older lake plain sediment in the subsurface, which would have been the primary source of clay–silt mixed into tills of the Saginaw lobe terrain.

Figure 3. Map of southern Michigan showing the locations of all 347 sample locations and the uppermost shoreline (blue) of glacial Lake Saginaw.
Spatial grouping analysis
Texture data from the 330 till and 17 lacustrine samples were grouped using the Grouping Analysis tool in ArcMap v. 10.6.1, which aggregates points into groups based on selected variables under predetermined spatial constraint conditions. Our initial inspection of the texture data suggested that the following nine variables provide the widest array of data and thus hold the most potential for discrimination: clay, clay + fine silt, clay + medium silt, clay + silt, silt, fine sand, medium sand, fine sand + medium sand, and (fine sand + medium sand)/clay. In the Grouping Analysis tool we set the spatial constraint method as k nearest neighbors and used the default Euclidean distance method, with eight neighbors. The tool produces a report that provides statistics on each group and determines the optimal number of groups for the given data set. In short, the Grouping Analysis tool identified natural groups based on the similarity of their grain-size data (the nine variables) as constrained by their geographic proximity.
We began by running the Grouping Analysis tool on the full data set. Allowing the tool to determine the optimal number of groups, we then examined the data for those groups and removed the group with the lowest standard deviation from further analysis. The tool was then run again on the remaining data, and the process was repeated until the data could no longer be partitioned into groups that were interpretable; that is, the tool split the last group into so many small groups that it was clear we had reached the functional end of the process. In the end, the tool produced six natural groups from among the till and lake sediment data (Fig. 4). Summary statistics (mean, standard deviation) were then calculated on a variety of texture attributes, including mean grain size, for each group. Texture pie charts of several grain-size fractions (clay, fine silt, medium silt, coarse silt, very fine sand, fine sand, medium sand, and coarse sand + very coarse sand) were also calculated so as to facilitate intergroup comparisons.

Figure 4. Grain-size data for the 330 till samples, plotted on a standard NRCS textural triangle.
Principal component analysis
To identify underlying modulators of spatial variability in textural properties, principal component analysis (PCA; Davis, Reference Davis2002) was performed on the same nine grain-size variables that were used in the grouping analysis. Grain-size data for each variable were square-root transformed (Hellinger transformation; Legendre and Gallagher, Reference Legendre and Gallagher2001) before statistical analysis to minimize potential biasing effects of excessively high and low values while still preserving proportional relationships between the categories. The PCA was conducted using a matrix of Pearson product-moment correlation coefficient (r) values among the grain-size classes, using PC-ORD v. 6.19 software (McCune and Mefford, Reference McCune and Mefford2011). Finally, a varimax rotation was applied to the original unrotated PCA solution to facilitate interpretation through maximization of variances between the resulting principal components and factor loadings. PCA scores were then interpreted and mapped.
Clay mineral analysis
We identified two representative samples from each of the six sediment groups for clay mineral analysis. Each sample met two criteria: (1) it was located near the geographic center of its group, and (2) it had clay and silt contents that were both within 3% of the group mean. With the exception of group 2 (West Branch moraine), which had only five samples in total, all of the groups contained at least two samples that satisfied these criteria. For group 2, we used the two samples nearest to the group's geographic center for clay mineral analysis.
We then prepared 12 oriented clay samples (two slides for each sample) by taking an aliquot of a dispersed suspension of a sample from 10 cm depth, after it had been mixed and allowed to settle for ~8 hours, in order separate out the <2 μm fraction. Aliquots were pipetted onto glass slides and air-dried. We then glycolated the oriented clay samples by exposing them to ethylene glycol vapors for at least 48 hours in a sealed chamber.
The slides were each analyzed twice with a Rigaku MiniFlex 600 X-ray diffraction (XRD) unit set to scan from 2° to 30° 2-theta, at 2° per minute (see Colgan et al. [2015] for details of machine geometry and XRD settings). Baseline corrected peak-height counts were determined using Rigaku PDXL v. 2.5.2.0 software. Diffraction peaks were identified as chlorite 003 (~4.7 Å), illite 002 (5 Å), kaolinite 001 + chlorite 002 (~7 Å peak), illite 001 (~10 Å peak), and vermiculite 001 + chlorite 001 (~14 Å). We then estimated the kaolinite + chlorite, illite, and vermiculite + chlorite contents as relative percentages of the sum of the three primary peak counts (7 Å, 10 Å, and 14 Å). A few analyses were rejected because peeling of slides led to low counts and/or missing peaks; for these samples, we recoated slides and reran them in order to produce seven to eight total analyses for each group, from which the mean and two standard deviations were derived. We then calculated 7 Å/10 Å and 4.7 Å/5 Å ratios to compare our data with previous studies and to check for the effects of weathering (Colgan et al., Reference Colgan, Vanderlip and Braunschneider2015). Finally, we heated one slide from each sample to 550°C for two hours and then analyzed it to determine whether the 7 Å peak included chlorite, as chlorite also has a secondary peak at 7.1 Å, and kaolinite heated to 550°C will be decomposed (Colgan et al., Reference Colgan, Vanderlip and Braunschneider2015).
RESULTS
General characteristics of the Saginaw lobe terrain tills
We could find only one study of till stratigraphy of the Saginaw lobe landscape. Monaghan and Larson (Reference Monaghan and Larson1986) identified two till sheets; they named the unit at the surface the Bedford till, and identified the Fulton till in the subsurface. They correlated the surface Bedford till to the Kalamazoo, Charlotte, and Lansing moraines, and the Fulton till to the Union streamlined plains (drumlin field) and the Tekonsha moraine, or upland. They also determined the texture and clay mineralogy for both of these tills in the southernmost portion of the Saginaw lobe terrain (Landsystems 1 and 2 of Kehew et al. [2012]). Nonetheless, Monaghan and Larson's (Reference Monaghan and Larson1986) study predates the transformative work on the Saginaw lobe deglacial system that has emerged over the past two decades, which documents widespread stagnation, deposition of supraglacial tills, and formation of networks of tunnel channels (Brown et al., Reference Brown, Fisher, Kehew and Taylor1999; Kehew et al., Reference Kehew, Nicks and Straw1999, Reference Kehew, Esch, Kozlowski and Ewald2012; Fisher et al., Reference Fisher, Jol and Boudreau2005). These newer studies replace more traditional models of progressive ice margin retreat and readvance, which pointed to a landsystem whereby low-relief till plains and small recessional moraines were formed.
Almost every area mapped as having till parent materials by the NRCS soil maps was found to be composed of till. The exceptions were sites near the highest shoreline of glacial Lake Saginaw; some of these areas were sandy, indicating possible overwash of beach sands. Alternatively, our shoreline elevations may, in places, be too low, and sites assumed to be above the highest shoreline may, in actuality, be slightly below it.
Tills of the Saginaw lobe terrain are loamy and calcareous, and some are strongly calcareous. Most of the soils developed in till become calcareous between 80 and 140 cm depth. Matrix colors (moist) are very consistent among tills; the great majority are 10YR 4/4 and 4/3 (dark yellowish brown and brown, respectively). Carbonate masses and coatings are common on ped faces, typically 10YR 6/1 and 6/2 (gray and light brownish gray). Coarse fragment (>2 mm) contents, although not explicitly measured, are typically less than 5%. Texture classes span a large part of the midsection of the textural triangle (Fig. 4). Clay loam, loam, and sandy clay loam textures are most common; the mean overall, and most common, texture is clay loam. Mean grain-size data illustrate the bimodal character of the tills; they generally contain less silt, especially coarse and medium silt, than sand or clay (Fig. 5).

Figure 5. Mean grain-size curve for the 330 till samples from the Saginaw lobe terrain. This graph, and the others like it, shows the mean value plus or minus 1 SD for >100 different particle sizes.
The 8 μm break between the clay and silt fractions used in this study impacts how we define the finer sediment in the tills; much of it is between 4 μm and 10 μm. In our classification scheme, sediment <8 μm in diameter is considered clay. Although we did not confirm this, we believe that most of the fine sediment would also have been categorized as clay, even if the grain-size analysis had been performed by more traditional methods of analysis. For the purposes of discussion, we will (from this point forward) generally refer to sediment at this interface as silt–clay. Semantics aside, the geological interpretations are unchanged.
Natural textural groups of the Saginaw lobe terrain tills
The grouping analysis produced six natural groups across the Saginaw lobe terrain (Fig. 6, Table 1). The groups are numbered and discussed in the order that the software delimited them. The first group identified consisted of the lacustrine clay sediments on the Saginaw Lake plain (Fig. 6, Table 1). We note that this area was actually added to our sampling campaign after the initial data on till textures had accrued and we had observed that there is often a distinct clay component to the otherwise bimodal till textures (Fig. 5). We therefore concluded that samples of clay-rich glacial lake sediment from the central part of the lake plain were a necessary component of our data set for comparison purposes. These samples all lie in a physiographic region mapped by Schaetzl et al. (Reference Schaetzl, Enander, Luehmann, Lusch, Fish, Bigsby, Steigmeyer, Guasco, Forgacs and Pollyea2013) as the Alicia Clay plains and by Butterfield (Reference Butterfield1986) as the Shiawassee embayment or “flats.” We assumed that these samples represent glaciolacustrine sediments from the deepest part of glacial Lake Saginaw, parts of which were also flooded during the Nipissing Great Lakes phase in the late Holocene (Larsen, Reference Larsen, Karrow and Calkin1985; Monaghan et al., Reference Monaghan, Fay and Lovis1986). Identifying these lake clays as the first group gave us confidence in the grouping method; they are clearly the most texturally unique of all the samples (Fig. 7). Group 1 samples have high amounts of clay and fine silt, and typically classify in the clay texture class, with very low sand contents (Fig. 7, Table 1). The box plot shown in Figure 8 illustrates that samples from this group are texturally finer than any other group and have by far the least sand. Outcrops indicate the well-stratified nature of the sediment, confirming its glaciolacustrine origin. Five additional samples from the lake plain, mapped as lacustrine clay by the NRCS but much closer to the western shoreline of glacial Lake Saginaw, were not classified within group 1 by the software; instead, they were placed within two different till groups (Fig. 6). We believe that these samples are fine-textured tills, and not lake clays as indicated on soil maps.

Figure 6. Map of the six natural groups that were produced by the Grouping Analysis Tool in ArcMap on a background showing some of the physiographic regions of Schaetzl et al. (Reference Schaetzl, Enander, Luehmann, Lusch, Fish, Bigsby, Steigmeyer, Guasco, Forgacs and Pollyea2013).

Figure 7. Mean grain-size curve for the tills of the six natural groups of the Saginaw lobe terrain shown in Fig. 6.

Figure 8. Box plot output from ArcMap showing the variation among the six natural groups of Saginaw lobe tills for the nine texture variables. Standardized value scores reflect the statistical distance of each group's data from the overall mean for that grain-size variable. Colors correspond to those shown in Fig. 6.
Table 1. Characteristics of the six natural groups of till of the Saginaw Lobe terrain.

a After Schaetzl et al. (Reference Schaetzl, Enander, Luehmann, Lusch, Fish, Bigsby, Steigmeyer, Guasco, Forgacs and Pollyea2013).
b After Kehew et al. (Reference Kehew, Esch, Kozlowski and Ewald2012).
The software next identified the sandy samples of the West Branch moraine as group 2 (Fig. 6, Table 1). Tills are not widespread in the moraine; most of the hummocky moraine landscape is composed of outwash, ice-contact stratified drift, and other sandy sediments. The five till samples from the moraine are nonetheless weakly bimodal, with a large sand peak and a small, broad, secondary peak at the clay–silt boundary (Fig. 7).
The tills of the distal, down-ice parts of the Saginaw terrain were identified as group 3 and would generally have been classified by Monaghan and Larson (Reference Monaghan and Larson1986) as Fulton till, which is the surface till southeast of the Kalamazoo moraine and as Bedford till in the Kalamazoo moraine areas. We refer to tills of this group as comprising “down-ice landscapes” (Fig. 6, Table 1). Most of these samples are from the drumlins of the Union streamlined plain, although other sandy landscapes are also well represented, for example, the Rives Rolling Hills, the Hillsdale Highlands, and the Battle Creek Hills (Schaetzl et al., Reference Schaetzl, Enander, Luehmann, Lusch, Fish, Bigsby, Steigmeyer, Guasco, Forgacs and Pollyea2013). Parts of the Kalamazoo moraine and the interlobate are also represented in this group. Most of these sites fall within Landsystems 1 and 2 of Kehew et al. (Reference Kehew, Esch, Kozlowski and Ewald2012). The tills here, like those of group 2, are sandy loams, and represent landscapes with large components of glaciofluvial sediments. Clay and silt contents are low in these tills, with modes typically between 4 and 8 μm (Fig. 7). Monaghan and Larson (Reference Monaghan and Larson1986) reported 43% mean sand content for the Fulton till (n = 6) on the drumlinized plain and 51% for the Bedford till (n = 6) from the Kalamazoo moraine; our data, taken from a larger number of sites (Table 1), indicate that the tills are much sandier (mean sand content 66.6%).
The fourth group identified by the software occurs in the easternmost part of the Saginaw terrain, centered on the City of Flint. We chose the name “Lansing loamy plains, Flint subdivision” for this group, because most of the samples are in the Lansing loamy plains physiographic region (Fig. 6, Table 1). The Lansing loamy plains, which occur near the geographic midsection of the Saginaw terrain, typify the Saginaw terrain—low-relief, swell-and-swale till plains, with moderate-to-low relief recessional moraines, formed in clay loam tills (Table 1). The tills in group 4 separate from other tills in the “core” part of the Lansing loamy plains by being higher in silt, that is, their fine mode is slightly coarser (Figs. 7 and 8). Other grouping analyses, using slightly different texture variables (not reported here), consistently identified this area on the Saginaw terrain. Silt contents of the tills in group 4 average 34.8%, 6.9% higher than in the “core” group. Clay contents are also higher (32.7% vs. 25.6%).
The fifth group identified occurs mainly in the Clare Rolling Hills physiographic region, although it also includes some of the northern sections of the Lansing loamy plains (Fig. 6, Table 1). Like the tills across the Lansing loamy plains (i.e., groups 4 and 6), the clay loam tills in group 5 have distinctly bimodal grain-size distributions. Of these three groups, however, group 5 has the most clay. The high clay contents of the tills here are consistently identified on NRCS county soil maps; this characteristic was key in singling out this physiographic region (Schaetzl et al., Reference Schaetzl, Enander, Luehmann, Lusch, Fish, Bigsby, Steigmeyer, Guasco, Forgacs and Pollyea2013). The tills here are most like the tills in group 4 (Lansing loamy plains, Flint subdivision), with the highest contents of clay and silt of the till groups (Fig. 8), and yet with distinctly bimodal grain-size distributions (Fig. 7).
We note that group 6—Lansing loamy plains core—was not actually singled out by the software as much as it remained behind after groups 1–5 were identified and removed from the analysis. Further analysis of the samples in group 6 by the software resulted in many small groups that were spatially separate and difficult to interpret. Nonetheless, the tills of group 6 typify the tills of the Saginaw terrain, taken widely; that is, their textures are intermediate between the textures of the other groups across almost all textural components (Figs. 7 and 8). Like the average texture class across the region (clay loam), the tills of group 6 are also typically clay loam in texture. Monaghan and Larson (Reference Monaghan and Larson1986) reported textures for the Bedford till, recovered from areas that are within our group 6. Their data on silt and clay contents, however, are difficult to compare with ours, because different methods of analysis were used. Nonetheless, they reported that the Bedford tills are composed of ≈51% sand, which is comparable to data from group 6 tills, which have a mean sand content of 46.4%.
Principal component analysis of tills of the Saginaw lobe terrain tills
PCA has been used successfully in other, spatially oriented studies of geophysical phenomena: for example, Scull and Schaetzl (Reference Scull and Schaetzl2011), Dempster et al. (Reference Dempster, Dunlop, Scheib and Cooper2013), and Grunsky et al. (Reference Grunsky, Mueller and Corrigan2014). Principal component data, rather than raw data (grain-size data, in this case) have been shown to be a more efficient way of defining spatial trends and interrelationships through the reduction of system noise. We believe that the spatial variation in PCA scores for the till samples complements and reinforces the results presented earlier for the grouping analysis.
Cumulatively, the first three principal components (PC1, PC2, PC3) explained 97.5% of the total variance in the textural data (Table 2). PC1 loads most heavily on clay and on variables that comprise the finer grain sizes, and loads negatively on the sand fractions, especially the coarser sand fractions (Table 2). Thus, we interpret this component as indicating the influence of lacustrine clay on till variation. As indicated in the groups map (Fig. 6) and the raw data on clay + fine silt contents (Fig. 9), this component scores highest in the areas of clayey tills, for example, the Clare Rolling Hills (group 2), the Saginaw Lake plain near its outlet to the Grand River, and (less so) the areas of silt-rich tills in group 4. The trend of increasing sand content in the tills down-ice, as shown in Figure 10, also shows up clearly in the mapped scores for PC1, which become increasingly negative in the southwestern corner of the Saginaw terrain (Fig. 11).
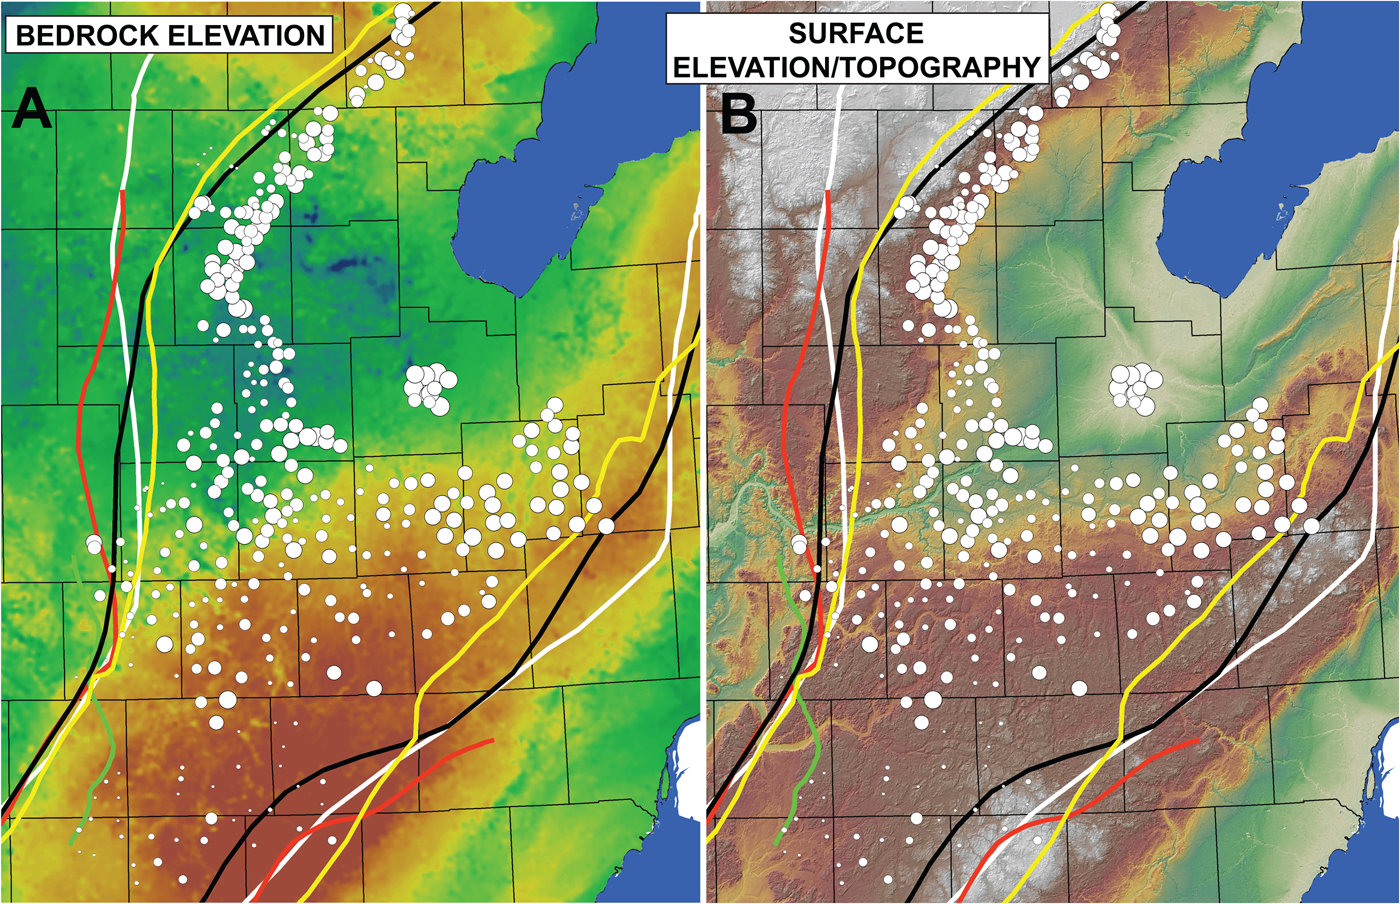
Figure 9. Maps of (A) bedrock elevation and (B) surface elevation/topography for the general area of the Saginaw lobe terrain. Graduated circles indicate contents of clay plus fine silt in the tills and lake sediment. Values ranged from 12.6% to 92.9%.

Figure 10. Maps of (A) Drift thickness (in-house data) and (B) sandstone bedrock (Marshall sandstone: yellow; Saginaw Formation: gold) for the general area of the Saginaw lobe terrain. Graduated circles indicate contents of sand in the tills and lake sediment. Values ranged from 0.5% to 82.1%.

Figure 11. Interpolated maps of principal component analysis (PCA) component scores for each individual sampling site across the Saginaw lobe terrain.
Table 2. Principal component (PC) analysis factor loadings for nine grain size variables, arranged in descending order for each variable

PC2 scored highest on silt, but also high on other grain-size variables that include silt (Fig. 11, Table 2). Thus, scores for PC2 correspond well to the silty tills of group 4, that is, the Lansing loamy plains, Flint subdivision (Figs. 6 and 11). Like PC1, PC2 scores most negatively on the coarser sand fractions—pointing to silt-rich tills with a minimum of sand in the areas where PC2 exhibits positive scores. Interestingly, both areas of strongly positive PC2 scores are in areas where ponded water was most likely to have occurred during the advance (or retreat–readvance) of the Saginaw lobe—the Flint area and the Clare Rolling Hills (Fig. 11).
PC3 loads most positively on sands, mostly fine sands, and negatively on the finer grain-size fractions (Table 2). We interpret this component as the sandy tills, and the component scores map most positively in the sandy tills of the parts of the Union streamlined plains and in the West Branch moraine (Figs. 6 and 11). This trend again illustrates the down-ice changes in sand content associated with increasing distance from any possible lake clay source and the greater influence of sandstone bedrock (Fig. 10).
Clay mineralogy of textural groups of the Saginaw lobe terrain tills
Till samples from groups 2 through 6 contain primarily illite (38% ± 7.5%, 2-sigma), but also kaolinite + chlorite (29% ± 11%, 2-sigma) and vermiculite + chlorite (33% ± 7.3%) as major components (Tables 3 and 4; mean and 2 SD data are reported here). A few of our samples had 16–17 Å peaks, likely indicating small amounts of smectite group minerals like montmorillonite. The high 2-sigma uncertainty suggests that clay mineralogy varies spatially in the tills of the Saginaw terrain. The two glacial Lake Saginaw plain samples (group 1) have similar amounts of illite, as compared with the till samples (35% vs. 38%), but contain slightly less kaolinite + chlorite (23% vs. 29%), and more vermiculite + chlorite (42% vs. 33%). All 12 of the till and lake sediment samples that were heated to 550°C indicate that the 7 Å and 14 Å peaks result primarily from kaolinite and vermiculite, respectively, as only residual kaolinite and vermiculite peaks remained after heating. Kaolinite and vermiculate both decompose at high temperatures (550°C and 370°C, respectively); illite and chlorite do not (Schaetzl and Thompson, Reference Schaetzl and Thompson2015). Residual 7 Å and 14 Å peaks after heating suggest that chlorite is, however, a small but measurable component (≈10% or less) of the tills.
Table 3. Summary of clay mineralogy of Saginaw Lobe till and lake clay samples1

1 Mean data for air-dried oriented clays exposed to ethylene glycol vapor in a sealed chamber for at least 48 hours. Each group included two samples, for which two slides each were analyzed, and each slide was run twice, resulting in 7–8 analyses per group. Clay mineral contents are reported as mean and standard deviation (2-sigma) data.
Table 4. Comparisons of data from Saginaw Lobe tills to those reported in the literature1

1 Clay mineral contents are reported as mean and standard deviation (2-sigma) data.
We calculated 7 Å/10 Å ratios to compare our data with data from prior studies (e.g., Rieck et al., Reference Rieck, Winters, Mokma and Mortland1979; Monaghan and Larson, Reference Monaghan and Larson1986) that used this parameter as a metric (Table 4). The mean 7 Å/10 Å ratios for till samples is 0.76 ± 0.31, as compared with 0.67 ± 0.35 (2-sigma) for the lake sediment (Table 4). These data confirm that the two sediments are generally similar, but that lake clay samples have less kaolinite. We also calculated 4.7 Å/5.0 ratios, which is a ratio of chlorite to illite; relatively low values could indicate weathering of chlorite (Hughes et al., Reference Hughes, Moore, Glass, Amonette and Zelazny1994).
DISCUSSION
Till textures and grain-size variations
The tills of the Saginaw terrain have clear, bimodal grain-size distributions, with good correspondence among groups for the two texture modes. The five till groups and the lacustrine sediment of the Saginaw Lake plain all share fine (clay–silt) modes at roughly the 8 μm clay–silt boundary, and coarse (sand) modes in the fine-medium sand range, between 150 μm and 300 μm. The mean curve of the Saginaw Lake plain samples has a small sand “shoulder” but no actual coarse mode (Fig. 7). The lake clay samples have a fine mode that spans ≈5–10 μm, which matches well with all of the tills, even the sandy tills where the magnitude of this mode is quite low (Fig. 7). Thus, we argue that the tills represent varying mixtures of a sandy-sediment endmember and a lake-clay endmember; they lack a significant coarse silt–very fine sand component. As one would expect for suites of sediment that are formed by mixing two distinct sediment types, the main textural differences among the tills revolve around the degree to which each mode dominates the sediment package.
The clay loam tills that dominate the Clare Rolling Hills and much of the Lansing loamy plains have fine modes that are as large or larger than their sand modes (Fig. 7). Conversely, in the sandy tills of the West Branch moraine and the down-ice landscapes, both of which are on the periphery of the Saginaw lobe terrain (Fig. 6), the sand mode dominates. But even here a small clay mode is present, and the fine materials that comprise this small mode are texturally similar to those in the tills closer to the center of the Saginaw terrain and to the area where the lake clay samples were obtained (Fig. 6).
Speculating on the origin of both the fine and the sandy sediment sources adds insight to our understanding of Saginaw lobe dynamics and tests process models of sediment genesis. First, it seems most plausible to ascribe the clay (<4–8 microns) in the tills to lacustrine sediment and/or a shale bedrock source. Obtaining representative shale samples for textural analysis is not easily done, as areas of shale in up-ice locations presently comprise the floor of Lake Huron. Lake clay, however, is abundant on the Saginaw lobe terrain. The closest and largest lake clay source is, today, in the lowest, central part of the Saginaw lowlands, in our group 1 (Figs. 6 and 7), representing the lowest and deepest part of glacial Lake Saginaw. The topography of both the bedrock surface and the modern surface reach lows in the north-central part of the Saginaw lowlands, not far from the Alicia Clay plains; Saginaw Bay likely continues this topographic low farther to the east (Fig. 9).
With the exception of areas near the Grand River Valley, the Saginaw lobe terrain is bounded by uplands that could have trapped water in front of an ice margin. Our knowledge of proglacial lake history in the Saginaw lowlands is based on both paleo-shoreline landforms (Bergquist and MacLachlan, Reference Bergquist and MacLachlan1951; Bretz, Reference Bretz1951, Reference Bretz1964; Eschman and Karrow, Reference Eschman, Karrow, Karrow and Calkin1985; Butterfield, Reference Butterfield1986; Monaghan et al., Reference Monaghan, Fay and Lovis1986; Larson and Schaetzl, Reference Larson and Schaetzl2001; Lewis et al., Reference Lewis, Karrow, Blasco, McCarthy, King, Moore and Rea2008) and lacustrine deltas (Connallon and Schaetzl, Reference Connallon and Schaetzl2017; Luehmann and Schaetzl, Reference Luehmann, Schaetzl, Kehew and Curry2018). These studies clearly point to a series of proglacial lakes along the ice margin during the retreat of the ice, starting with early stages of glacial Lake Saginaw and continuing for thousands of years. Shorelines on the bounding uplands, as well as several large, shore-parallel drainageways, add support to the notion that water and sediment were repeatedly trapped in front of the Saginaw lobe or that water flowed along its terminus. Key to our study is the assumption that water likely would have been similarly ponded during the advance (and readvances) of the Saginaw lobe.
An interesting pattern depicted in the PC1 map (Fig. 11) supports the possibility of ponded water in some of the proglacial landscapes of the Saginaw terrain. Where the regional proglacial (either surface topography or bedrock topography) slope would have been toward the ice front, either because of upglacier erosion or isostatic depression, water would have been more likely to pond. In these areas, tills contain more fine-textured sediments, for example, groups 4 and 5 (Fig. 6). In more freely draining landscapes, where the regional slope is away from the former ice front, outwash plains and fans would have formed, and if the ice advanced over these landforms, the tills could have been enriched in sand. Scores for PC1 divide nicely among the finer grain sizes (which are positively correlated with PC1) and the coarser grain sizes (which are negatively correlated) (Table 2). These two sets of scores are clearly separated on the Saginaw terrain along a line that presently marks the drainage divide between water flowing toward the Saginaw lowlands (where the tills are finer, and the PC1 scores are all positive) and water flowing to the south (where the tills are sandier, and the PC1 scores are mostly negative). Thus, we assert that the PCA data support our conclusion that till textures here are at least partially influenced by local topography and slope conditions, in so much as they create the potential to pond water ahead of an advancing ice front.
Data from other till groups support this conclusion. The most clay-rich tills of the Saginaw landscape occur in the Clare Rolling Hills (group 5) and in the Lansing loamy plains, Flint subdivision (group 4) (Fig. 9). Both areas abut the Saginaw lowlands and lie just above the highest shoreline of glacial Lake Saginaw (Fig. 6). Two factors help explain why these tills have high clay contents. First, the proximity of these two regions to the central, lowest part of the Saginaw lowlands optimizes the opportunity to entrain fine-textured lake clays and deposit them as till, minimizing any possible dilution effects down-ice. Second, the high topography down-ice from each of these two landscapes makes it likely that proglacial water, either during the ice advance or during its retreat, could have been trapped and ponded there. Both landscapes have many incised drainageways that parallel the former ice margin; the most likely scenario for formation of such channels involves a retreating ice margin between the uplands and the Saginaw lowlands. The West Branch moraine provides the upland necessary to trap and pond proglacial water for the group 5 tills, and the large interlobate just to the south and east of group 4 is its equivalent. The latter would have functioned even better in this regard in the immediate postglacial period, when ice blocks would have been as-yet unmelted. Oscillations of the ice margin, which are clearly documented for the Saginaw lobe (Calkin and Feenstra, Reference Calkin, Feenstra, Karrow and Calkin1985; Eschman and Karrow, Reference Eschman, Karrow, Karrow and Calkin1985), would have been able to mix any lake sediment from these proglacial lakes with other sediment already in place. Therefore, we argue that the high clay contents in the tills of groups 4 and 5 are due to their proximity to the Saginaw lowlands, coupled with down-ice constraining uplands, which would have helped to provide settling basins for fine-textured sediment.
Sand in the tills of the Saginaw lobe likely has multiple sources—glacial erosion and diminution of the crystalline rocks of the Canadian Shield by crushing and abrasion, erosion of sandstones in the Michigan Paleozoic basin, and entrainment of preexisting glacial sediments such as tills, proglacial sands, kame deltas, and outwash fans as the ice advanced. Bedrock is within 5 to 10 m of the surface along most of the axis of the Saginaw lobe, and much of the drift here is composed, at least partially, of supraglacial sediment, suggesting that the Saginaw lobe could have been prodigiously entraining bedrock, then crushing and abrading it while mixing it with lake sediment (Fig. 10A). Kehew et al. (Reference Kehew, Esch, Kozlowski and Ewald2012) concluded that the Union streamlined plains—part of our group 3 tills—obtained their drumlinized form because of the influence of bedrock topography on glacial dynamics. The high permeability of the Marshall Sandstone up-ice from the drumlins would have facilitated infiltration of basal meltwater into the substrate below the glacier and a lowered basal pore pressure. Down-ice from the subcrop of the Marshall Sandstone (see Fig. 10B), however, the ice would have been in contact with Coldwater Shale bedrock, and basal pore pressures would have been higher, facilitating subglacial erosion and deformation of preexisting sediments into drumlins (see also Brown et al., Reference Brown, Fisher, Kehew and Taylor1999). Thus, bedrock clearly was influencing the Saginaw lobe dynamics.
Sand contents in the tills are highest in the West Branch moraine (group 2) and the down-ice landscapes (group 3). We have too little data to suggest a reason for the sandy nature of the moraine, but the occurrence of sandy tills in group 3 is at least partially explainable using a sediment-mixing process model. In short, the tills get increasingly sandy along the axis of the Saginaw lobe terrain (Fig. 10B), likely for two reasons: (1) a dilution effect, as the primary source of clays—the central part of the Saginaw lowlands—becomes more distant; and (2) mining and entrainment of sands from preexisting sediments (e.g., residuum) and sandstone bedrock, especially the Marshall Sandstone (Fig. 10B). Along the axis of the Saginaw lobe, the predominance of shallow bedrock suggests that ice may have been in contact with bedrock in this area, and much of the bedrock here does have a sandstone component (Fig. 10). Kehew (personal communication, 2019) reported that horizontal-to-vertical spectral ratio seismic data for sites on the Marshall cuesta indicate that the lower tills here are replete with blocks of sandstone. Within group 3, tills are sandiest just beyond the Marshall subcrop, pointing to additions of sand from this bedrock unit. Although it is likely that the Saginaw Formation—just up-ice from the Marshall—also contributed sands to the tills, this unit is not a pure sandstone; it also has significant facies of shale and gypsum. The Marshall Sandstone contains very little shale.
Although group 3 (down-ice) tills are very sandy, they nonetheless have a small secondary mode of fine sediment. This mode triples in magnitude up-ice, in the tills of the Lansing loamy plains, core (group 6; Figs. 6 and 7). Regardless, even within group 6, sand contents generally increase down-ice. Both trends suggest a dilution/mixing effect, as opposed to a fining of sediment as predicted by an abrasion and crushing process model (Dreimanis and Vagners, Reference Dreimanis, Vagners and Goldthwait1971; Haldorsen, Reference Haldorsen1981). Finally, we observe that clay contents in group 6 are largest, and sand contents lowest, in the central region, near the Grand River channel (Figs. 9A and 10B), perhaps because this area is immediately down-ice of the centermost part of the Saginaw lowlands, the main clay source region.
Clay mineral variation
Our clay mineral results are consistent with previous research and also support the idea of mixing of two distinct sediment sources along the flow line of the Saginaw lobe. Monaghan and Larson (Reference Monaghan and Larson1986) sampled tills for clay mineral analysis from areas that Kehew et al. (Reference Kehew, Esch, Kozlowski and Ewald2012) later designated as Landsystems 1 and 2; our analysis would have placed their samples into our group 3 (down-ice landscapes). Monaghan and Larson (Reference Monaghan and Larson1986) obtained mean 7 Å/10 Å ratios of 0.72 ± 0.27 for the Bedford till, that is, the surface till of the Kalamazoo moraine and associated till plain (Table 4). They presented mean 7 Å/10 Å ratios of 1.33 ± 0.33 for the Fulton till, that is, the older subsurface till, which crops out in the Tekonsha moraine and in the Union streamlined plain. Our mean 7 Å/10 Å ratio of 0.76 ± 0.31 (2-sigma) for all 10 till samples is nearly identical to that of the Bedford till (Table 4). Our mean 7 Å/10 Å ratio of 0.94 ± 0.21 (2-sigma) for the two group 2 samples (West Branch Moraine) is higher, nearer to that of the Fulton till (Table 4). XRD data from Rieck et al. (Reference Rieck, Winters, Mokma and Mortland1979) for the southeastern part of the Saginaw terrain in the interlobate between the Saginaw and Huron–Erie lobes show that tills here have 7 Å/10 Å ratios >0.91 (Table 4). One of our two group 2 samples has the highest 7 Å/10 Å ratio measured in this study (≈1.10), and the mean for our two group 2 samples is also the highest of all the groups at 0.94 ± 0.21 (Table 3). This mean of >0.91 (Table 4) is within the uncertainty of the samples of Rieck et al. (Reference Rieck, Winters, Mokma and Mortland1979).
We believe that our clay mineral results are not affected by surface weathering of tills since deposition, mainly because our samples were taken from calcareous sediment. The small amount of variation in the mean 4.7 Å/5.0 Å ratios of the samples, i.e., from 0.58 to 0.84, further suggests that the tills have probably not experienced weathering of chlorite (or vermiculite), as has been interpreted from some surface tills (Gardner Reference Gardner1997), and buried weathering zones developed in tills in Michigan (Flint, Reference Flint1999). This is to be expected for calcareous samples. On the other hand, all of our till samples have relatively high amounts of vermiculite, as compared with the subsurface tills of the Lake Michigan lobe (≈33% vs. ≈10%) analyzed by Colgan et al. (Reference Colgan, Vanderlip and Braunschneider2015). Higher amounts of vermiculite could indicate that some amount of weathering has occurred in these surface tills; more likely it indicates higher amounts of vermiculite in the original source sediments. Supporting the latter interpretation is the observation that lake sediment samples have the highest contents of vermiculite + chlorite (≈42% vs. ≈33% for tills). Flint (Reference Flint1999) interpreted that a sandy surface till associated with the Sturgis moraine in St. Joseph County, Michigan (like our group 3), had high 7 Å/10 Å ratios because of differences in weathering; the surface till had a mean 7 Å/10 Å ratio of ≈1.06, whereas the subsurface till had a mean ratio of ≈0.5. Although he interpreted this difference as indicative of weathering, it could also reflect inherent differences in the clay mineralogy of two different tills, as Monaghan and Larson (Reference Monaghan and Larson1986) reported in their study.
A strong positive correlation (r 2 ≈ 0.88) between percent kaolinite + chlorite and mean percent sand for each group provides support for sediment mixing along the flow line of the Saginaw lobe (Fig. 12A). This finding suggests that tills were enriched in kaolinite by subglacial entrainment of underlying, sandy, kaolinite-rich sediment or sandstone bedrock. Alternatively, but less likely, this relationship could be a result of increased weathering in sandier tills, grain-size fractionation effects of clay minerals, or another unknown process. The moderate positive correlation (r 2 ≈ 0.69) between vermiculite + chlorite contents and sand contents could indicate that weathering of illite and chlorite is occurring in the sandy tills. On the other hand, if weathering was transforming illite and chlorite into kaolinite and vermiculite, we would expect to see lower amounts of illite and chlorite in the sandier tills, with higher kaolinite and vermiculite contents; we do not observe this relationship. All the till samples have similar amounts of illite and chlorite, and there is only a very low and positive correlation (r 2 = 0.03) between illite and sand contents, not the negative correlation that would be expected if illite was weathering into kaolinite and vermiculite.

Figure 12. Scatter plots showing relationships among sand contents, clay mineral contents, and location along the flow line for the Saginaw lobe tills. (A) Mean kaolinite + chlorite (mostly kaolinite, as chlorite is probably <10%, see “Discussion”) vs. sand contents. We interpret that kaolinite is coming from sandstone bedrock and older glacial sediments. (B) Distance from the Saginaw Lake plain samples (Fig. 6) to the midpoint of each group. The lake plain samples have the lowest amounts of kaolinite, which increases down-ice.
We propose that kaolinite in the sandy tills was entrained in the basal traction zone of the Saginaw lobe, along with sands from crushed and abraded sandstone bedrock and older glaciogenic sediments. Previous studies support our hypothesis for sources of kaolinite for Saginaw lobe tills. Studies of the clay mineralogy of the sedimentary bedrock in Michigan are limited, but they do suggest that offshore marine shales are illite-rich, and nearshore shales and sandstones are kaolinite-rich. Chung's (Reference Chung1973) data on the clay mineralogy of the Coldwater Shale in western lower Michigan showed lower 7 Å/10 Å ratios than for shales in eastern Michigan. Chung explained this variation by interpreting the western facies of the Coldwater unit as marine shale distal to terrigenous sources of clay, which are enriched in illite. Coldwater Shale in eastern Michigan was interpreted to be nearshore marine shale, more proximal to terrigenous sources of clay, and therefore more enriched in kaolinite. Global studies of detrital clays in marine and nearshore marine clays link illite and kaolinite formation to weathering in different climates, the types of rocks being weathered, and spatial variations in deposition of illite and kaolinite between nearshore and offshore sites (Fagel, Reference Fagel, Hillaire-Marcel and De Vernal2007). Vanderlip and Colgan (Reference Vanderlip and Colgan2015) analyzed the clay mineralogy of five samples of shale and sandstone from the (marginal marine) Saginaw Formation, exposed near Grand Ledge, Michigan, and found they had high mean 7 Å/10 Å ratios of 1.35 ± 0.56 (Table 4). They also analyzed distal marine Coldwater Shale from an Ottawa County core and found 7 Å/10 Å ratios of 0.71 ± 0.26 (Table 4), similar to those Chung (Reference Chung1973) had presented for western lower Michigan. Another more direct source of kaolinite for the Saginaw lobe would have been the underlying Fulton till, which has higher 7 Å/10 Å ratios, similar to those of the Saginaw Formation and the proximal Coldwater Shale facies that subcrops in Saginaw Bay (Fig. 10B). Therefore, we suggest that the higher 7 Å/10 Å ratios in the tills with increasing distance from the source of lacustrine clays probably reflects increased entrainment of kaolinite; this kaolinite was likely derived from the subcropping Pennsylvanian sandstones (Saginaw Formation) in central Lower Michigan, as well as from the subsurface Fulton till (Monaghan and Larson, Reference Monaghan and Larson1986).
In summary, we interpret that illite-rich sediments from the glacial Lake Saginaw plain were mixed with sandy, kaolinite-rich bedrock and preexisting sediment. The sandy, kaolinite-rich materials diluted the finer-textured, illite-rich, lake clay sediments with distance along the flow line of the Saginaw lobe. Sandstone bedrock was likely entrained, crushed, and abraded in the subglacial zone, but mixing of preexisting sediments also played an important role in producing the observed spatial patterns we see in the clay mineralogy.
A subglacial sediment-mixing process model for till genesis
We interpret our textural groups, PCA analysis, and clay mineralogy data as supportive of a subglacial sediment-mixing process model. Sediment mixing occurred during entrainment, transport, and deposition of till. Existing process models have explained bimodal till textures as being exclusively a result of crushing and abrasion of source bedrock (Dreimanis and Vagners, Reference Dreimanis, Vagners and Goldthwait1971; Boulton, Reference Boulton1978; Haldorsen, Reference Haldorsen1981; Shilts Reference Shilts1993; Altuhafi and Baudet, Reference Altuhafi and Baudet2011). These process models do not take into account the mixing of preexisting sediments with crushed and abraded bedrock. Our sediment-mixing process model explains bimodal till textures as varying between two textural endmembers and varying spatially along a glacial flow line >150 km long. In the case of the Saginaw lobe, illite-rich lacustrine clays were entrained in basal ice by freeze-on and then mixed and diluted down-ice with sandy sediment entrained from sandstone bedrock and older glaciogenic sediments, resulting in tills that become increasingly sandy and kaolinite-rich. Additionally, our data suggest that bedrock composition and distribution must be considered to better explain till sheet textural variation.
The observed distribution of till textures (Fig. 4) plotted on a ternary diagram (Fig. 13) supports our sediment-mixing process model. Our till texture data plot along a classic “mixing line” between the sand endmember of the ternary diagram and an ~50/50% silt–clay zone along the clay–silt (clay, silty clay) side of the ternary plot (Fig. 13A). If crushing and abrasion of bedrock were the only subglacial processes occurring, we should see the distribution of samples plot along a “mixing line” between sand and silt endmembers (Fig. 13B). Previous studies have argued that these crushing and abrasion processes produce sand from the crushing of bedrock and silt from abrasion of sand and gravel grains. Clay cannot form by abrasion, because sand is the “terminal grade” for crushing bedrock, and silt is the “terminal grade” for abrasion of mineral grains; clay-sized material must be formed by chemical weathering (Dreimanis and Vagners, Reference Dreimanis, Vagners and Goldthwait1971; Boulton, Reference Boulton1978; Shilts, Reference Shilts1993; Benn and Evans, Reference Benn and Evans2010; Evans et al., Reference Evans, Phillips, Hiemstra and Auton2006).

Figure 13. Two process models that can be used to explain down-ice changes in till textures, shown on a background of a standard NRCS textural triangle. (A) A process model that explains till texture as mixing of sandstone bedrock and outwash-derived sediment with lake sediment dominated by clay + silt would predict till textures falling along the mixing line shown by the double arrow. In the Saginaw lobe terrain, the down-ice trend is toward the sand endmember of the textural triangle. (B) A purely crushing and abrasion process model predicts that till textures would fall along the double arrow, as coarse-textured sands from sandstone bedrock and outwash would be experience diminution by processes of crushing of sandstone and abrasion of sand-sized grains producing silt. Any clay produced would have had to be present in the original sandstone bedrock or sediments, as the abrasion process cannot produce clay-sized grains.
Many studies in both Fennoscandia and Canada document that surface tills reflect local bedrock types, as well as far-traveled material reduced in size by crushing and abrasion, and that till composition can be used to map and trace mineral ores in bedrock-dominated terrains (e.g. Shilts, Reference Shilts1984, Reference Shilts1993). Although it is clear that crushing and abrasion of bedrock were active subglacial and englacial processes under the Saginaw lobe, mixing of preexisting sediment must also have been an important process in producing the texture and clay mineral variations we observe. The actual processes that would mix sediments likely include well-documented subglacial and englacial processes such as debris-rich ice deformation, subglacial sediment deformation, subglacial melting and regelation, bed plowing by larger clasts, and melt-out of englacial debris during deposition (for a discussion, see Evans et al., Reference Evans, Phillips, Hiemstra and Auton2006; Benn and Evans, Reference Benn and Evans2010).
A large body of literature documents dispersal plumes in till sheets and indicates mixing, down-ice dilution, and diffusion of entrained bedrock and sediment (Shilts, Reference Shilts1984, Reference Shilts1993; Hooke et al., Reference Hooke, Cummings, Lesemann and Sharpe2013). Shilts (Reference Shilts1993) pointed out that spatial data must be interpreted carefully and that bedrock source type, topography, grain-size partitioning effects, and ice-flow direction variations can greatly influence the shape and concentrations of indicators in till plumes and success or failure in tracing bedrock sources. Hooke et al. (Reference Hooke, Cummings, Lesemann and Sharpe2013) explained how distinctive bedrock types are entrained in basal ice and then spread out and diluted by subglacial and englacial mixing and diffusion processes down-ice. They described basal freeze-on of sediment and bedrock entraining material into basal ice, which was then mixed, diluted, and diffused both vertically and laterally down-ice and in the resulting till sheets. We envision similar processes occurring in the Saginaw lobe. The Saginaw lobe advanced up the regional slope out of Saginaw Bay. This situation would have provided an ideal zone of basal freeze-on near the ice margin (as a frozen glacier toe) and in areas advancing over permafrost terrain similar to that documented in the Green Bay lobe of southeastern Wisconsin (Attig et al., Reference Attig, Mickelson and Clayton1989; Colgan and Mickelson, Reference Colgan and Mickelson1997; Clayton et al., Reference Clayton, Attig and Mickelson2001; Cutler et al., Reference Cutler, MacAyeal, Mickelson, Parizek and Colgan2000; Winguth et al., Reference Winguth, Mickelson, Colgan and Laabs2004). Freeze-on of sandstone-rich late Paleozoic bedrock would have been an active process in marginal areas.
A sediment-mixing process model would be expected to be most useful in landscapes dominated by sedimentary bedrock covered with glaciogenic sediments that reflect the local bedrock. The traditional process model of crushing and abrasion has commonly been most useful in bedrock-dominated terrains with only a thin cover of glaciogenic sediments (Dreimanis and Vagners, Reference Dreimanis, Vagners and Goldthwait1971; Haldorsen, Reference Haldorsen1981). Although entrained bedrock and preexisting sediment was surely crushed and abraded in the basal traction zone of the Saginaw lobe, a sediment-mixing process model better explains our lobe-scale observations of mixing between upstream illite-rich clay and the downstream coarsening of till textures and its down-ice enrichment of kaolinite from sandstone bedrock and preexisting sandy sediment (Figs. 12 and 13).
In summary, our data support a model wherein the advancing Saginaw lobe ponded proglacial water, leading to deposition of lake clays, and then entrained some of that sediment and transported and deposited it down-ice as till and other glaciogenic sediments. In this model, clay contents in the tills diminish down-ice as they become diluted with other sediments derived from preexisting tills, glaciofluvial sediment, and eroded bedrock. This type of sediment-mixing process model helps explain much of the spatial variation in till textures across the Saginaw terrain.
CONCLUSIONS
Our landsystem approach to studying the tills of the Saginaw lobe terrain indicates that, across this landscape, tills have many shared attributes, similar colors and clay mineralogy, and they are uniformly calcareous, suggestive of a broadly similar geologic history. Most of the tills are bimodal in grain-size attributes, with clear clay–fine silt and sand modes; they have little of the coarser silt and very fine sand fractions typically seen in tills dominated by crushing and abrasion processes in a basal traction zone in bedrock-dominated terrains. We conclude that a sediment-mixing process model better explains till genesis and spatial variation for the Saginaw lobe.
The textural diversity in the till groups across the Saginaw terrain occurs primarily due to varying mixtures of otherwise similar types of (1) clay–fine silt and (2) sandy sediments. The generally illite-rich composition of clays and their variation across the terrain indicate that the tills have a common source of fine sediment—lacustrine sediment from an older glacial Lake Saginaw. A variety of proglacial lakes formed in the Saginaw lowlands during deglaciation, allowing lacustrine sediments to form in shallow lake basins. Similar conditions would have likely occurred during ice advance, setting up the possibility of Saginaw lobe ice dredging up its own lacustrine clays and silts, depositing them down-ice as clay-rich tills. A scenario in which the advancing ice also entrained and transported proglacial sands from fans, kame deltas, and outwash surfaces also cannot be discounted, especially for sites in the southern part of the terrain, where the landscape generally slopes away from the ice; the tills here are sandy but also have distinct clay–fine silt modes.
Along the axis of the Saginaw lobe terrain, bedrock is shallow, and late Paleozoic sandstone units dominate over shales, which are more common underlying Saginaw Bay. Thus, we argue that tills get progressively sandier down-ice because lake clays became diluted by increasing amounts of sand scoured from bedrock and preexisting glacigenic sediments. Nonetheless, even the sandiest tills retain a small clay mode in their grain-size distributions. Some of the kaolinite in the tills also likely was derived from sandstone bedrock and preexisting tills such as the Fulton till. The systematic increase in kaolinite down-ice supports our sediment-mixing process model of inclusion of sandstone bedrock and preexisting glaciogenic sediments into the surface tills of the Saginaw lobe terrain.
The most clay- and silt-rich tills occur on the flanks of the Saginaw terrain, where sandstone bedrock is buried more deeply. Both of these areas of clay-rich tills abut nearby topographic uplands. We argue that advancing (or retreating and subsequently readvancing) ice would have ponded water in these areas, depositing fine sediment in proglacial lakes. Readvances likely entrained these clays and mixed them into tills. Thus, tills in the Clare Rolling Hills are the most clay-rich of any across the Saginaw terrain, and the silty tills near Flint have large amounts of clay + fine silt.
ACKNOWLEDGMENTS
We thank Michigan State University's Department of Geography, Environment, and Spatial Sciences for supporting this student-led, seminar-based research project, and Zach Chamberlin for field assistance. We acknowledge support from the National Science Foundation (NSF) grant GSS-1759528 for parts of this study. Any opinions, findings, and conclusions or recommendations expressed are, however, those of the authors and do not necessarily reflect the views of NSF.


