1. INTRODUCTION
The Global Navigation Satellite System (GNSS) Single Point Positioning (SPP) technique has been widely used in many fields such as vehicle navigation, geographic information systems and land surveying due to its simple operation and data processing (Lee, Reference Lee1986; King and Aoki, Reference King and Aoki2003; Satirapod et al., Reference Satirapod, Rizos and Wang2001). SPP can be achieved based on single-frequency or dual-frequency code measurements (Xu, Reference Xu2007). The dual-frequency SPP technique is applied in GNSS positioning since the ionospheric delay effect, which can vary from a few metres to more than twenty metres within one day, can be basically eliminated through ionosphere-free combination (Xu, Reference Xu2007). Nevertheless, single-frequency GNSS receivers are still widely used in most positioning and navigation applications due to their low costs (Le and Tiberius, Reference Le and Tiberius2007; Odolinski and Teunissen, Reference Odolinski and Teunissen2016; Orus-Perez, Reference Orus-Perez2017; Øvstedal, Reference Øvstedal2002). To benefit the vast number of single-frequency GNSS users, this paper will focus on the improvement of Single-Frequency SPP (SF-SPP).
Compared with Precise Point Positioning (PPP) (Zumberge et al., Reference Zumberge, Heftin, Jefferson, Watkins and Webb1997) and relative positioning (Janes et al., Reference Janes, Langley and Newby1991), the SPP technique uses neither the precise orbit and clock products nor the high-precision phase observations. This means its accuracy was limited to several metres, attributed to the existence of systematic errors. Over the past few years, strategies to improve the accuracy of SPP have mainly focussed on two aspects: improving the quality of civil code observations and broadcast satellite ephemeris (Montenbruck et al., Reference Montenbruck, Steigenberger and Hauschild2015; Steigenberger and Montenbruck, Reference Steigenberger and Montenbruck2017; Wanninger and Beer, 2014) and reducing the effect of atmospheric delay as much as possible (Hopfield, Reference Hopfield1971; Klobuchar, Reference Klobuchar1987). Benefitting from the modernisation of GNSS systems, the current precision of Global Positioning System Coarse Acquisition (GPS C/A) pseudorange is approximately 0·3 m (Yang et al., Reference Yang, Li, Wang, Xu, He, Guo, Shen and Dai2014) and the Signal-In-Space Ranging Error (SISRE) of GPS broadcast ephemeris is about 0·7 m (Montenbruck et al., Reference Montenbruck, Steigenberger and Hauschild2015). In the study of tropospheric delay models, the meteorological parameter models, such as the modified Saastamoinen and Hopfield models, are summarised in Xu (Reference Xu2007). In the study of ionospheric delay models, a ten-parameter Klobuchar-like model for mitigating the ionospheric delay for GNSS single-frequency users has been proposed by Wang et al. (Reference Wang, Yuan, Li and Huo2016). With the efforts in these two areas, the current positioning accuracy of GPS SPP can reach about 1–2 m in the horizontal component and 2–3 m in the vertical component (Pan et al., Reference Pan, Cai, Santerre and Zhang2016; Steigenberger and Montenbruck, Reference Steigenberger and Montenbruck2017).
The Chinese BeiDou Navigation Satellite System (BDS) is designed to provide Positioning, Navigation, and Timing (PNT) information for global users (CSNO, 2016). On 27 December 2012, BDS was officially declared to provide navigation and position services over the Asia-Pacific region with five Geostationary Orbit (GEO) satellites, five Inclined Geosynchronous Orbit (IGSO) satellites, and four Medium Earth Orbit (MEO) satellites (Jin et al., Reference Jin, Jin and Li2016; Montenbruck et al., Reference Montenbruck, Hauschild, Steigenberger, Hugentobler, Teunissen and Nakamura2013). The global BDS constellation is expected to be fully operational by the end of 2020, and consists of five GEO, three IGSO, and 27 MEO satellites (Shi et al., Reference Shi, Zhao, Hu and Liu2013). With the rapid development of BDS, the performance of BDS SPP has been evaluated by many researchers (e.g., Guo et al., Reference Guo, Zhang and Wang2015; Shi et al., Reference Shi, Zhao, Hu and Liu2013; Yang et al., Reference Yang, Li, Wang, Xu, He, Guo, Shen and Dai2014). Using the B1 code measurements from three GEO and three IGSO satellites, BDS SPP with an accuracy of 20 m was first presented in Shi et al. (Reference Shi, Zhao, Hu and Liu2013). Since only three GEO and three IGSO satellites could not form a good constellation geometry at that time, the accuracy of the north component was inferior to the east component (Shi et al., Reference Shi, Zhao, Hu and Liu2013). After the completion of the regional version of BDS in 2012, Yang et al. (Reference Yang, Li, Wang, Xu, He, Guo, Shen and Dai2014) showed that the BDS SPP accuracy using B1 code measurements is generally better than 6 m (95%) in the horizontal component and 10 m (95%) in the vertical component. Although the performance of BDS SPP with an accuracy of about 10 m was validated by Yang et al. (Reference Yang, Li, Wang, Xu, He, Guo, Shen and Dai2014), the Timing Group Delay (TGD) correction in BDS SF-SPP was not discussed in this research. More recently, a detailed analysis of BDS SF-SPP and dual-frequency SPP was presented in Guo et al. (Reference Guo, Zhang and Wang2015). With the TGD or Differential Code Bias (DCB) correction, they pointed out that an accuracy of 1–2 m in horizontal component and 3–4 m in vertical component can be obtained by BDS B1, B2, or B3 SF-SPP; meanwhile, an accuracy of 1–2 m in the horizontal component and 3–5 m in the vertical component can be obtained by BDS B1B2 or B1B3 dual-SPP. With the ongoing modernisation of GPS and GLONASS, as well as the emergence of BDS and Galileo, multi-GNSS SPP techniques based on GNSS constellations have also aroused great interest in the GNSS community (Cai et al., Reference Cai, Pan and Gao2014; Choi et al., Reference Choi, Cho, Cho and Lee2015; Pan et al., Reference Pan, Cai, Santerre and Zhang2016; Santerre et al., Reference Santerre, Pan, Cai and Zhu2014). As BDS is currently in its development phase, the benefit of data from reference networks to improve BDS SPP accuracy was not discussed in these articles.
Today, the precision of BDS B1 code is approximately 0·4 m (Jiang et al., Reference Jiang, Xi, Chen and Xiao2017) and the SISRE of BDS broadcast ephemeris is about 1·5 m (Montenbruck et al., Reference Montenbruck, Steigenberger and Hauschild2015), which contributes to an accuracy of BDS SF-SPP of 1–2 m in the horizontal components and 3–4 m in the vertical component in the Asia-Pacific area as described in Guo et al. (Reference Guo, Zhang and Wang2015). This level of accuracy cannot provide a positioning service to within 1 m, to address precise navigation and positioning for vehicle and ship users (Chiang et al., Reference Chiang, Noureldin and El-Sheimy2003). The lower accuracy of SPP is attributed to the existence of systematic errors (Xu, Reference Xu2007). On the basis of the principle of spatial correlation of errors, the Differential GNSS (DGNSS) technique can dramatically reduce multiple types of errors over an area of dozens of kilometres in diameter (Kremer et al., Reference Kremer, Kalafus, Loomis and Reynolds1990). In 2012, Shi et al. (Reference Shi, Zhao, Li, Tang, Hu, Lou, Zhang, Niu and Liu2012) did the first evaluation of the performance of BDS pseudorange differential positioning. Accuracies of 2 m and 4 m were achieved in horizontal and vertical directions respectively, superior to the accuracies of 4 m and 20 m of BDS SF-SPP at that time. In their study, however, only one base station was used to generate the pseudorange corrections for the rover station. Currently, the BeiDou Foundation Enhancement System is composed of about 150 national frame-net base stations in China, all of which are homemade devices (http://en.chinabeidou.gov.cn/). These are established through sparsely distributed BDS/GNSS satellite tracking stations, which help to correct the errors from atmosphere, space and other elements in satellite positioning (Liu et al., Reference Liu, Zhang, Liu and Zhang2016). Compared with one station, the pseudorange corrections using a number of more nearby stations’ data for the rover station should further improve the accuracy of SPP. There are currently few studies focusing on the utilisation of pseudorange corrections from base stations for BDS SPP (Shi et al., Reference Shi, Zhao, Li, Tang, Hu, Lou, Zhang, Niu and Liu2012). The wide area differential BDS provides separate error corrections comprising ephemeris errors, clock errors, and atmospheric delay products to users including those in inaccessible regions, such as large bodies of water (Xing et al., Reference Xing, Su, Zhou, Hu, Gong, Liu, He, Guo, Ren, Hu and Zhang2013). Compared with Differential BDS (DBDS), BDS SPP needs more sophisticated techniques and conditions, such as high performance hardware, software and radio links, to maintain a high precision service (Xing et al., Reference Xing, Su, Zhou, Hu, Gong, Liu, He, Guo, Ren, Hu and Zhang2013). In view of these points, an Augmented SPP (A-SPP) method, which uses Combined Residual Error (CRE) products integrated by three base stations for improving BDS SPP is presented in this paper.
This article is organised as follows: Section 2 describes the BDS A-SPP method in detail. Section 3 presents two experiments, a static test using three datasets collected at different latitudes and a kinematic test using one dataset collected by a ship-borne receiver. The corresponding analyses for the two experiments are also shown in Section 3. Finally, the conclusion is given in Section 4.
2. METHODOLOGY
2.1. BDS SPP observation equation
The pseudorange observation on the BDS B1 frequency between a receiver “r” and a satellite “s” can be described by the following equation (Cai et al., Reference Cai, Pan and Gao2014):
 $$P_{r}^{s}= \rho_{r}^{s}+cdt_{r}-cdt^{s}+d_{r,orb}^{s}+d_{r,trop}^{s}+d_{r,ion}^{s}+b^{s}+\varepsilon_{r}$$
where
 $P_{r}^{s}$
is the measured pseudorange on the B1 frequency in metres;
$P_{r}^{s}$
is the measured pseudorange on the B1 frequency in metres;
 $\rho_{r}^{s}$
is the geometric range in metres; c is the speed of light in vacuum in metres per second; dt
r
is the receiver clock offset in seconds; dt
s
is the satellite clock offset in seconds;
$\rho_{r}^{s}$
is the geometric range in metres; c is the speed of light in vacuum in metres per second; dt
r
is the receiver clock offset in seconds; dt
s
is the satellite clock offset in seconds;
 $d_{r,orb}^{s}$
is the satellite orbit error in metres;
$d_{r,orb}^{s}$
is the satellite orbit error in metres;
 $d_{r,trop}^{s}$
is the tropospheric delay in metres;
$d_{r,trop}^{s}$
is the tropospheric delay in metres;
 $d_{r,ion}^{s}$
is the ionospheric delay on the B1 frequency in metres and b
s
is the satellite hardware delay in metres. εr
includes the multipath error and measurement noise in metres.
$d_{r,ion}^{s}$
is the ionospheric delay on the B1 frequency in metres and b
s
is the satellite hardware delay in metres. εr
includes the multipath error and measurement noise in metres.
In Equation (1), the positions and clock offsets of BDS satellites are computed using the broadcast ephemeris data. The residual satellite orbit and clock errors are generally not considered in pseudorange-based absolute positioning. The tropospheric delay is corrected by the Hopfield model using standard meteorological values (Hopfield, Reference Hopfield1971). The ionospheric delay is corrected by Global Ionosphere Mesh (GIM) products released by the Centre for Orbit Determination in Europe (CODE) (ftp://ftp.unibe.ch/aiub/CODE/). The satellite hardware delay bias is corrected by using the TGD provided by BDS broadcast navigation messages. Based on Equation (1), the position coordinates and receiver clock errors can be determined by using the Square Root Information Filter (SRIF) as described in Gu et al. (Reference Gu, Lou, Shi and Liu2015).
2.2. Combined Residual Errors (CRE) product for BDS A-SPP
By providing the precise coordinates of the base station into Equation (1), the residual error
 $\bf{\Delta P_{r}^{s}}$
can be calculated as:
$\bf{\Delta P_{r}^{s}}$
can be calculated as:
 $${\Delta P}_{r}^{s} = P_{r}^{s} - (\hat{\rho}_{r}^{s} + cdt_{r} - cdt^{s} + d_{r,orb}^{s}+d_{r,trop}^{s}+d_{r,ion}^{s}+b^{s}+\varepsilon_{r})$$
where
 $\hat{\rho}_{r}^{s}$
is the corrected geometric range in metres. The other items in Equation (2) are the same as those defined in Equation (1). It should be mentioned that the precise coordinates of the base station are known. The receiver clock offset dt
r
of the base station is estimated by the conventional SPP solution as shown in Section 2.1. The processing schemes for other items such as
$\hat{\rho}_{r}^{s}$
is the corrected geometric range in metres. The other items in Equation (2) are the same as those defined in Equation (1). It should be mentioned that the precise coordinates of the base station are known. The receiver clock offset dt
r
of the base station is estimated by the conventional SPP solution as shown in Section 2.1. The processing schemes for other items such as
 $dt^{s}, d_{r,orb}^{s}, d_{r,trop}^{s}, d_{r,ion}^{s}$
, and b
s
in Equation (2) are described in Section 2.1.
$dt^{s}, d_{r,orb}^{s}, d_{r,trop}^{s}, d_{r,ion}^{s}$
, and b
s
in Equation (2) are described in Section 2.1.
Figure 1 shows a schematic of the base stations A, B, and C shaped as a triangle and rover station u in an A-SPP solution. The grey part in Figure 1 represents the atmospheric region. With regard to one epoch,
 $\Delta P_{A}^{S}$
,
$\Delta P_{A}^{S}$
,
 $\Delta P_{B}^{S}$
, and
$\Delta P_{B}^{S}$
, and
 $\Delta P_{C}^{S}$
estimated by Equation (2) are the pseudorange residual errors between the satellite S and base stations A, B, and C, respectively. d
1, d
2, and d
3 are the distance between rover station u and base station A, B, and C, respectively.
$\Delta P_{C}^{S}$
estimated by Equation (2) are the pseudorange residual errors between the satellite S and base stations A, B, and C, respectively. d
1, d
2, and d
3 are the distance between rover station u and base station A, B, and C, respectively.
 $\Delta P_{u}^{S}$
is the CRE product, which can be obtained from
$\Delta P_{u}^{S}$
is the CRE product, which can be obtained from
 $\Delta P_{A}^{S}$
,
$\Delta P_{A}^{S}$
,
 $\Delta P_{B}^{S}$
, and
$\Delta P_{B}^{S}$
, and
 $\Delta P_{C}^{S}$
through interpolation techniques such as the Inverse Distance Weighted (IDW) interpolation (Kravchenko and Bullock, Reference Kravchenko and Bullock1999). However, the Satellite Elevation Angle Weighted (SEAW) average is more suitable for acquiring
$\Delta P_{C}^{S}$
through interpolation techniques such as the Inverse Distance Weighted (IDW) interpolation (Kravchenko and Bullock, Reference Kravchenko and Bullock1999). However, the Satellite Elevation Angle Weighted (SEAW) average is more suitable for acquiring
 $\Delta P_{u}^{S}$
by processing an amount of data in this study The
$\Delta P_{u}^{S}$
by processing an amount of data in this study The
 $\Delta P_{u}^{S}$
is computed by a weighted average of the triangle network shown in Figure 1:
$\Delta P_{u}^{S}$
is computed by a weighted average of the triangle network shown in Figure 1:
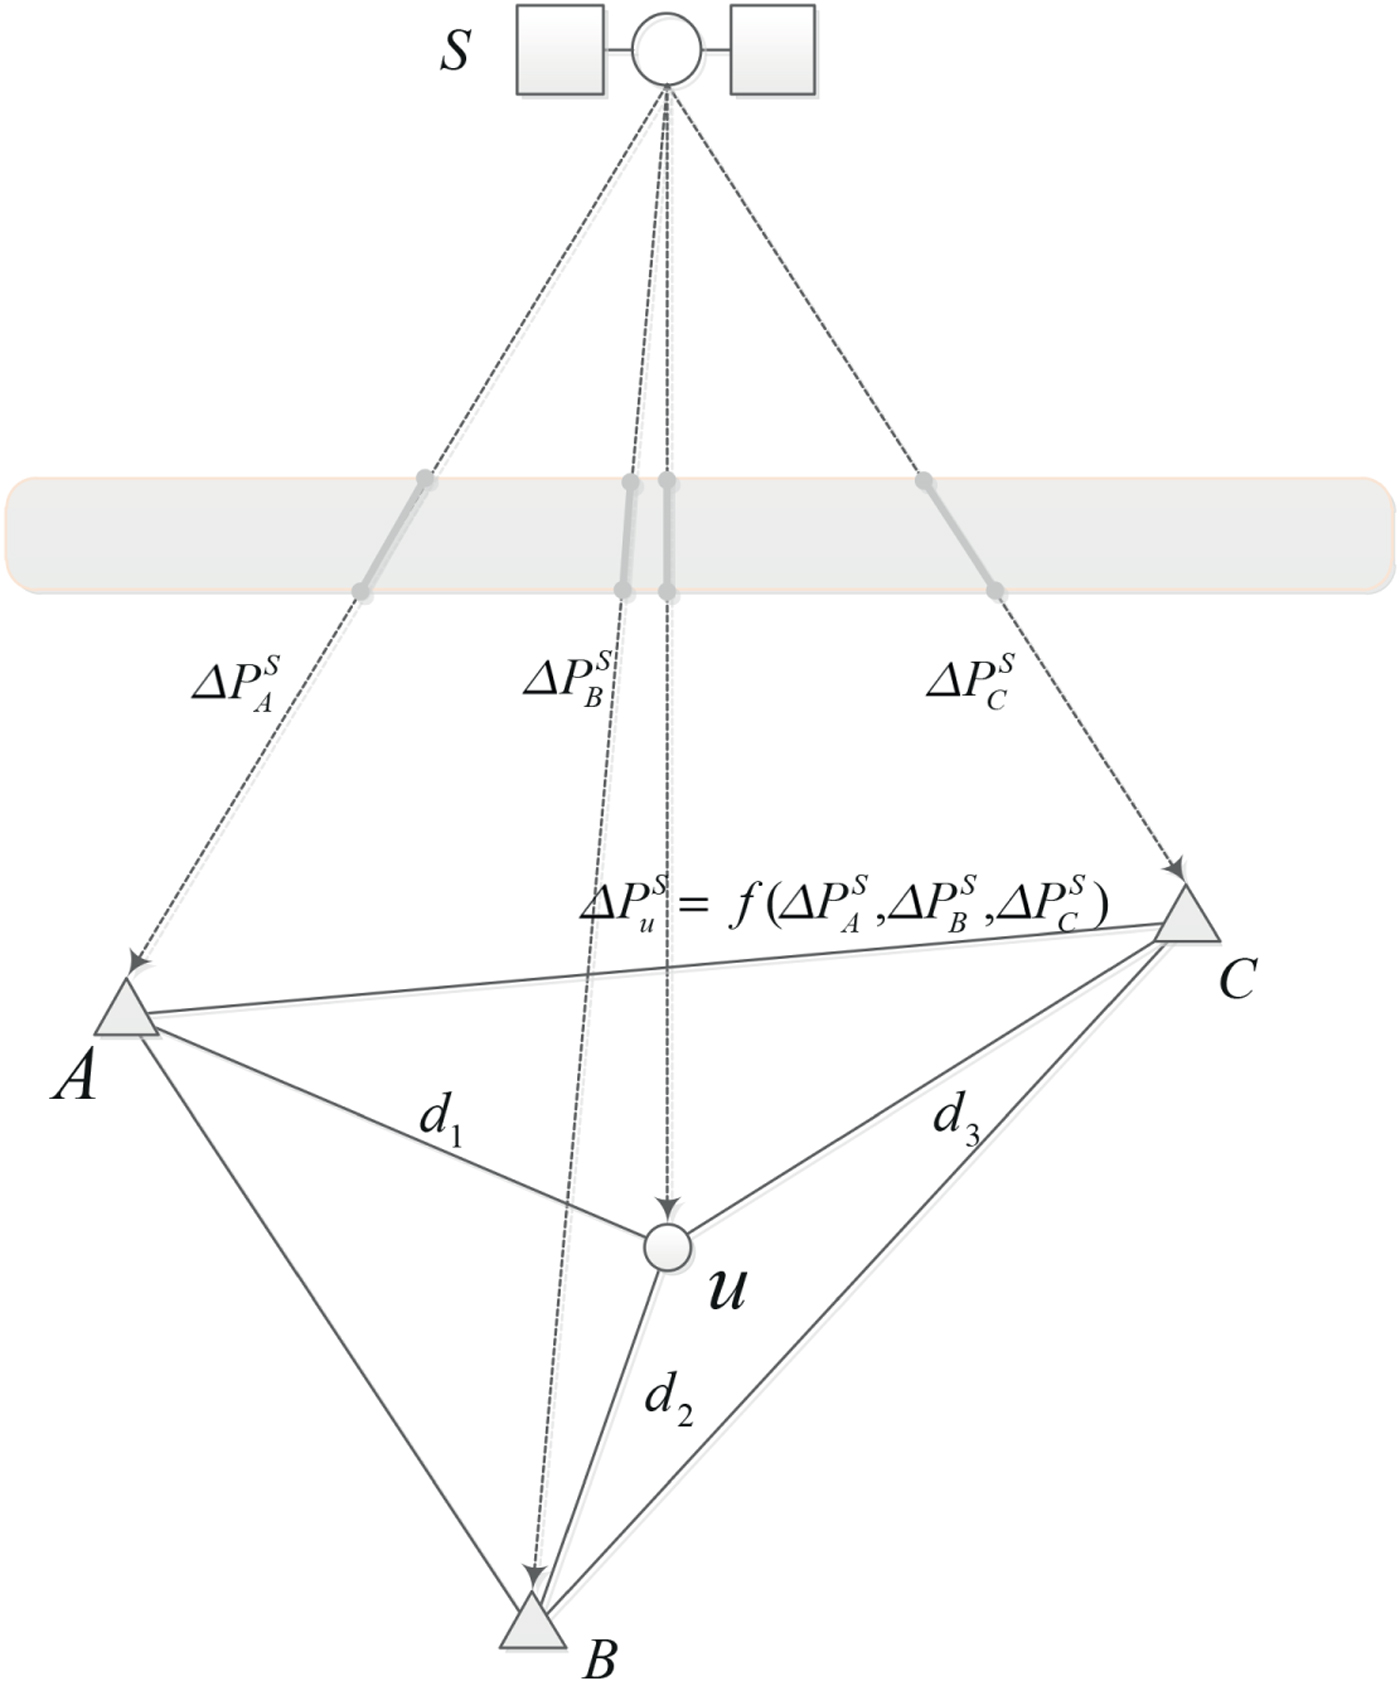
Figure 1. Schematic of the base stations A, B, and C and rover station u in A-SPP solution.
 $$\Delta P_{u}^{S}={\Delta P_{A}^{S}{\cdot}W_{A}^{S}+\Delta P_{B}^{S}{\cdot}W_{B}^{S}+\Delta P_{C}^{S}{\cdot}W_{C}^{S} \over W_{A}^{S}+W_{B}^{S}+W_{C}^{S}}$$
where the weight
 $W_{R}^{S}$
can be obtained as:
$W_{R}^{S}$
can be obtained as:
 $$W_{R}^{S}= \left\{ \matrix{{sinE}_{R}^{S} & E_{R}^{S}<40^{\circ} \cr 1 \hfill & E_{R}^{S}\ge 40^{\circ}}\right.$$
where
 $E_{R}^{S}$
is the satellite elevation angle for satellite S at station R. As the measurement noise increases with the decreasing satellite elevation angle, the solutions with elevation angles smaller than 40° are down-weighted. Note that the threshold of 30° was shown in Luo (Reference Luo2013), but 40° was empirically determined in this study through comprehensive experiment.
$E_{R}^{S}$
is the satellite elevation angle for satellite S at station R. As the measurement noise increases with the decreasing satellite elevation angle, the solutions with elevation angles smaller than 40° are down-weighted. Note that the threshold of 30° was shown in Luo (Reference Luo2013), but 40° was empirically determined in this study through comprehensive experiment.
The A-SPP method can be divided into three steps. First, we obtain the observation residual errors of each observed BDS satellite epoch-by-epoch for the selected three base stations by using the conventional SPP solution. Then, based on the SEAW technique, the CRE product for each BDS satellite observed by the rover station can be calculated. Finally, by subtracting the corresponding CRE value, we can obtain the corrected code observations for each epoch to perform the A-SPP solution. The framework of the A-SPP service is mainly comprised of four parts, i.e. reference network, data processing centre, radio link, and users. In an A-SPP application, the real-time users could acquire the coordinates through two models, i.e. Reference Correction Model (RCM) and Processing Centre Model (PCM). In RCM, the CRE products are handled by the data processing centre, while the coordinate information is processed by the users. For PCM, both the CRE products of base stations and positioning coordinates of users are handled by the data processing centre.
3. EXPERIMENTS AND RESULTS
3.1. Static test for different latitude stations
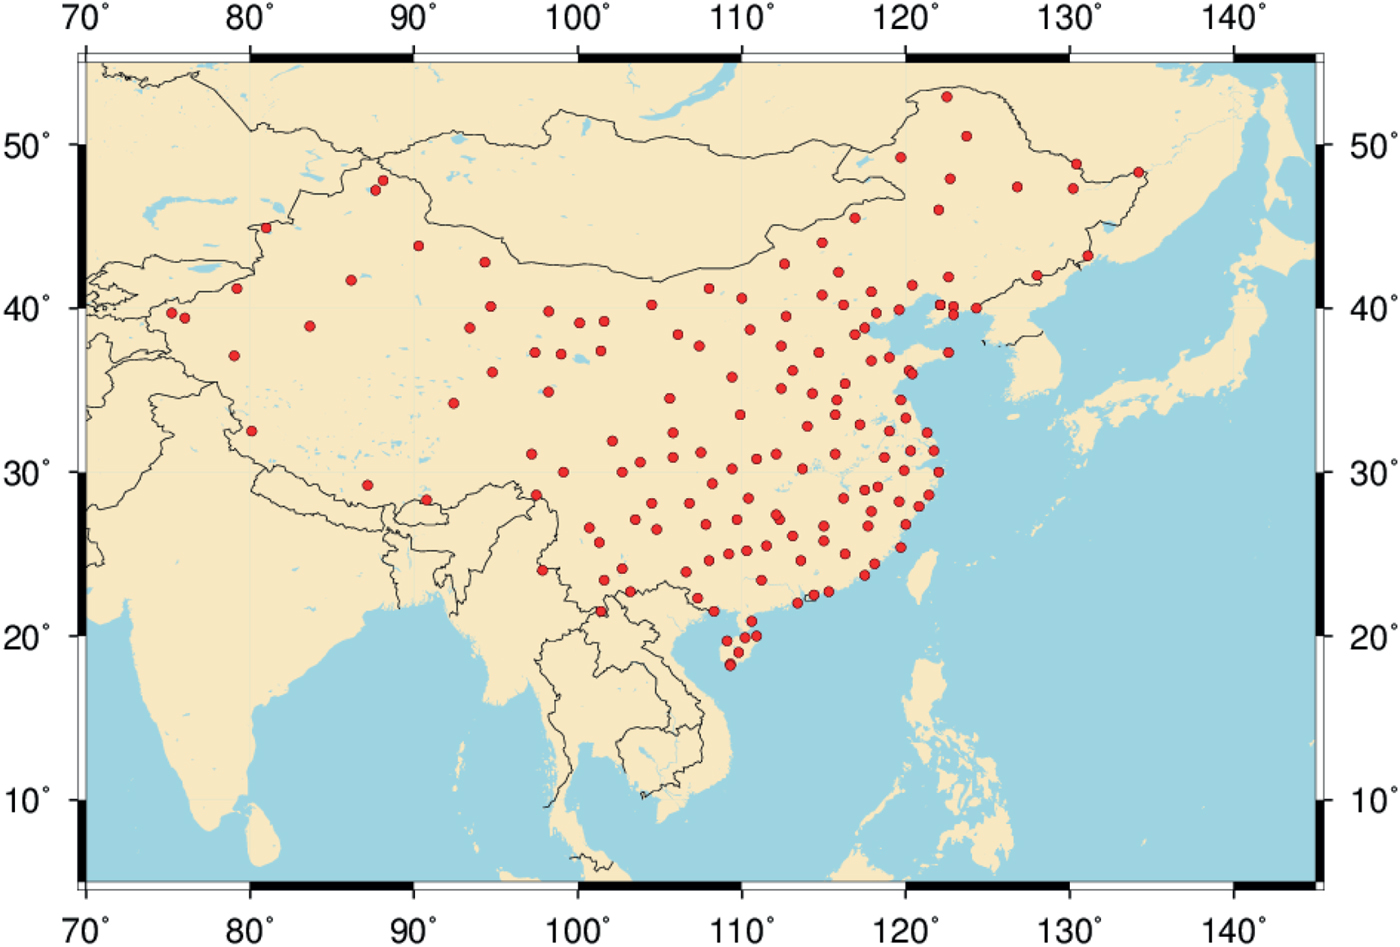
In this experiment, we used the BDS data from the sparse reference network of the BeiDou Foundation Enhancement System. Currently, there are about 150 continuous operation tracking stations that are sparsely distributed as shown in Figure 2. The average distance between two stations in the sparse reference network is about 170 km. Three BDS datasets collected at higher latitude (40°N–50°N), mid-latitude (30°N–40°N), and low-latitude (20°N–30°N) in China from 1 November (DOY 306) to 30 November (DOY 335) 2016 were used to evaluate the performance of the BDS A-SPP solution. The geographical distribution of the 12 stations, including nine base stations and three experiment stations is shown in Figure 3. It should be noted that the data for 3 November for DZJX, 10 November for CHZL, and 20 November for all 12 stations are missing due to problems with data recording. All observations are post-processed and recorded at a sampling interval of 30 s. The satellite elevation mask angle is set to 7°. The precise coordinates of these stations are calculated through the PPP solution by the Position And Navigation system Data Analyst (PANDA) software developed by Wuhan University in China (Liu and Ge, Reference Liu and Ge2003; Shi et al., Reference Shi, Zhao, Geng, Lou, Ge and Liu2008).

Figure 2. Geographical distribution of tracking stations of the BeiDou Foundation Enhancement System.
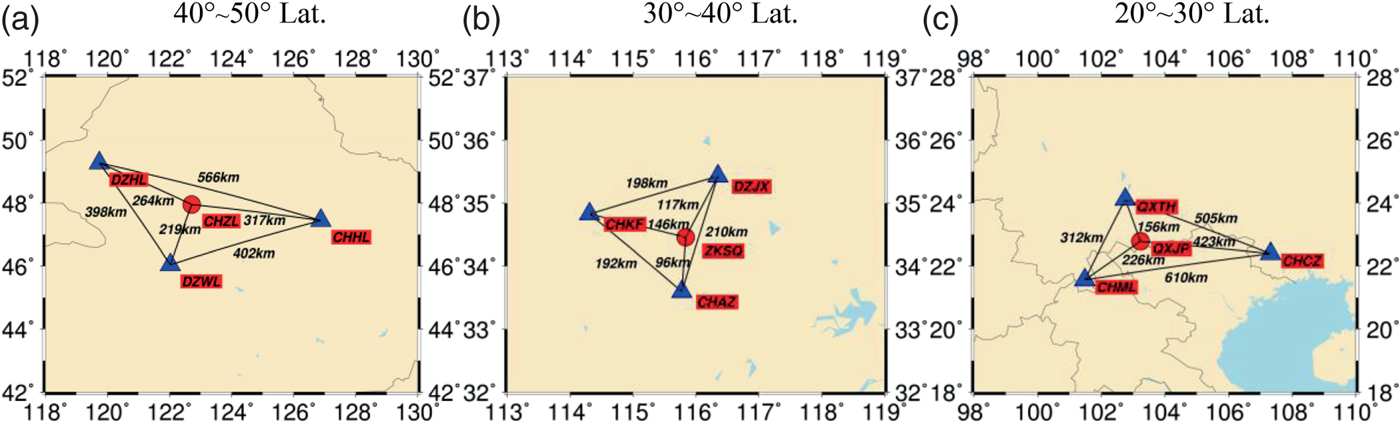
Figure 3. Geographical distribution of nine base stations (triangle) for generating CRE products and three experiment stations (circle) for positioning.
In order to investigate the performance of the A-SPP solution, the results of BDS A-SPP using the datasets collected at CHZL, ZKSQ, and QXJP stations on 5 November 2016 are presented here. Figure 4 shows the time series of positioning errors for BDS SPP and A-SPP in the east, north, and up directions, respectively. The corresponding Root Mean Square (RMS) values of positioning errors over the whole day are presented in the top-left of each panel. Compared with the blue curves for SPP, the red ones for A-SPP show a consistent approach in the three directions for all three stations located in different latitude ranges. Figure 4 illustrates that the positioning performance of A-SPP is much better than SPP. The improvement of the A-SPP solution on the positioning accuracy is approximately 84·9%, 77·9% and 78·4% for CHZL, 82·9%, 63·9% and 79·1% for ZKSQ, and 82·8%, 66·5% and 62·5% for QXJP when compared with the SPP solution in the east, north and up directions, respectively.

Figure 4. Positioning errors of SPP and A-SPP using BDS satellites data collected at CHZL (40°N–50°N), ZKSQ (30° N–40°N), and QXJP (20°N–30°N) stations in China on 5 November 2016. The RMS values of SPP and A-SPP are presented in the top-left of each panel.
Figure 5 shows the code residuals of BDS B1I for the SPP and A-SPP solutions. Different colours represent different BDS satellites. As can be seen from this picture, most of the observation residuals of the SPP solution vary within a range of −3–3 m, whereas most of those for the A-SPP solution vary in a smaller range of −1–1 m. Statistical results demonstrate that the RMS values of code residuals for SPP are 0·709 m, 0·707 m, and 0·759 m for CHZL, ZKSQ, and QXJP stations respectively, while the values for A-SPP are only 0·151 m, 0·231 m and 0·202 m. The results apparently illustrate that most observation noise and un-modelled errors in the SPP solution are significantly reduced by the A-SPP solution. In Figure 5, it can also be observed that the magnitudes of a few observation residuals for A-SPP are larger than those for SPP. For example, the absolute values of BDS satellite C11 observation residuals of QXJP station for A-SPP change from 1·118 m to 1·459 m during the BDS time from 16:09 to 16:13, which is larger than those for SPP, varying from 0·885 m to 0·978 m. There are two reasons for this. First, C11 was not tracked by the base station CHML and QXTH (see Figure 3) from 16:09 to 16:13, so only one station as CHCZ contributed to generate the CRE product for satellite C11 during this period. Second, the long distance between the experiment station QXJP and the base station CHCZ (a distance of 423 km, see Figure 3) would reduce the spatial correlation of the two stations. Therefore, the unstable CRE product of C11 from 16:09 to 16:13 would bring relatively large residual errors in A-SPP. In addition, the satellite elevation angle of C11 decreased from 10·6° to 10·1° from 16:09 to 16:13, which is a low elevation range. It is obvious that the large code observation residuals occur more frequently at low elevation (Shi et al., Reference Shi, Zhao, Hu and Liu2013; Yang et al., Reference Yang, Li, Wang, Xu, He, Guo, Shen and Dai2014).

Figure 5. Observation residuals of SPP and A-SPP for all observed BDS satellites collected at CHZL (40° N–50° N), ZKSQ (30° N–40° N), and QXJP (20° N–30° N) stations in China on 5 November 2016. Each BDS satellite uses one colour to represent its residual errors, as indicated in the colour bar
GPS differential positioning with pseudorange observations can achieve an accuracy at the metre-level since it can eliminate or dramatically reduce multiple types of error sources such as the clock offsets of receivers and satellites, and atmospheric delay errors (Shi et al., Reference Shi, Zhao, Li, Tang, Hu, Lou, Zhang, Niu and Liu2012). To compare the performance of pseudorange DBDS and A-SPP solutions, the positioning errors of DBDS and A-SPP using B1I measurements are shown in Figure 6. In the DBDS solution, the nearest base stations, i.e. DZWL, CHAZ, and QXTH are selected as the reference stations corresponding to the rover stations CHZL, ZKSQ and QXJP (see Figure 3). From Figure 6, it can be seen that the fluctuations of positioning errors for DBDS and A-SPP solutions are, in general, very similar. However, the time series of positioning errors for A-SPP are more stable than those for DBDS. The accuracy of DBDS is better than 0·7 m and 1·2 m in the horizontal and vertical directions, respectively, while the performance of A-SPP is better than 0·4 m and 0·7m. The improvement of the A-SPP solution on the positioning accuracy is approximately 10·2%, 34·3% and 26·7% for CHZL, 12·9%, 18·3% and 17·4% for ZKSQ, and 55·2%, 50·8% and 45·3% for QXJP over the DBDS solution in the east, north and up directions, respectively.

Figure 6. Positioning errors of DBDS and A-SPP using BDS satellites data collected at CHZL (40°N–50°N), ZKSQ (30° N–40°N) and QXJP (20°N–30°N) stations in China on 5 November 2016. The RMS values of DBDS and A-SPP are presented in the top left of each panel.
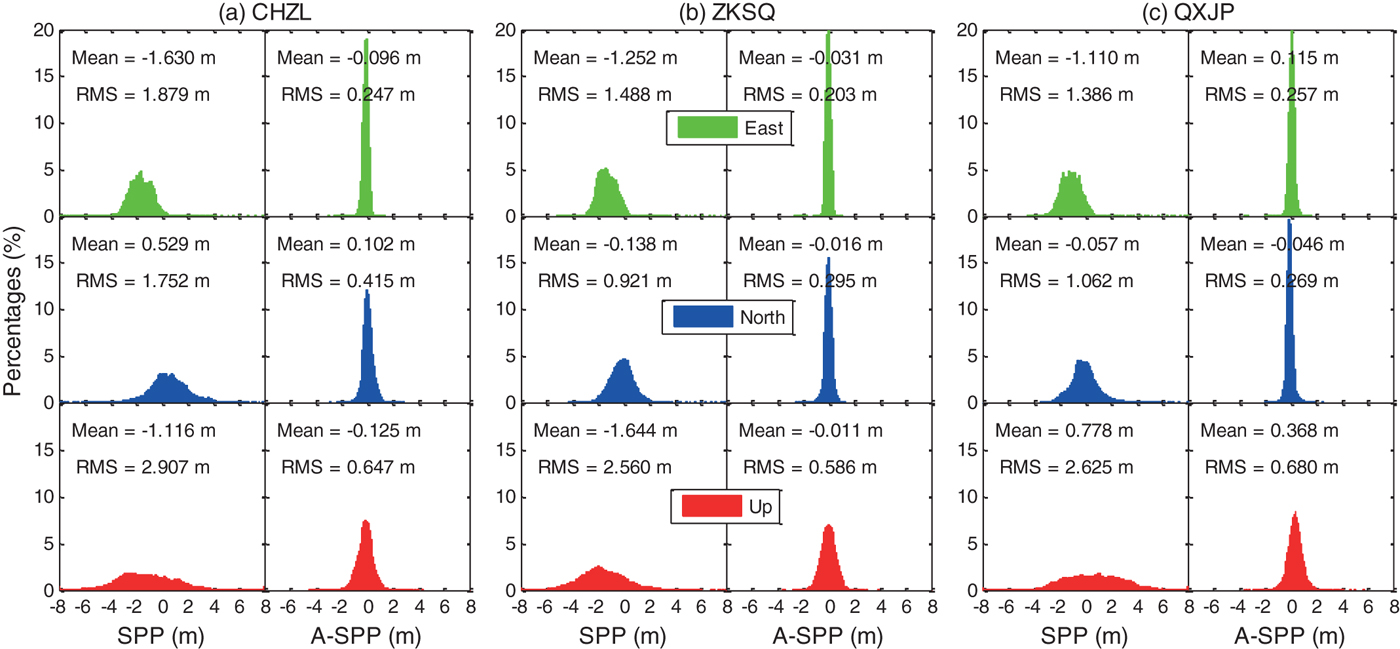
To further evaluate the A-SPP solution, one month of BDS data collected at CHZL (40°N–50°N), ZKSQ (30°N–40°N), and QXJP (20°N–30°N) stations from 1 November to 30 November in 2016 are processed by both SPP and A-SPP methods. The distribution of positioning errors of SPP and A-SPP in the east, north, and up directions are shown in Figure 7. The statistical results, in terms of mean values and RMS values, are also presented in each panel of Figure 7. It can be seen that the positioning errors in all three directions for A-SPP follow the normal distribution better than those of SPP. The RMS Three-Dimensional (3D) values of SPP for CHZL, ZKSQ and QXJP are 3·880 m, 3·101 m and 3·152 m, respectively, while the values of A-SPP are 0·807 m, 0·687 m and 0·775 m, respectively. According to the RMS (3D) values, the A-SPP solution can improve the positioning accuracy by approximately 79·2%, 77·8% and 75·4% for CHZL, ZKSQ and QXJP stations, respectively, over the SPP solution. For the three datasets collected at different latitudes, the SPP positioning accuracy of ZKSQ at the mid-latitude is better than that of CHZL at a higher latitude and QXJP at a lower latitude. This difference is not clearly reflected in the A-SPP solution for the three datasets. Through the analysis of the above results, we can conclude that the uncorrected systematic errors such as orbital, ionospheric delay and tropospheric delay errors can be largely reduced in the A-SPP solution.

Figure 7. Distribution of positioning errors of SPP and A-SPP in the east (green), north (blue), and up (red) directions respectively using BDS satellites data collected at CHZL (40°N–50°N), ZKSQ (30°N–40°N) and QXJP (20°N–30° N) stations in China from 1 November 2016 to 30 November 2016.
3.2. Kinematic test
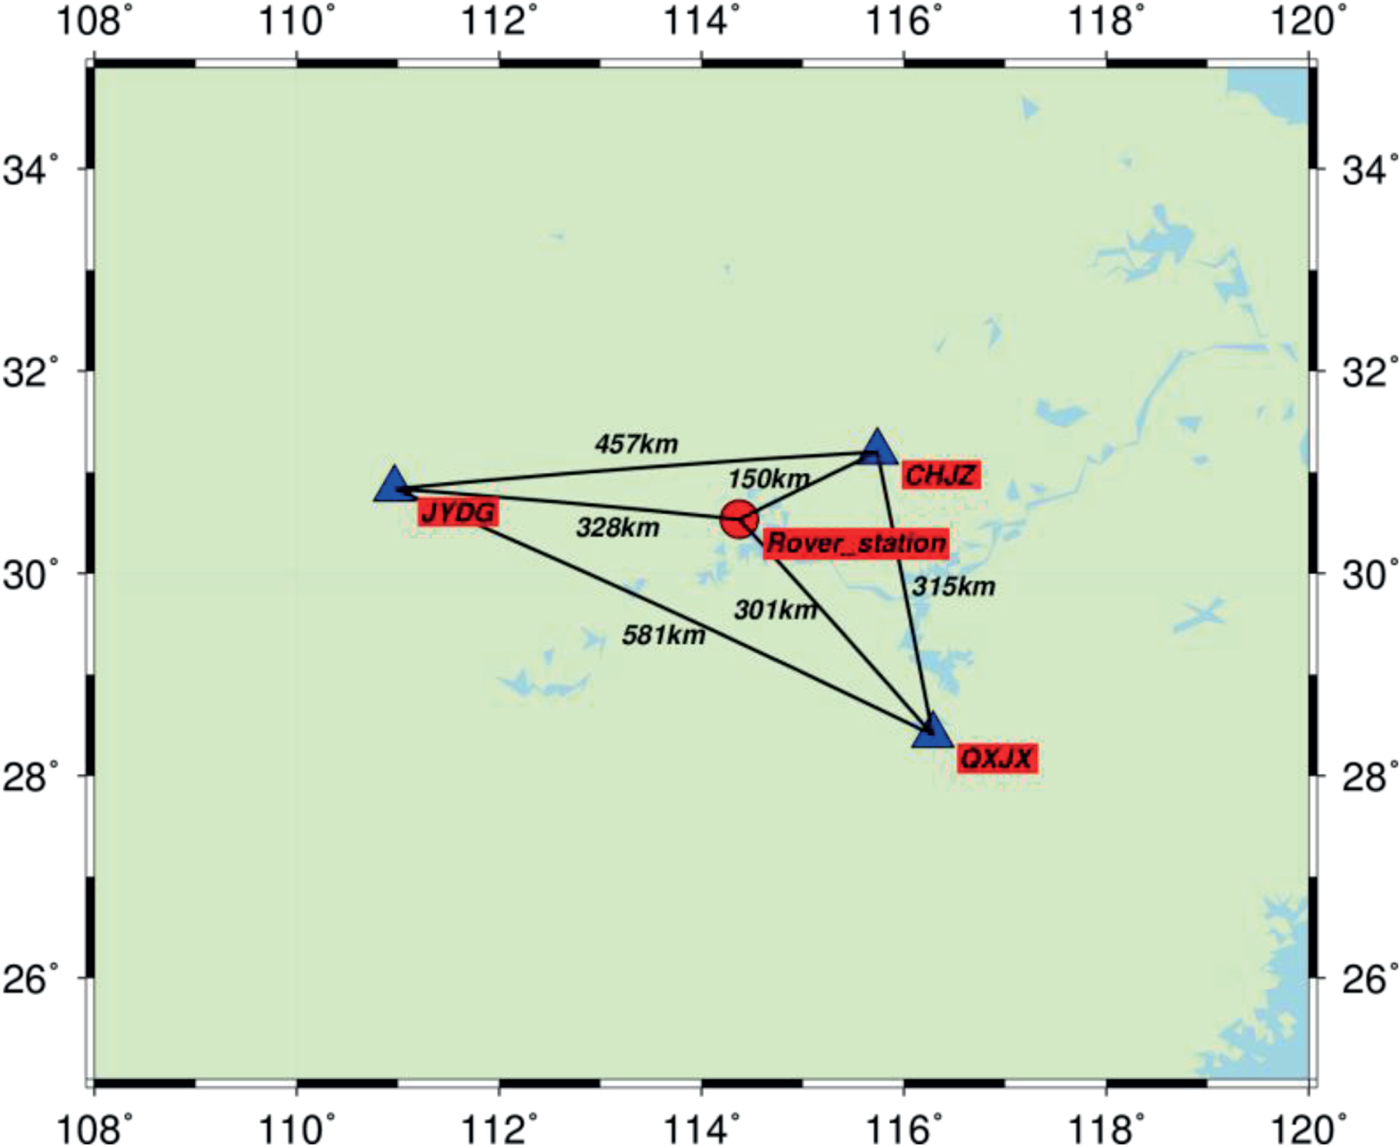
A kinematic test was conducted in Wuhan, China, on 30 May 2016. The test started at local time 11:35:11 (BDS time 3:35:11) and lasted for about 5 h. The kinematic data were collected at a sampling rate of 1 Hz with a cut-off angle of 15°. The base station was set up on the roof of the Teaching Building of Wuhan University. The distance between the base station and rover station was about 2 km. The reference coordinates of the rover station at cm-level accuracy were acquired by an RTK approach. Figure 8 shows the driving trajectory of the boat on the East Lake in Wuhan. Several loops of the trajectory have been approximately repeated. To evaluate the performance of the A-SPP method in the kinematic test, three base stations are selected to generate CRE products for the rover station. The geographical distribution of the three base stations as CHJZ, JYDG and QXJX is shown in Figure 9. The distances between the centre of trajectory of rover station and CHJZ, JYDG and QXJX stations are 150 km, 328 km and 301 km, respectively.

Figure 8. Driving trajectory represented as yellow colour for the boat on the East Lake in Wuhan.

Figure 9. Geographical distribution of three base stations (triangle) for acquiring CRE products and one rover station (circle) for the kinematic test.
The positioning errors, number of satellites and Position Dilution of Precision (PDOP) values of SPP and A-SPP for BDS are presented in Figure 10. The average of number of satellites and PDOP values are 9 and 2·4, respectively. In Figure 10, the systematic errors can be obviously seen in the SPP solution, especially in the up direction. In contrast, these systematic errors can be effectively reduced by the A-SPP solution. The time series of positioning results of A-SPP are more stable in all directions when compared with those of SPP. Table 1 gives the Standard Deviation (STD) and RMS values of positioning errors for the BDS kinematic test in the east, north and up directions based on SPP and A-SPP solutions. The BDS A-SPP solution has RMS values of 0·262 m, 0·355 m and 0·711 m in the east, north and up directions, respectively. The corresponding improvement of the positioning accuracy is approximately 82·8%, 72·3% and 81·1% in the three coordinate components over the BDS SPP solution.

Figure 10. Positioning errors, number of satellites, PDOP values of SPP and A-SPP using BDS B1I code collected at rover station from 3:35:11 to 8:27:10 BDS time on 30 May 2016.
Table 1. STD and RMS statistics of kinematic positioning errors in the east, north, and up directions based on SPP and A-SPP solutions. The percentage values in the last column represent the improvement of RMS for A-SPP over SPP.

Figure 11 shows the B1I code residuals of all observed BDS satellite data processed by SPP and A-SPP solutions. The elevation angle of each observed satellite is also given in Figure 11. Compared with the code residuals for SPP, most code residuals for A-SPP vary in a narrower range. Meanwhile, the magnitude of code residuals for A-SPP is also smaller than those of SPP in general. However, there are a few irregularities in the time series of code residuals for A-SPP, such as the MEO C12 from 3:42:17 to 3:42:37. From the third panel in Figure 11, we can clearly see that the elevation angles of C12 during that period are smaller than 16°, located at a lower elevation. Despite this, the larger residuals in A-SPP cannot simply be attributed to the low elevation angle. After checking the data of the three base stations, we found that only two stations’ data (CHJZ and QXJX) can be used to generate the corresponding CRE products for the satellite C12 during the mentioned period. That low reliability of CRE products will bring relatively large residual errors in A-SPP compared with those in SPP as concluded in Section 3.1. Fortunately, this situation generally occurs at a low elevation angle and continues for a few seconds or minutes. In a total of 148,477 satellite datasets, there are 3,858 data missing events for one station and 661 data missing events for two stations, which only account for 2·6% and 0·45%, respectively. Although there are a few irregularities in the time series of residuals for A-SPP, the RMS value of A-SPP residuals is 0·241 m, which is far smaller than that of SPP at 0·974 m.

Figure 11. Observation residuals vs. elevation angle of SPP and A-SPP for all observed BDS satellites collected at the rover station from 3:35:11 to 8:27:10 BDS time on 30 May 2016. Each BDS satellite uses one colour to represent its residuals, as indicated in the colour bar.
4. CONCLUSIONS
Because of the existence of systematic errors in SPP, the positioning accuracy of BDS SPP was limited to a level of 1–2 m in the horizontal component and 2–4 m in the vertical component in the Asia-Pacific area. With the increasing number of base stations of the BeiDou Foundation Enhancement System, CRE products integrated by more than one nearby station have become possible, which can be used to further improve the performance of BDS SPP. Therefore, an augmented SPP method (A-SPP) based on the BeiDou Foundation Enhancement System sparse reference network was developed in this study. We first obtain the CRE products integrated by three optional base stations that are close to the rover station in the sparse reference network. Then the SEAW average technique is adopted to acquire the corresponding code residual errors of each satellite observed by the rover station. Finally, the corrected code observations, which are derived by the subtraction of the corresponding code residual errors, can be utilised to achieve the A-SPP solution. The performance of A-SPP has been validated by both static and kinematic tests. The results show that the accuracies in the horizontal and vertical directions of the A-SPP solution are better than 0·5 m and 1·0 m, respectively.
The static test shows that the B1I code residuals errors for A-SPP are significantly decreased compared with those for SPP. The RMS values of code residuals for SPP are 0·709 m, 0·707 m and 0·759 m for CHZL, ZKSQ and QXJP stations, respectively, while those for A-SPP are 0·151 m, 0·231 m and 0·202 m. According to the RMS (3D) values, the A-SPP solution can improve the positioning accuracy by approximately 79·2%, 77·8% and 75·4% for CHZL, ZKSQ and QXJP stations, respectively, over the SPP solution. Furthermore, the comparison results between the A-SPP and DBDS solutions also show that the positioning performance of A-SPP is better than DBDS. In order to further evaluate the performance of A-SPP, a kinematic test was conducted in Wuhan, China, on 30 May 2016. The kinematic test illustrates that the BDS A-SPP solution has RMS values of 0·262 m, 0·355 m, and 0·711 m in the east, north and up directions respectively. Compared with SPP in the kinematic test, the improvement of the positioning accuracy for A-SPP is approximately 82·8%, 72·3% and 81·1% in the three directions. Although there are few irregularities in the time series of code residuals for A-SPP, the RMS of A-SPP residuals is 0·241 m, which is far less than that of SPP at 0·974 m.
This study provides a solution to improve SPP accuracy for single-frequency GNSS users. Decimetre-level accuracy of GNSS SPP would enrich its application in vehicle and ship navigation. Note that the distance between the base station and rover station is in the range of 100–500 km. There is no doubt that the spatial correlation of errors would be reduced with the increasing distance between base and rover stations, so the performance of A-SPP would be degraded in that situation. The increasing number of stations of the Multi-GNSS Experiment and Pilot Project (MGEX) and Continuously Operating Reference Stations (CORS), are expected to resolve this problem to some extent.
ACKNOWLEDGMENTS
The supports from the National Key Research and Development Program of China (2016YFB0501802) are gratefully acknowledged. The authors acknowledge the BeiDou Foundation Enhancement System for providing the BDS data for test.