Highlights
-
∙ Both PbAC exposure and cerebral cavernous malformations 3 (CCM3) gene defect affected the angiogenesis microvascular remodeling during embryo development.
-
∙ PbAC and CCM3 gene defect decreased the mitochondrial DNA (mtDNA) copy number and PbAC damaged the mito morphology, mitochondrial membrane potential (MMP) and ATP/AMP.
-
∙ PbAC and CCM3 gene defect increased HIF-1α and TFAM expression in messenger RNA (mRNA) and protein level.
Introduction
In addition to being one of the most widely used heavy metal, lead is also an environmental toxin and a serious industrial hazard. It can enter the human body via many pathways and accumulate in vivo, bringing about nervous system, hematological system, and reproductive system toxicity.Reference Needleman 1 Blood lead is the ‘transfers station’ for the various Pb sources in vivo, at the same time the vascular endothelium is the site that directly contact with blood lead, so the endothelial cells could be especially susceptible to lead. One of reasons that the lead causes cardiovascular diseases could be that lead can cause endothelial dysfunction. Furthermore, it is noteworthy that the placenta barrier has no resistance to lead,Reference Gundacker and Hengstschläger 2 therefore as a result, the lead in the mother blood can directly enter into the fetus through the umbilical cord blood and influence fetal development during pregnancy. One of the epidemiological studies which compared Chinese newborns in electronic waste area and control area showedReference Zhang, Xia and Li 3 that there was correlation between a decrease in fetal body length and an increase in exposure of placenta to Pb. In previous studies from our lab,Reference Su, Xing and Lai 4 CCM3 +/+ and CCM3 +/− of murine embryonic fibroblasts were used to detect the relationship between lead exposure and CCM3 expression of the mice embryo in vitro, and the results indicated that CCM3 protein expression increased after exposure to PbAC at concentration >25 μM.
CCM3 is an important functional gene which is widely distributed in the human body, and has a close relationship with the occurrence and development of many important human diseases.Reference Hwang and Pallas 5 The mice with CCM3 gene completely knocked out showedReference He, Zhang and Yu 6 embryonic vascular blood island abnormalities, dilated heart aorta, brain hemorrhage, and cardiovascular dysfunction. In addition, CCM3 gene played a critical role in keeping the homeostasis among the vascular endothelial cells, smooth muscle cells, astrocytes, and neuronal cells in the blood–brain barrier. Thus, CCM3 gene may increase the lead exposure level in brain and cardiovascular, so CCM3 gene defects are likely to increase the toxic effects of lead, including the cardiovascular toxicity.
Cardiovascular diseases are caused by the environment–gene and gene–gene interactions,Reference Kelishadi and Poursafa 7 and it is called complex diseases or multifactorial disease. Genetics and environment are two important factors for the formation of cardiovascular diseases. Blood vessels are the earliest emerging tissues during the embryonic development, and they are the basis of the growth and development of other organs, including the cardiovascular circulatory system. The fetal basis of adult disease hypothesisReference Skogen and Overland 8 , Reference Barker 9 stated that the heart vascular disease risk factors had existed before birth in individual. And angiogenesis is significant in cardiovascular diseases.
Mitochondria is a critical subcellular organelle in cardiovascular tissues, the reduction of mitochondrial content is an early signal for endothelial dysfunction.Reference Tang, Luo, Chen and Liu 10 Mitochondrial content is low in the endothelial cells, and the energy that endothelial cells produce through both the mitochondrial ATP synthesis and anaerobic glycolysis.Reference Kluge, Fetterman and Vita 11 Previous studies have shown that the mitochondria of endothelial cells mainly affect endothelial cell signaling pathway rather than energy metabolism, and it is thought that reactive oxygen species released by mitochondria induced oxidative stress and this may act as a second messenger in vascular injury.Reference Di Lisa, Kaludercic, Carpi, Menabò and Giorgio 12
In a word, it seems that both the environmental factor, lead and genetic factor, CCM3, have similar influence on cardiovascular system during the development phase, and we are interested in whether there was the interaction of lead–CCM3 on vascular development. As a few researchers have reported the mechanism what mitochondria might play an important role in the vascular development under the lead–CCM3 interaction at present, in this study, we assumed mitochondria was the common target of lead and CCM3, which both could lead to the vascular injury during the development.
Methods
Animal and exposure
The present study was approved by Animal Ethics Committees of Sun Yat-sen University and this study was conducted in accordance with the guidelines of Animal Ethics Committees.
C57/B6 female mice were purchased from Experimental Animal Center of Sun Yat-sen University, and CCM3 heterozygous (CCM3 +/−) male mice were kindly given as a present by Professor Wang Min from Yale University. The 20 C57/B6 female mice were randomly divided into control group and PbAC exposure groups. These female mice in control and PbAC group were drinking ddH2O and 0.05% PbAC for 1 week, respectively, then mated with CCM3+/− male mice in the ratio of 1 to 2. The vaginal plugs in female mice were checked in the next morning,Reference Yang, Uriu-Adams, Keen, Rucker and Lanoue 13 and if the vaginal plugs were found, they were referred to as embryonic E0.5. The females that confirmed pregnancy were fed in different cages, and control group and exposure group were fed with ddH2O and 0.05% PbAC solution daily until E11.5, respectively. Each group included five mice at least (n=5 mice/genotype/group).
Maternal blood lead detection
We prepared the lead standard solution curve with the lead stock solution (1.0 mg/l), and final concentration was 0, 50, 100, 200, 400 and 500 μg/l. The graphite furnace atomic absorption spectrometry (Shimadzu AA-6300) was used to detect absorption. The mice blood samples were collected via eyeball removal and processed with the following method: 150 μl whole blood with ethylenediaminetetraacetic acid anticoagulation was added to 600 μl of 5% nitric acid, vortexed and left at room temperature for 15 min, then centrifuged for 5 min at 12,000 rpm/min, and finally 600 μl supernatant was removed to detect the blood lead (Table 1).
Table 1 The procedure of graphite furnace atomic absorption spectrometry

Gross morphology of yolk sac blood vessels
The dams were anesthetized with 5% sodium pentobarbital, and were sacrificed after lead treat. Then the uterus was removed in whole by using finely serrated forceps at the base of the uterus, pulling up and cutting underneath each uterine horn with straight fine iris scissors.Reference Nagy, Gertsenstein and Behringer 14 The embryos were removed from the culture medium into a plate full with ice-cold sterile phosphate-buffered saline (PBS) solution. Morphological observation was carried out under a stereomicroscope (LEICA M205 C, Germany). The distribution of yolk sac blood vessels and embryo development were evaluated using Image J (NIH) software. Following Brown and Fabro’sReference Brown and Fabro 15 proposal of embryo morphology scoring standards, we chose the embryonic length from head to tail and the diameter of yolk sac as the morphology evaluation index. The DNA in the embryonic tail was extracted for genotyping.
Hematoxylin and eosin (HE) staining slicings of yolk sac blood vessels and vascular classification statistics
The yolk sacs were fixed overnight in 4% paraformaldehyde in phosphate buffered saline at 4°C, dehydrated in 30% surger solution and embedded in the compound optimal cutting temperature for histology. Transverse serial sections were generated using a microtome (7 mm; LEICA CM 1950; American) at optimum cutting temperature. Sections were stained with HE, and examined for morphology under a light microscope (NIKON Eclipse Ti-E). Three slides per each yolk sac were selected and three to five zones were selected per slide. Images were captured with camera. Individual yolk sac vessel diameters were measured using Image J (NIH), and yolk sac vessels measurements were distributed in categories of 10 pixels intervals (0–10, 10–20, 20–30, 30–40, 40–50, 50–60, 60–70, 70–80, 80–90, 90–100 and >100 μm). The percent distribution of vessel diameters in the different categories was calculated for each slide, and then an average percentage vessel diameter distribution was determined for each group.Reference Tasaki, Kim and Zakrzewska 16
mtDNA mitochondrial copy number of yolk sac detection
Total DNA was extracted from yolk sac by way of phenol–chloroform method as previous. The quantitation of mtDNA and nuclear DNA was performed using a real-time polymerase chain reaction (PCR) system (real-time PCR instrument V7, ABI ViiATM7Dx, USA) with SYBR Green Realtime PCR Master Mix (TOYOBO).Reference Rooney, Ryde and Sanders 17 The extracted DNA concentration was adjusted to 50 ng/μl, and according to the following QRT-PCR liquid reaction system, the total volume of formulated reaction system was 20 μl.
DNA actin and mtTNA ND-1’s primers:

The PCR cycling conditions were: 55°C for 10 min, 95°C for 30 s, 40 cycles of 95°C for 30 s, 55°C for 30 s, 72°C for 60 s in 7500 PCR system, and finally results were calculated with
 $${\rm 2}^{{{\minus}\Delta \Delta C_{t} }} $$
method.
$${\rm 2}^{{{\minus}\Delta \Delta C_{t} }} $$
method.
Mitochondrial morphology observation of human umbilical vein endothelial cells (HUVECs) after lead exposure
According to primary HUVECs separation method,Reference Crampton, Davis and Hughes 18 the entire umbilical cord is placed in the bottle filled with ice-cooled sterilized PBS solution and shipped to the laboratory. The umbilical cord ends were trimmed, umbilical vein lumen inside and outside washed with 0.9% saline. Then the umbilical vein was closed in one end, collagenase was perfused from the other end slowly, and then the umbilical cord was clamped at both ends. The umbilical cord was incubated in the PBS at 37°C for 10–15 min. The umbilical cord was washed with a preheated half-complete medium M199, and the PBS and flushing fluid were collected. Then all of the liquid was re-suspended and centrifuged at room temperature, 1000 rpm×10 min. the supernatant was removed and re-suspended with saline at 37°C, centrifuged again at 1000 rpm×10 min. The rest was cultured with M199 medium at 37°C with 5% CO2. Half of the medium was exchanged every 2–3 days until the cells flasked up to 80% confluence, then digested with 0.25% trypsin in 1:2 ratio and passage into dishes. At last qualitative analysis was done with CD31 immunofluorescence staining.
P4~P8 generations primary HUVECs cells were used in this study. When the cells grew to 80% confluence, they were digested with 0.25% trypsin and seeded in 24-well plates with the density 2×10⁴/ml and incubated at 37°C with 5% CO2 in air. The HUVECs were exposed to PbAC for 24 h at the level of 10, 50 and 200 μM on the base of Cell Viability Assay MTS (G3580, Promega, USA). After PbAC exposure for 24 h, the HUVECs stained with the Mito-Tracker Green (C1033, Pik days, China) were observed using fluorescent microscope (NIKON Eclipse Ti-E, Japan); 5–10 zooms were randomly selected in each well and the photos were taken in 100× and 200× magnification. The fluorescent intensity was quantitatively analysis with Image J (NIH) software for each photo.
Determination of the MMP in HUVECs
The primary HUVECs were exposed to PbAC as above and then were stained with the JC-1 mitochondrial membrane potential kit (C2006, Beyotime, China), then observed under the fluorescence microscope. The JC-1 monomers were detected in the green fluorescence (514 nm/529 nm) while JC-1 aggregates (585 nm/590 nm) in the red fluorescence; 5–10 zooms were randomly selected in each well and the photos were taken in 100×. The red and green fluorescent of HUVECs were quantitative analyzed using Image J (NIH) software for each photo, and finally the ration of green and red fluorescent was calculated to evaluate of the membrane potential of HUVECs.
Mitochondrial AMP and ATP detection with high-performance liquid chromatography (HPLC)
The HUVECs were washed twice in PBS after PbAC exposure. Each well of HUVECs was added with 400 μl of 0.5M HClO4 to lyse, and the liquid was sonicated and centrifuged at 4°C in 5000 rpm/min×10 min, then the supernatant was neutralized with 2M KOH on ice, at last filtered through a 0.22 μm filter. Filtrate was detected with HPLC.Reference Liu, Zhang and Lu 19
Chromatographic conditions:
Column: Elite Hypersil BDS C8 (4.6 mm×250 mm, 5 μm)
Injection volume: 50 μl
Column temperature: 20°C
Detection wavelength: 254 nm
Mobile phase: 150 mM KH2PO4 (pH=6.5, 1 mol/l aqueous sodium hydroxide solution to adjust pH), methanol:buffered saline=1:99 (v:v);
Flow rate: 1 ml/min
Quantitation: calculates the concentration of ATP or AMP as the following formula with external standard, and then the ATP/AMP ration:
 $$\eqalign { {\rm ATP}\,\,{\rm or}\,\,{\rm AMP}\,{\rm concentration=}&{{{\rm The}\,{\rm area}\,{\rm of}\,{\rm sample}\,{\rm peak}\,{\rm area}} \over {{\rm The}\,{\rm peak}\,{\rm area}\,{\rm of}\,{\rm the}\,{\rm external}\,{\rm stand}}} \cr & {\rm {\times}external}\,{\rm stand}\,{\rm concentration}$$
mtDNA copy number detection of HUVECs and imHUVECS
The immortalized HUVECS with CCM3 gene knockout (imHUVECs CCM3 −/−) were constructed by our Lab. The DNA from two cell lines were extracted with the phenol–chloroform method after being exposed to PbAC as for 24 h at the level of 10, 50 and 200 μM. Subsequently, the DNA concentrations were adjusted to 50 ng/μl and formulated QRT-PCR liquid reaction system according to the following composition, total volume was 20 μl. The detection method was the same as the 2.5 mtDNA copy number of yolk sac detection.
The mRNA expression detection of HUVECs, imHUVECS and brain microvascular cells (BMCs)
The total RNA was isolated from HUVECs, imHUVECs, and BMCs by using the TRIzol (Ambion® Life Technologies) according to the manufacturer’ recommendations and the RNA was reverse-transcribed to obtain complementary DNAs (cDNAs) (TOYOBO), catalyzed by ABI ViiATM7Dx Real-Time PCR System (ABI). Relative mRNA levels of FLK-1α and TFAM were determined by the comparative C t method followed by normalization with the β-actin mRNA level in each cDNA sample. Specific primers for each gene were designed using Primer Premier 5.0 software.
mRNA primers:

Results
PbAC exposure led to increase in maternal blood lead concentration
The maternal blood lead concentrations were detected at E11.5 after PbAC exposure. The results showed that blood lead concentration of pregnant mice was 310.44±89.20 μg/l in the PbAC group while 35.77±8.24 μg/l in the control group. There was statistically significant difference (P<0.01) between the two groups (Fig. 1a). But food intake, weight gain and the number of implantation sites were similar in the two groups (data not shown).

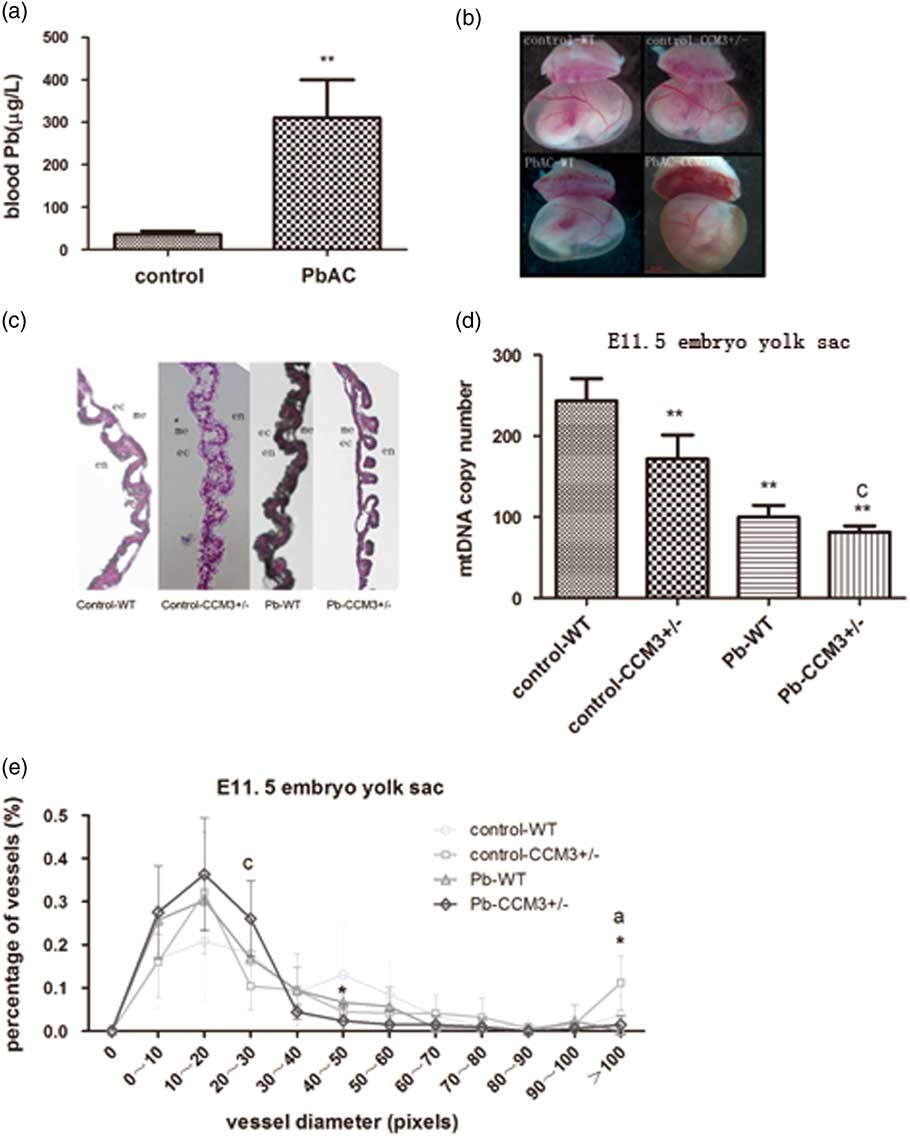
Fig. 1 The effect of PbAC exposure on the angiogenesis of CCM3 +/− embryo at E11.5. (a) The blood lead concentrations of pregnant mice at E11.5 from control and 0.05% PbAC group were analyzed with atomic absorption spectrometry. The blood lead mean was 310.44±89.20 μg/l in the 0.05% PbAC group. **P<0.01, compared with the control group. (b) Morphology changes of yolk sac of WT and CCM3 +/− at E11.5 after PbAC exposure. It was observed significantly opaque yellow and yolk sac blood vessels branches in the CCM3 +/− embryonic yolk sac of 0.05% PbAC group. (c) Hematoxylin and eosin (HE) pathological of yolk sac results showed that there were more small blood vessels and structural abnormalities in yolk sac of CCM3 +/− embryo after PbAC exposure. (d) Either CCM3 genetic defects or lead exposure caused mitochondrial DNA (mtDNA) copy number decrease. There was the statistical significance lead–CCM3 interactions (F=6.563, P=0.045). (e) The statistical analysis of the yolk sac vascular diameter in HE staining at E11.5. There was the lead–CCM3 interaction (F=6.664, P=0.024) in the vessel diameter in the range of 20–30 μm, and >100 μm range, the control group CCM3 +/− macrovascular ratio is greater than the other groups with statistically significant difference between groups (F=9.428, P=0.009). aRepresents control and PbAC exposure statistically differences; cRepresents a statistically significant lead–CCM3 interaction; *P<0.05, comparing with the control group WT genotype embryos.
PbAC exposure and CCM3 gene defect caused yolk sac vascular morphology abnormalities
PbAC exposure via maternal mice had effects on the growth and development of the yolk sacs. Under the stereomicroscope, the vitelline vessels in the wild type (WT) and CCM3 +/− yolk sac of the control group were thick and fully extended. Big and serpentine vessel branches were clearly apart from one another. Blood flow could be seen in the lumen (Fig. 1b). However, the yolk sacs color were yellow and opaque, otherwise vitelline vessels had more branches and became out of the order in the CCM3 +/− embryos from PbAC 0.5% group, although blood flow could still be seen. The above results suggested the normal angiogenesis and vascular remodeling could be disturbed and so the physiological functions could be changed by the lead exposure and CCM3 gene defects. However, there were no evident differences in the yolk sacs diameter between WT and mutant embryos of control group and level Pb exposure.
Higher percent of small vasculars in the CCM3+/− yolk sac of PbAC group
Histological sectioning of yolk sac tissue was performed to visualize the vessels in cross-section via HE staining. The morphological examination showed that there was abnormal yolk sac vasculature with the abundant of large and small caliber vessels in the WT and CCM3 +/− yolk sac of control group at E11.5, while the large diameter vessels were less and exhibit more branches comparing to control group, indicating a failure in appropriate blood vessel remodeling occurring at E11.5 (Fig. 1c).
The assessment of vessel diameter in yolk sac sections showed that there was statistical interaction (F=6.664, P=0.024) in the 20–30 μm range after the CCM3 +/− yolk sacs were exposed to Pb. In both the CCM3 +/− and WT of Pb exposure group, the percentage of yolk sac vessels in the 0–10, 10–20 and 20–30 μm pixel range were greater than those of yolk sac vessels in control group. In contrast, the diameters of control group yolk sac vessels were distributed broadly with the highest percentage in the 40–50 μm pixel range. The percentages of yolk sac vessels in the over 100 μm pixel for CCM3 +/− without Pb subgroups were significantly greater than others and the presence of lead exposure differences between groups (F=9.428, P=0.009) (Fig. 1e).
The mtDNA copy number of yolk sac decreased in the CCM3+/− embryo after PbAC
The DNA was exacted from yolk sac at E11.5 and mtDNA copy number was detected with QRT-PCR. The results showed that the mtDNA copy number in the yolk sac of CCM3 genetic knocked out embryo decreased, and the same to the yolk sac of the embryo after lead exposure. Moreover, there was a statistical lead-CCM3 interaction (F=6.563, P=0.045) in the mtDNA copy number of yolk sac (Fig. 1d).
Mitochondrial morphology damage of HUVECs PbAC exposure caused
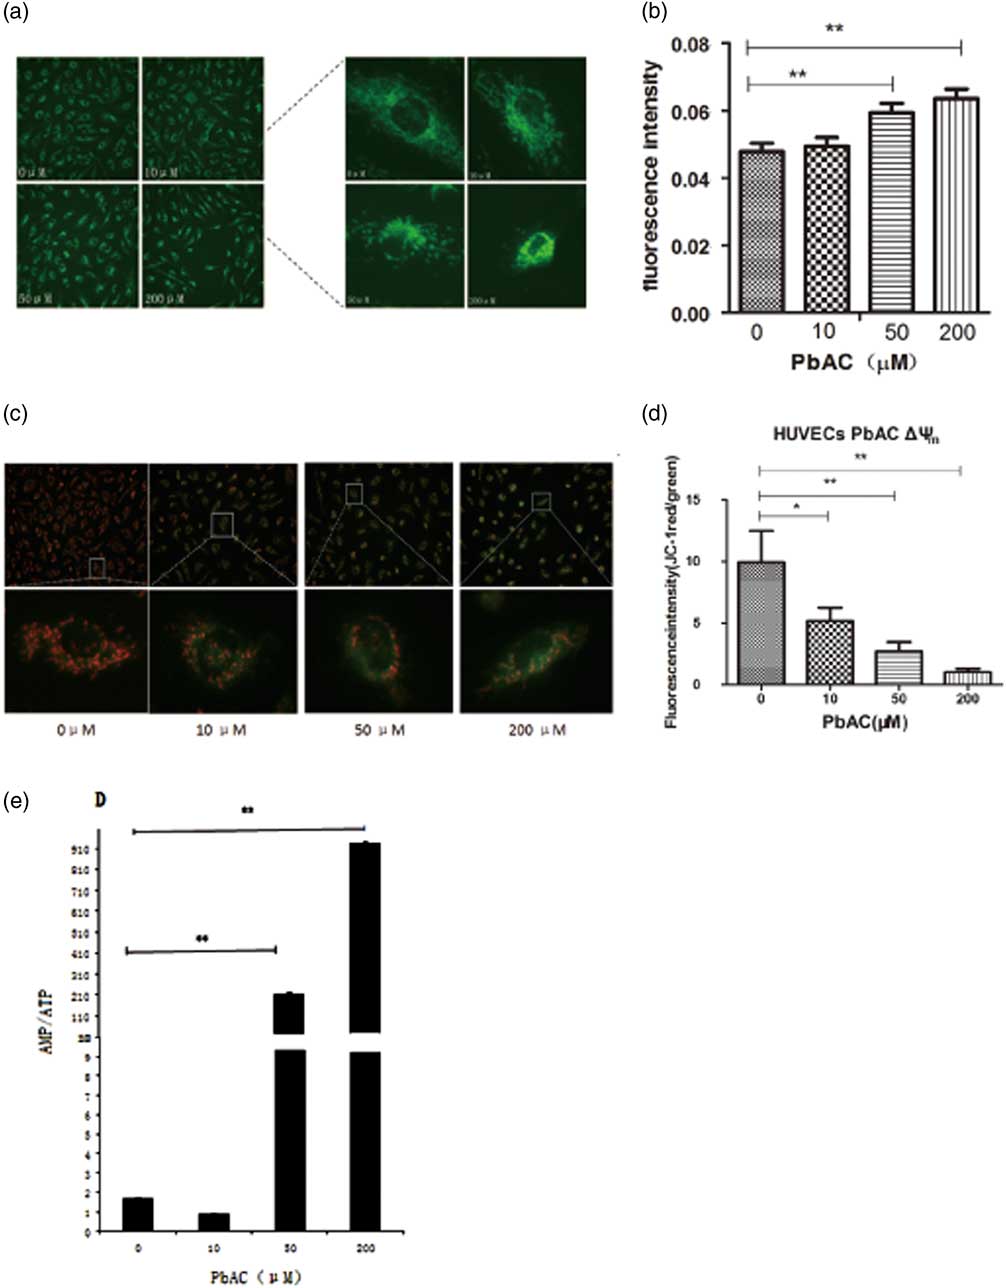
The mitochondrial dendritic network distributed around the nucleus in the control HUVECs, while dendritic structures were disrupted, shortened and even became fractured after PbAC exposure, and there were only small pieces and cyclic structures in the medium PbAC exposure. The mitochondrial structures even disappeared at 200 μM, and mitochondria aggregated around the cell nucleus (Fig. 2a). The fluorescence quantitative results with Image J software indicated that the fluorescence intensity per unit cell area increased as PbAC exposure level increased (Fig. 2b), and there was statistical dosage–response relationship (r=0.679, P<0.01).

Fig. 2 The mitochondrial changes after PbAC exposure in human umbilical vein endothelial cells (HUVECs). (a) The mitochondrial morphology in HUVECs was observed (200×) with MitoTrackery fluorescent probe staining. The mitochondrial dendritic network distributed around the nucleus in the normal cells, while the mitochondrial structures were destroyed characterized with fragmentation and cyclic structures appearing in the PbAC exposure group. (b) The fluorescence intensity quantitative results showed the fluorescence intensity increased after PbAC exposure with statistical positive correlation (r=0.679, P<0.01). **P<0.01, compared with the control group (n=3 times). (c) The fluorescence images of HUVECs with mitochondrial membrane potential (MMP) probe JC-1 staining (200×). (d) The fluorescence intensity quantitative results of MMP in HUVECs. **P<0.01, *P<0.05; comparing with control group (n=3 times). The results showed that the ratio of red and green fluorescence decreased as the PbAC level increasing, and there were the statistical significance dose–response relationship (r=−0.665, P<0.05). (e) The results showed that AMP/ATP ratio increased compared with the control group, and there was a statistically significant difference (P<0.01), and a dose–response correlation between PbAC dose and AMP/ATP value (r=0.997, P<0.01). Note: **P<0.01, compared with the control group (n=3 times).
MMP of HUVECs mitochondria reduced after PbAC exposure
The results indicated the red JC-1 aggregates were largely accumulated and little green JC-1 monomer appeared in the mitochondrial matrix of HUVECs from control group, on the contrary the fluorescence intensity of green JC-1 increased and the number of red JC-1 aggregates decreased after lead exposure under the inverted fluorescence microscope (Fig. 2c). And then we calculated the ratio of red JC-1 aggregates and green JC-1 monomer fluorescence intensity after fluorescence quantitative analysis with Image J. It was shown that the ratio was the highest in HUVECs of control group, which means that mitochondrial membrane potential decreased as the PbAC level increased (Fig. 2d). At the same time, the correlation analysis showed that there was a negative dosage–response relationship (r=−0.665, P<0.05).
The ratio of mitochondrial AMP/ATP rose as the lead level increasing in the HUVECs
The content of ATP and AMP in HUVECs of control and PbAC group were analyzed with HPLC and then the ratio of AMP/ATP were calculated to assess the changes of mitochondrial energy metabolism, and results showed that AMP/ATP ratio increased compared with the control group as PbAC concentration increased (Fig. 2e). Furthermore, there was a statistically significant difference (P<0.01) between PbAC group and the control group, and moreover a positive dose–response correlation between the ratio of AMP/ATP and PbAC exposure level (r=0.997, P<0.01).
The mtDNA copy number in HUVECs and CCM3−/− imHUVECs decreased after PbAC exposure
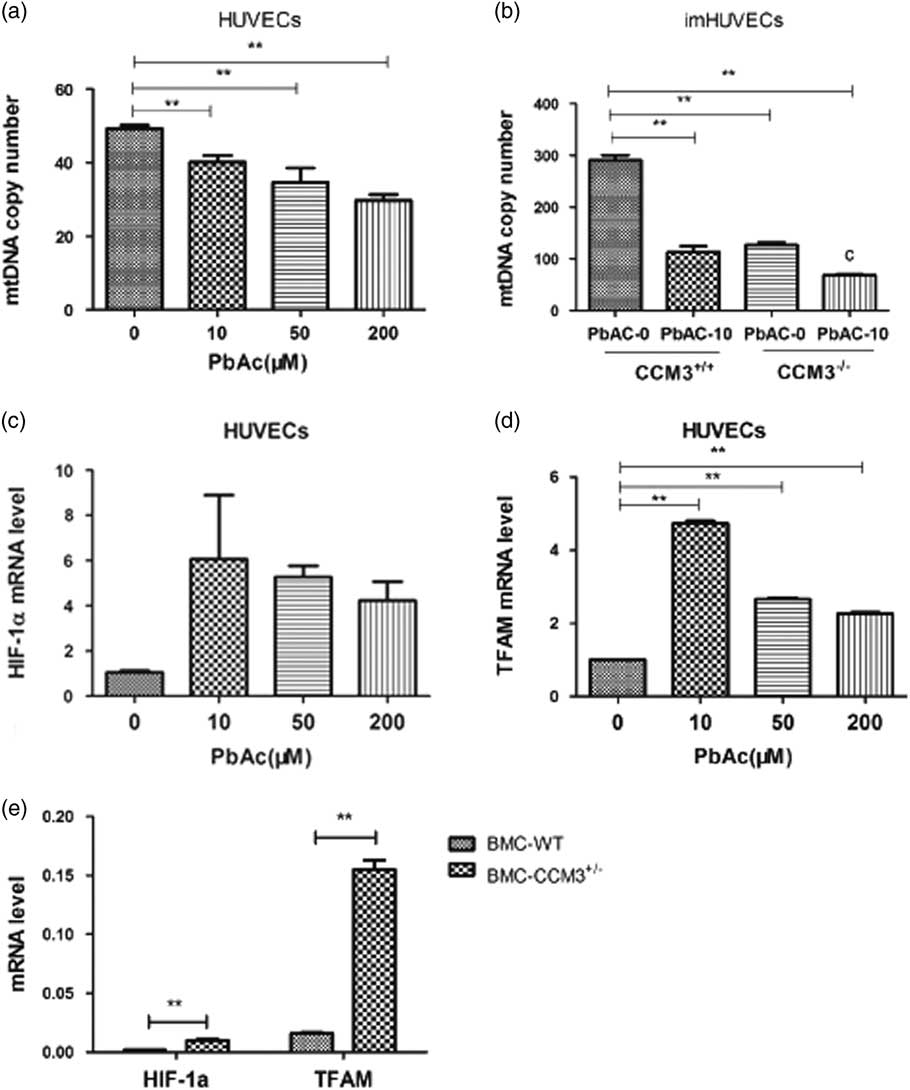
The mtDNA copy numbers in HUVECs and CCM3 −/− imHUVECs were detected with QRT-PCR after lead treated. There was statistically significant decrease in PbAC group with respect to the control group (P<0.01) and negative dosage-effect correlation as well (r=−0.775, P<0.01) (Fig. 3a). In addition, results indicated the mtDNA copy number also reduced after CCM3 gene was knocked out in the imHUVECs compared with empty plasmid transfection, which means that CCM3 gene had an important effect on the mtDNA content. In addition the same outcome was observed in the imHUVECs and CCM3 −/− imHUVECs after PbAC exposure, so it was confirmed that lead could cause the mtDNA damage again (Fig. 3b). There was a statistically significant interaction between PbAC and CCM3 (F=169.7, P<0.001).

Fig. 3 The effect of PbAC exposure and CCM3 gene defect on the mitochondrial DNA (mtDNA) copy number and HIF-1α (a) and TFAM. (a) The results showed that the lead exposure made the mtDNA copy number less compared with the control group in HUVECs and there was the statistically significant difference (P<0.01) and a dose-effect negative correlation (r=−0.775, P<0.01). (b) The mtDNA copy number decreased in CCM3−/− imHUVECs compared with imHUVECs, and the result made it clear that CCM3 gene and lead both injured the mtDNA and there was statistically significant PbAC and CCM3 interaction (F=169.7, P<0.001). **P<0.01, compared with the imHUVECs with empty plasmid transfection and no PbAC treated (n=3 times). (c) HIF-1α mRNA expression level increased in the HUVECs after PAC exposure compared with control cell. (d) The expression of TFAM mRNA level in HUVECs increased along with PbAC level rising and there was a significant difference in the TFAM change compared with the control group. **P<0.01, compared with the control group. (e) The HIF-1α and TFAM mRNA expression in CCM3 +/− mouse brain microvascular endothelial cells (BMC) increased compared with in WT. **P<0.01, compared with the WT BMC (n=3 times).
The mRNA expression of HIF-1α and TFAM increased in the HUVECs after PbAC exposure
To explore the changes of regulatory proteins on mtDNA synthesis, we studied the mRNA expression level changes of HIF-1 and TFAM in HUVECs after PbAC exposure. We found that lead gave a rise to HIF-1α and TFAM which were the important proteins associated with mitochondrial synthesis (Fig. 3c), and there were statistically significant differences in the TFAM of PbAC group compared with the control group (Fig. 3d).
The HIF-1α and TFAM mRNA expression increased in the BMC with CCM3 gene defect
To further study the influence of CCM3 gene defects on mtDNA synthesis, we detected the HIF-1α and TFAM mRNA expression with the CCM3 +/− BMC which were gained directly from the brains of CCM3 +/− mice and can simulate the CCM3 gene defects in the human. As a result, we found HIF-1α and TFAM mRNA expression increased in the CCM3 +/− BMC comparing with the WT BMC (Fig. 3e) and there was statistically significant difference in the HIF-1α and TFAM expression (P<0.01).
Discussion
Currently, it is rare to use transgenic animal (such as CCM3 knockout mice) in cardiovascular toxicity studies of lead exposure, especially in the symptoms and mechanisms of abnormal blood vessels during embryonic development. Our results showed that CCM3 genetic defects and lead exposure together increased the incidence of vascular development abnormalities and deviant angiogenesis structural. As a result, those changes affected the blood flow in the yolk sac during embryonic development, finally caused insufficient oxygen and nutrient delivery, and even the embryonic development changes. In conclusion, we thought this was an excellent animal model for the study of genetic defect and environmental exposure interaction in utero.
As previous studies have shown that mitochondria cannot distinguish lead and calcium ions,Reference Simons 20 and the capacity of lead binding with mitochondria is a million times higher than calcium. Because high-density lead precipitates form in the mitochondria and interfere with the enzymatic activity of mitochondria, it makes mitochondria a target of lead in cells. Our research showed that lead exposure not only affected the mitochondrial morphology and mtDNA content in HUVECs in vitro, but also damaged the mitochondrial membrane potential and caused energy metabolism dysfunction, indicating that lead can result in the mitochondrial damages in many different aspects. Similarly, on the base of the bioinformatics research, many protein molecules interacted with CCM3, it was found that among these protein molecules screened, especially Ste20 family MST4, STK24, and STK25, all had relationship with the ATP-binding function.Reference Hwang and Pallas 5 In addition, it has been reported that CCM3 increased the quantity of MST4 and phosphorylation levels.Reference Zhang, Ma, Peng, Nan and Zhao 21 Thus it was most likely that CCM3 gene interacted with these proteins to regulate signal transduction pathway and thereby affected the mitochondrial function and finally resulted in the abnormal angiogenesis. In summary, we have reasons to believe that lead exposure caused the abnormal angiogenesis by damaging the mitochondria in the endothelial cells as well as CCM3 gene defect. And it had been preliminarily certified both in vivo and in vitro from human and mice in our study.
It was reported that in previous studiesReference Hsu, Wang and Wu 22 , Reference Zhang, Gao and Fukuda 23 HIF-1α was an important regulatory molecule of mtDNA biogenesis, and HIF-1α can initiate other proteins level associated with mitochondrial biogenesis rising, specially TFAM if HIF-1α expression increasing.Reference LaGory, Wu and Taniguchi 24 , Reference De Bock, Georgiadou and Carmeliet 25 In addition, HIF-1α had close relationship with vascular endothelial growth factor (VEGF),Reference Arany, Foo and Ma 26 and it can also trigger VEGF synthesis and thereby stimulating angiogenesis. It was interesting to note from the experiment that lead exposure and CCM3 gene defects both led to the increase in the expression of HIF-1α and TFAM, but still cut down the mtDNA content. It indicated that lead and CCM3 gene defects reduced the mitochondrial DNA content was not by lowering the related proteins level which were in charge of mtDNA synthesis. On the base of other scholars research, we speculated that CCM3 may interact with lead through other pathways, such as: (1) oxidative stress directly damage mtDNA;Reference Płoszaj, Robaszkiewicz and Witas 27 , Reference Ercal, Gurer-Orhan and Aykin-Burns 28 (2) break the homeostasis of mitochondrial fussion and fission in the cell;Reference Youle and van der Bliek 29 (3) increase mitochondrial autophagyReference Rambold and Lippincott-Schwartz 30 and so on, ultimately reduce the number of mtDNA. The real reasons that lead and CCM3 gene defects damage the mitochondria need to make further research to confirm.
Acknowledgments
This work was supported by the key program of the NSFC (81273097, 81472998).
Conflicts of Interest
None.