Introduction
This article reviews the application of the endophenotypes concept to neuroimaging in autism spectrum disorder (ASD). To this end, we first review the concept of endophenotypes, the genetic and clinical heterogeneity of ASD, and summarize the current understanding of the brain developmental trajectory in ASD. We then present a brief overview of the predominant structural and functional neuroimaging findings in ASD and discuss the potential relevance of the neuroimaging endophenotypes to ASD.
The Endophenotype Concept
Endophenotypes are measurable subclinical biological markers or traits that are internal phenotypic expressions of a genotype. A biomarker that does not represent an expression of a gene is not considered to be an endophenotype.Reference Ruggeri, Sarkans, Schumann and Persico 1 According to Gottesman et al, “An endophenotype may be neurophysiological, biochemical, endocrinological, neuroanatomical, cognitive, or neuropsychological (including configured self-report data) in nature.”Reference Gottesman and Gould 2 They are also called intermediate phenotypes (p. 639), as they lie in the pathway between the genome and the external phenotype (clinical or behavioral features). They may be the developmental manifestation of a gene or set of genes; therefore, their study may shed light on the etiopathogenesis of a disorder such as ASD that has strong genetic origins.
Originally proposed in an article on variability in geographic distribution of grasshoppers,Reference John and Lewis 3 Gottesman and Shields applied this concept to the genetics of schizophrenia.Reference Gottesman and Shields 4 , Reference Shields and Gottesman 5 The commonly accepted criteria for a trait or a biomarker to be considered an endophenotype include (a) it is associated with illness in the population; (b) it is heritable; (c) it is primarily state-independent (manifests in an individual whether or not illness is active); (d) within families, endophenotype and illness co-segregate; and (e) it is found in both the affected and nonaffected family members at a higher rate than in the general population.Reference Gottesman and Gould 2 There has been great interest in the identification of endophenotypes to study a particular trait in the proband and unaffected relatives in both nonpsychiatric and psychiatric conditions. Most psychiatric disorders have a complex genetic architecture, which precludes the identification of single genes that may promote the disorder; identification of endophenotypes may be an alternative approach, as an endophenotype may connote a single gene or a set of genes.Reference Cannon and Keller 6
Identifying endophenotypes may, especially, be a more cogent approach to understanding ASD, given its genetic underpinnings and complex nature, than a purely behavioral approach to clinical diagnosis.Reference Viding and Blakemore 7 It is recognized, however, that many of the putative endophenotypes may not be specific to ASD, but may be generally indicative of either normal variation or atypical development in neural structure or function, and may thus occur in other developmental disorders.Reference Skuse 8 , Reference DiCicco-Bloom, Lord and Zwaigenbaum 9
Autism Spectrum Disorder
Described initially by Leo Kanner at Johns Hopkins in his classic paper in 1943,Reference Kanner 10 ASD (or autism) is a neurodevelopmental psychiatric disorder with an estimated prevalence of 1 in 68 children, 11 which is usually diagnosed in childhood but spans the lifetime.Reference Newschaffer, Croen and Daniels 12 it has a male predilection, occurring in 1 in 42 males as compared to 1 in 189 females. 11 The diagnosis depends upon core diagnostic criteria, including delays or deficits in social communication, restricted areas of interest, and repetitive behaviors. 13 Gold standard measures such as Autism Diagnostic Interview (ADI-R; Lord, Rutter, & Le Couteur, 1994)Reference Lord, Rutter and Le Couteur 14 and Autism Diagnostic Observation Scale (ADOS-G: Lord et al., 2000)Reference Lord, Risi, Lambrecht, Cook, Jr, Leventhal, DiLavore and Rutter 15 are used both clinically and in research to confirm the ASD diagnosis.
Although the concept of an autism spectrum had initially been proposed in 1979,Reference Wing and Gould 16 it was not until the publication of The Diagnostic and Statistical Manual of Mental Disorders, Fifth Edition (DSM-5) that the term ASD was officially recognized as a diagnosis. Studies comparing the disorders under the DSM, Fourth Edition (DSM-IV) umbrella term “pervasive developmental disorders” supported incorporating these into a single ASD diagnosis.
ASD is highly heterogeneous, both in its etiopathogenesis and in its clinical presentation. The term ASD itself recognizes the dimensional differences within the diagnosis. Several factors contribute to the heterogeneity in ASD, including high rates of comorbid medical conditions (eg, sleep disorders, gastrointestinal dysfunction, autoimmune disorders), neurological conditions (such as seizures and sensory and motor system abnormalities), and psychiatric disorders (such as attention deficit hyperactivity disorder and anxiety). Another contributor to the heterogeneity is the intellectual ability of the individual with ASD. Intellectual abilities in ASD may vary from profound intellectual disability to superlative intellect across the spectrum, leading to the concept of “low functioning” and “high functioning” ASD. It is not known whether some of these co-occurring conditions confer their own genetic liability to ASD. It is also not established whether the common co-occurrence of specific disorders in ASD signifies independent phenotypes or if these disorders are truly comorbid disorders in context of ASD. Given the etiopathogenetic and phenotypic heterogeneity, ASD has been described as “autisms” rather than a unitary “autism.”Reference Geschwind and Levitt 17
Genetic Underpinnings of ASD
ASD is a highly heritable disorder with estimates as high as 80–90%.Reference Freitag, Staal, Klauck, Duketis and Waltes 18 , Reference Lichtenstein, Carlström, Råstam, Gillberg and Anckarsäter 19 Initial evidence for this came from early twin pair studies.Reference Folstein and Rutter 20 – Reference Folstein and Rutter 22 Subsequent studies found 60% of monozygotic (MZ) twins to be concordant for autism versus none for dizygotic (DZ) pairs; 92% of MZ twins were concordant for a broad spectrum of autism-related cognitive and social abnormalities versus 10% for DZ twins.Reference Bailey, Le Couteur and Gottesman 23 Concordance rate for siblings ranges from 3% to 14%.Reference Bolton, Macdonald and Pickles 24 – Reference Sumi, Taniai, Miyachi and Tanemura 27 The frequent finding of subclinical autistic or cognitive traits in close relatives of autistic probands who do not meet the criteria for a diagnosis of ASD (the broader autism phenotype; BAPReference Piven, Palmer, Jacobi, Childress and Arndt 28 ), as well as the existence of the such traits in general population,Reference Constantino and Todd 29 – Reference Hoekstra, Bartels, Verweij and Boomsma 31 are also cited as evidence for the genetic basis.
Further support for genetic liability is also derived from the fact that 10–20% of individuals with known genetic disorders may have autistic features (“syndromic autism”),Reference Geschwind 32 such as in Fragile X syndrome and Rett syndrome.Reference Schaefer and Mendelsohn 33 , Reference Schaefer and Mendelsohn 34 Other genetic disorders such as tuberous sclerosis, neurofibromatosis type I, Prader-Willi and Angelman syndromes, Smith-Lemli-Opitz syndrome, Smith-Magenis syndrome, and velocardiofacial syndrome, among others, may present with autistic features also (see Miles et al Reference Miles 35 for a thorough review of genetics of ASD).
Newer genetic analytic techniques such as chromosomal microarray (CMA), including single nucleotide polymorphism (SNP) arrays, and whole genome sequencing have highlighted the association of de novo mutations or copy number variants (CNVs), including some at “hot spot” locations on chromosomes, such as 16p11.2, which has underscored their role in ASD.Reference Sebat, Lakshmi and Malhotra 36 , Reference Michaelson, Shi and Gujral 37 Many of these mutations involve genes that are very active in brain developmental processes. These include genes that are active in synaptogenesis and pruning (such as SHANK, neurexin and neuroligin families), others that regulate growth (such as HOXA1 and PTEN), or are involved in other aspects of brain development such as signaling pathways (eg those affecting calcium homeostasis).Reference Persico and Napolioni 38 Adding to the complexity, a recent genome-wide association study has identified loci of common CNVs across psychiatric disorders such as ASD, attention deficit hyperactivity disorder (ADHD), bipolar disorder, major depressive disorder, and schizophrenia.Reference Lee and Ripke 39 These genetic factors may play a significant role in influencing the neurobiology of the developing brain in ASD.Reference Willsey and State 40
The Developing Brain in ASD
Neuroimaging has ushered in an unprecedented understanding of both typical and atypical neurodevelopment; to understand the neuroimaging findings in context of ASD, it is important to understand the brain development in children with ASD.
It is widely accepted that the brain develops by a dynamic interplay between the genetic factors and experiences of the child. Although brain development starts in utero, infancy and toddlerhood are remarkable for peak synaptogenesis and generation of early neural circuitry; in concert with experiential/environmental factors, as well as genetically programmed pruning in childhood and adolescence, the connections and neural circuits are further sculpted.Reference Casey, Giedd and Thomas 41 , Reference Tau and Peterson 42 The brain attains 80% of its adult weight within the first 2 postnatal yearsReference Kretschmann, Kammradt, Krauthausen, Sauer and Wingert 43 : adult cerebral volume is attained by 5 years of age, with a significant reduction in gray matter (GM) after 12 years of age and a progressive increase in white matter (WM) throughout childhood and adolescence.Reference Casey, Giedd and Thomas 41 This pattern of decreasing GM and increasing WM is consistent with the sculpting of the neural circuitry, as well as laying down of the neural architecture. There is also regional variation in cortical maturation, with primary cortices developing earlier than association cortices.Reference Gogtay, Giedd and Lusk 44 , Reference Sowell, Thompson, Leonard, Welcome, Kan and Toga 45 In general, areas responsible for higher cortical functions mature later and have a more protracted course of maturation, such as in the prefrontal cortex.Reference Gogtay, Giedd and Lusk 44 , Reference Sowell, Thompson, Leonard, Welcome, Kan and Toga 45
Structural covariation in various cortical/subcortical regions of the maturing brain may also occur at the anatomical (eg, larger frontal lobe and a smaller cerebellum)Reference Mechelli, Friston, Frackowiak and Price 46 – Reference Li, Pu, Fan, Niu, Li and Li 48 and the network levels,Reference Zielinski, Gennatas, Zhou and Seeley 49 and may have a genetic and functional basis.Reference Rentería, Hansell and Strike 50 Abnormal development of a structure may thus influence abnormal development of other structure(s), and consequently, the functional networks.Reference Alexander-Bloch, Raznahan, Bullmore and Giedd 51
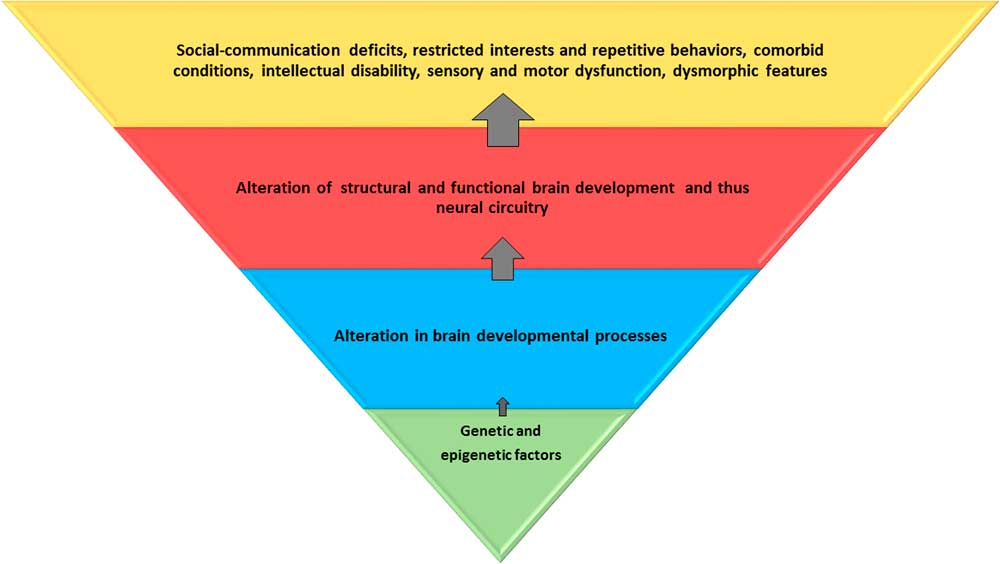
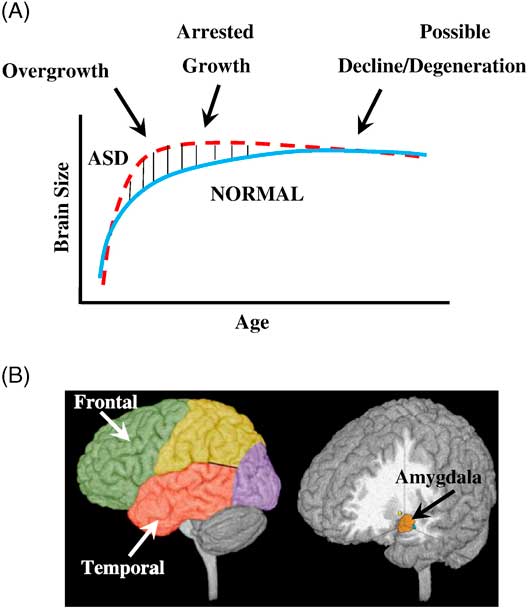
Converging evidence over the past 3 decades has established that the typical trajectory of brain development is altered in children with ASD (Figure 1); the process starts prenatallyReference Stoner, Chow and Boyle 52 , Reference Connors, Levitt and Matthews 53 and persists into adult life.Reference Courchesne, Redcay and Kennedy 54 , Reference Raznahan, Toro and Daly 55 Although at birth, the brain size may be normal or even smaller as compared to a typically developing (TD) child’s,Reference Courchesne and Pierce 56 there is accelerated growth starting around 6 months of age into toddlerhoodReference Courchesne, Redcay and Kennedy 54 , Reference Hazlett, Gu and McKinstry 57 – Reference Dawson, Munson, Webb, Nalty, Abbott and Toth 59 ; this is followed by slowing in brain growth by school age, with plateauing or developmental arrest (Figure 2).Reference Courchesne, Redcay and Kennedy 54 The early-altered trajectory affects the regional brain growth patterns, neural architecture, and connectivity. By late teenage years into adulthood, there may be a normalization of the brain size (referred to by some as “pseudo-normalization”Reference Zielinski, Prigge and Nielsen 60 ) or a decline into adulthood.Reference Stoner, Chow and Boyle 52

Figure 1 Genetic and epigenetic factors lead to alteration in brain developmental processes at the cellular and microscopic levels. This affects the global and regional brain structure and function, and consequently, the neural circuitry. These alterations result in core and associated behavioral and clinical features of autism spectrum disorder. The blue and red trapezoids represent potential endophenotypes; the red trapezoid can be captured by neuroimaging. Environmental influences may be relevant at all levels.

Figure 2 Three phases of growth pathology in autism. (A) Model of early brain overgrowth in autism that is followed by arrest of growth. Red line represents ASD, while blue line represents age-matched typically developing individuals. In some regions and individuals, the arrest of growth may be followed by degeneration, indicated by the red dashes that slope slightly downward. (B) Sites of regional overgrowth in ASD include frontal and temporal cortices and amygdala. (Reproduced from: Brain growth across the life-span in autism: age specific changes in anatomic pathology; Courchesne, Campbell, and Solso, Brain Research 1380 (2011):138–145, with permission from Elsevier B.V.)
Pathology at both the macroscopic and microscopic levels, both in structure and function, that affects the typical development of neural circuitry in the frontal, temporal, and cerebellar cortices, contributes to the early developmental and clinical features of ASD.Reference Courchesne and Pierce 56 , Reference Courchesne and Pierce 61 – Reference Casanova 63 Some have suggested that ASD is a disorder of primarily association cortices and higher-order cognitive and developmental functions.Reference Minshew and Williams 64
Given the early accelerated brain growth in infants and toddlers with ASD,Reference Courchesne, Karns and Davis 65 , Reference Courchesne, Carper and Akshoomoff 66 macrocephaly (increased head circumference beyond the 97th percentile) is one of the most replicated findings in children with ASD. In infants and toddlers, this correlates with increased total brain volume (TBV); there is a dissociation between macrocephaly and TBV beginning around 4–5 years of age.Reference Courchesne, Redcay and Kennedy 54 , Reference Herbert, Ziegler and Deutsch 67 However, macrocephaly in ASD is part of a general macrosomia and may not be specific to ASD,Reference Williams, Dagli and Battaglia 68 – Reference Campbell, Chang and Chawarska 70 as it has been associated with a number of genetic variants, such as those involving the HOX A1,Reference Conciatori, Stodgell and Hyman 71 , Reference Muscarella, Guarnieri and Sacco 72 TPH2,Reference Coon, Dunn and Lainhart 73 – Reference Egawa, Watanabe and Nunokawa 76 GLO1,Reference Sacco, Militerni and Frolli 75 , Reference Peculis, Konrade and Skapare 77 , Reference Gabriele, Lombardi and Sacco 78 and PTENReference Varga, Pastore, Prior, Herman and McBride 79 – Reference Frazier, Embacher, Tilot, Koenig, Mester and Eng 82 genes. Furthermore, family studies have found similar macrocephaly to be present in relatives of ASD probands.Reference Ramoz, Cai and Reichert 74 , Reference Sacco, Militerni and Frolli 75 , Reference Stevenson, Schroer, Skinner, Fender and Simensen 83 – Reference Lainhart, Piven and Wzorek 85
Neuroimaging in ASD
Neuroimaging has played a crucial role in delineating both the typical and atypical neurodevelopmental trajectories. Given ASD’s strong genetic basis with a known developmental trajectory, neuroimaging may further aid identification of endophenotypes, as, potentially, any consistent structural or functional imaging finding may, putatively, represent an endophenotype.
Over the past 4 decades, there has been remarkable progress in neuroimaging technology. Several neuroimaging techniques have been developed since the 1980s, and most have been applied to ASD research, including computerized tomography (CT), structural and functional magnetic resonance imaging (MRI), positron emission tomography (PET), single photon emission computerized tomography (SPECT), magnetic resonance spectroscopy (MRS), and diffusion tensor imaging (DTI). MRI, especially, given its ubiquity in neuroimaging research studies, has been instrumental in proffering new insights and supporting a priori hypotheses about ASD etiopathogenesis, thus aiding the study of structural, neurophysiological/functional, and neurocognitive endophenotypes. It has contributed to great advancements in knowledge about typical as well as the atypical brain development, aiding consilience of disparate research findings. The availability of high-resolution scanners and computer-based brain atlases for GM and WM (such as the Desikan-Killiany atlas,Reference Desikan, Ségonne and Fischl 86 the JHU-DTI atlas,Reference Mori, Oishi and Jiang 87 – Reference Wakana, Jiang, Nagae-Poetscher, Van Zijl and Mori 89 and others) has also enabled researchers in employing neuroimaging in these studies.
Both functional and structural imaging using magnetic resonance are non-invasive, and therefore, preferable for research in children. Neuroimaging combined with network-based computational approaches such as the graph theory are shedding light on the network-wide connectivity problems in ASD. Although any consistent/replicable structural or functional imaging finding may signify a neuroendophenotype, studying neuroimaging endophenotypes, on the other hand, has inherent limitations, such as reliability of findings depending upon the resolution of the image, challenges in training children with developmental and behavioral problems to lie still during imaging, and findings that may not be generalizable to the full spectrum of children with ASD (as most studies have involved higher-functioning children and adolescents who may be more easily trained to lie still than those who are lower-functioning). Most ASD neuroimaging studies have used either age matched TD children or those with other developmental delays or learning disabilities as control groups.
The following is a brief overview of some notable and reproducible findings in ASD (also see Table 1); additional comprehensive reviews are also available by other authors.Reference Minshew and Williams 64 , Reference Raznahan, Giedd and Bolton 90 – Reference Dichter 97
Table 1 Summary of notableFootnote * neuroimaging findings using magnetic resonance in children and adolescents with autism spectrum disorder delineated by structural MRI (sMRI), diffusion tensor imaging (DTI), and functional MRI (fMRI).

GM: gray matter; WM: white matter; TBV: total brain volume; BG: basal ganglia; CC: corpus callosum; FA: fractional anisotropy; MD: mean diffusivity; DMN: default mode network.
* Please refer to reviews listed in the text for a more exhaustive list.
Structural neuroimaging
Structural MRI (sMRI) studies, which have focused on the neuroanatomical aspects of brain development, have been instrumental in revealing progression of brain developmental trajectory in ASD. They have been used to examine both cortical and subcortical regions; major findings in each of these areas are described next.
Cortex and regional
sMRI has been used to measure total brain volume (TBV) as well as volume of specific brain structures; it has also enabled study of shapes and other metrics, including growth patterns of specific structures, using regions of interest (ROI) and voxel (“volumetric pixel”)-based morphometry (VBM) analyses. Other cortical metrics have included measurement of cortical thickness (CT), surface area (SA), and cortical volumes (gray matter volume, GMV; white matter volume, WMV), with cortical volume being a product of CT and SA. Notably, CT and SA have been hypothesized to have dissociable developmental trajectories with, putatively, different genetic and neurodevelopmental basis.Reference Goldman-Rakic 98 , Reference Panizzon, Fennema-Notestine and Eyler 99
Some initial studies found increases in total brain volume (TBV) in ASD versus TD subjects, with increases noted both in cortical gray matter (GM) and white matter (WM).Reference Courchesne, Karns and Davis 65 , Reference Hazlett, Poe and Gerig 100 Other studies have revealed dissociation in the volumes of the cerebrum and the subcortical structures, eg, a study of 15-year-olds with autism compared to TD found increases in volumes of WM, no changes in other structures (caudate, globus pallidus, putamen, diencephalon, cerebellum, and brainstem), a reduced volume in others (cerebral cortex, hippocampus-amygdala).Reference Herbert, Ziegler and Deutsch 67
The frontal and temporal lobes have been found to show the greatest increases in the mean cortical volumes, both in GM and WM, with limited to no effect on the parietal and occipital lobes.Reference Carper, Moses, Tigue and Courchesne 101 – Reference Hazlett, Poe and Gerig 103 There may also be variations within a specific region of a particular lobe, such as enlargement in the dorsolateral prefrontal cortex and medial frontal regions, with limited effect on other areas, such as the precentral cortex.Reference Carper and Courchesne 104 Others have found enlargement in precentral regions.Reference Mostofsky, Burgess and Larson 105
Subcortical structures
Amygdala
The amygdala has been the focus of several studies in children with ASD, given its important role in attachment security,Reference Lemche, Giampietro and Surguladze 106 socioemotional processing, and understanding of social contexts and personal space.Reference Baron-Cohen, Ring, Bullmore, Wheelwright, Ashwin and Williams 107 – Reference Schultz 110 The trajectory of growth of the amygdala has been correlated to the pattern of early brain overgrowth in ASD.Reference Courchesne, Pierce and Schumann 111 Overall, the results have been inconsistent, with studies of younger children showing larger volumesReference Schumann, Barnes, Lord and Courchesne 112 and those in older children showing no difference compared to TD children.Reference Aylward, Minshew and Goldstein 113 – Reference Stanfield, McIntosh, Spencer, Philip, Gaur and Lawrie 115
Cerebellum
The cerebellum (especially, in its posterior regions) is structurally and functionally connected via afferent and efferent pathways to brain regions involved not only in sensorimotor, but also in language, cognition, executive, and socioemotional functioning.Reference Ito 116 – Reference Stoodley and Schmahmann 119 Morphometric studies of ASD subjects have found increased total cerebellar volume,Reference Herbert, Ziegler and Deutsch 67 , Reference Stanfield, McIntosh, Spencer, Philip, Gaur and Lawrie 115 , Reference Piven, Saliba, Bailey and Arndt 120 – Reference Sparks, Friedman and Shaw 122 reduced mid-sagittal SA for vermal lobules VI–VII,Reference Courchesne, Yeung-Courchesne, Hesselink and Jernigan 123 – Reference Saitoh and Courchesne 125 and hypoplasia of the posterior vermis in ASD.Reference Courchesne, Yeung-Courchesne, Hesselink and Jernigan 123 , Reference Murakami, Courchesne, Press, Yeung-Courchesne and Hesselink 124 , Reference Courchesne, Townsend and Akshoomoff 126 – Reference Courchesne, Campbell and Solso 129 Meta-analyses of VBM studies have revealed GM decreases in the right Crus I, lobule VIII, and lobule IX of the cerebellum.Reference Duerden, Mak‐Fan, Taylor and Roberts 130 – Reference Stoodley 132 Others have found decreased GM in the left Crus I, or even increased GM in the cerebellum overall.Reference Duerden, Mak‐Fan, Taylor and Roberts 130 , Reference Yu, Cheung, Chua and McAlonan 131 In one studyReference Cleavinger, Bigler, Johnson, Lu, McMahon and Lainhart 133 of males, investigators found that cerebellar volume correlated with TBV for ASD and controls.
Basal ganglia
The basal ganglia (BG) are purported to play an important role in cognition and modulation of motor control via their participation in frontostriatal, thalamocortical, and limbic circuits.Reference Alexander and Crutcher 134 – Reference Utter and Basso 137 They have been studied for repetitive behaviors in ASD.Reference Hollander, Anagnostou and Chaplin 138 , Reference Estes, Shaw and Sparks 139 The most consistent finding pertaining to the BG in ASD has been increased caudate volume; this increase may be proportional to the increase in TBV.Reference Herbert, Ziegler and Deutsch 67 , Reference Sears, Vest, Mohamed, Bailey, Ranson and Piven 140 – Reference Hardan, Kilpatrick, Keshavan and Minshew 143 Such increases have not been consistently reported for other BG structures, including the globus pallidus and the putamen.Reference Hollander, Anagnostou and Chaplin 138 Abnormal shapes of BG structures, especially in boys with ASD, have been associated with the motor as well as social-communication deficits.Reference Qiu, Adler, Crocetti, Miller and Mostofsky 144
Corpus callosum
The corpus callosum (CC) contains WM fibers that connect the 2 hemispheres, and is involved in interhemispheric communication.Reference Gazzaniga 145 Decreased CC size in youth with ASD compared to controls has been consistently reportedReference Anderson, Druzgal and Froehlich 146 , Reference Frazier and Hardan 147 : reductions have been localized in mid-sagittal area,Reference Egaas, Courchesne and Saitoh 148 anterior corpus callosum,Reference Hardan, Minshew and Keshavan 149 , Reference Waiter, Williams, Murray, Gilchrist, Perrett and Whiten 150 and body and splenium posteriorly.Reference Piven, Bailey, Ranson and Arndt 151 Decreased posterior thickness of the CC has been reported.Reference Freitag, Luders and Hulst 152 Reduced size of the CC has been associated with reduced integration of informationReference Just, Cherkassky, Keller, Kana and Minshew 153 and slower processing speedReference Alexander, Lee and Lazar 154 ; reduced size of the anterior CC may affect connectivity between areas associated with theory of mind (ToM).Reference Mason, Williams, Kana, Minshew and Just 155 Increased CC volume ASD as compared to non-autistic controls has been reported, especially in those with macrocephalyReference Kilian, Brown and Hallam 156 ; others have not found any difference, including a recent study that was adequately powered.Reference Rice, Bigler and Cleavinger 157 , Reference Lefebvre, Beggiato, Bourgeron and Toro 158
Other areas
Other areas that have been investigated structurally but have shown inconsistencies include the hippocampusReference Aylward, Minshew and Goldstein 159 – Reference Barnea-Goraly, Frazier and Piacenza 164 ; the fusiform gyrus involved in face processingReference Herbert, Harris and Adrien 165 – Reference Waiter, Williams, Murray, Gilchrist, Perrett and Whiten 168 ; the superior temporal gyrus involved in processing of eye movementsReference Levitt, Blanton and Smalley 169 – Reference Zilbovicius, Meresse, Chabane, Brunelle, Samson and Boddaert 171 ; the left planum temporale involved in auditory processing, which was increased in volume on the left side in ASD in children and adolescentsReference Herbert, Harris and Adrien 165 , Reference Rojas, Bawn, Benkers, Reite and Rogers 172 and decreased in adultsReference Rojas, Bawn, Benkers, Reite and Rogers 172 , Reference Rojas, Camou, Reite and Rogers 173 ; the inferior frontal gyrus (Broca’s area), with decreased volumes in adults with ASDReference Abell, Krams and Ashburner 174 ; and the brainstem.Reference Jou, Minshew, Melhem, Keshavan and Hardan 175
Diffusion tensor imaging
The genetically programmed processes of synaptogenesis and pruning that lead to the development of modular networks, locally as well as regionally, are altered in children with ASD, affecting myelination, and thus compromising WM integrity. As a consequence, there may be dysmaturation of the WM characterized by microstructural changes/disorganization.Reference Shukla, Keehn and Müller 176 DTI is a variation of MRI that has been applied to developing brains to study these WM changes—both to study local connectivity as well as long WM tracts and fasciculi that connect regions and lobes.Reference Catani 177 – Reference Jou, Jackowski, Papademetris, Rajeevan, Staib and Volkmar 182 It is based on the Brownian diffusion of water molecules along the myelinated axons and WM tracts, which may be hampered by crossing fibers. Metrics such as fractional anisotropy (FA) and mean diffusivity (MD) have been used to measure the directionality and the amount of diffusion, respectively, in a particular region of interest or at the level of individual voxels. It has been successfully used to confirm anatomical WM findings in ASD, and has yielded rich 3-dimensional maps of the WM circuits and tracts.
DTI has been used to verify the connectivity in ASD based on the hypothesis that the disconnection in ASD is marked by underconnectivity in distant regions intracortically and corticocortically, with local overconnectivity and predominance of short U (arcuate) fibers within the cortex.Reference Herbert, Ziegler and Makris 183 , Reference Shukla, Keehn, Smylie and Müller 184 This atypical connectivity should be viewed in context of the structurally and functionally disorganized regional variation in the macrocephalic ASD brain, as well as the minicolumnar abnormalities reported in neuropathological studies.Reference Casanova, van Kooten and Switala 185 – Reference Buxhoeveden, Semendeferi, Buckwalter, Schenker, Switzer and Courchesne 187 A majority of the studies have found reduced FA, indicating increased WM microstructural disorganization especially in the frontal and temporal lobe areas,Reference Barnea-Goraly, Kwon, Menon, Eliez, Lotspeich and Reiss 188 – Reference Shukla, Keehn, Smylie and Müller 193 including in young childrenReference Ben Bashat, Kronfeld-Duenias and Zachor 194 ; some have found increased MD.Reference Lee, Bigler and Alexander 190 , Reference Sundaram, Kumar, Makki, Behen, Chugani and Chugani 191 One study found reduced FA in age-matched unaffected siblings as compared to children with ASD, suggesting that it may be a potential marker of genetic risk.Reference Barnea-Goraly, Lotspeich and Reiss 195 A recent study of school-aged childrenReference Peterson, Mahajan, Crocetti, Mejia and Mostofsky 196 found widespread increases in MD in many regions of the left hemisphere in children with ASD as compared to TD children, supporting the left hemispheric abnormality/atypical hemispheric dominance that has been hypothesized in ASD for the past 3 decades.Reference Dawson, Warrenburg and Fuller 197 – Reference Kleinhans, Müller, Cohen and Courchesne 200
Functional neuroimaging
Functional MRI (fMRI) has been used to study neural activity and connectivity interregionally, corticocortically, and cortico-subcortically. It has been instrumental in establishing ASD as a disorder that involves aberrant or diminished functional connectivity and atypical specialization, supporting ASD’s characterization as a “disconnection syndrome.”Reference Geschwind and Levitt 17 fMRI has helped correlate neurocognitive abnormalities of ASD with anatomical and functional connections. Both (a) task-dependent and (b) resting-state fMRI have been used to investigate neurocognitive and behavioral aspects of ASD, yielding information about brain circuitry, which may be dependent upon specific endophenotypes.Reference Dichter 97
Task-dependent fMRI
Task-dependent fMRI has been useful in studying deficits that may be region-dependent and based on a specific neurocognitive task, such as face processing, emotional processing, attention or executive functions, imitation, sensory perception and processing of auditory or visual information, language functions, motor functions, ToM, and others.Reference Casanova, El-Baz and Suri 95 Individuals with ASD show neurocognitive deficits on tasks that may be a reflection of a behavioral dysfunction—hypoactivation or abnormal activation, and may involve higher-order cognitive functioning processed in association areas rather than the primary cortical areas. fMRI has been used to study aspects of the core features of ASD, including social cognition, language deficits, and repetitive behaviors (RBs).Reference Dichter 97
Possibly, the most well studied of deficits in ASD is the hypoactivation of fusiform gyrus to faces and facial expressions.Reference Hubl, Bolte and Feineis-Matthews 201 – Reference Corbett, Carmean and Ravizza 206 The findings, though, have been inconsistent, which may be partly due to impaired attention to social cues rather than processing deficits.Reference Pierce, Muller, Ambrose, Allen and Courchesne 166 , Reference Dawson, Meltzoff, Osterling, Rinaldi and Brown 207 , Reference Jones, Carr and Klin 208 Reduced interest in interacting with faces may lead to reduced activation of fusiform gyrus; therefore, the lack of social experience may contribute to the hypoactivation.Reference Schultz, Grelotti and Klin 209 , Reference Jones, Carr and Klin 210
Studies of the amygdala have also been mixed, with wide variability in activation or abnormal/differential activation, such as activation to lower faces but not to the whole face.Reference Dalton, Nacewicz and Johnstone 202 , Reference Schultz, Grelotti and Klin 209 , Reference Ishitobi, Kosaka and Omori 211 , Reference Ahmed and Vander Wyk 215 The amygdala has been investigated in context of ToM deficits in ASD, and it is hypothesized that there may be impaired amygdala modulation rather than hypoactivation in social contexts.Reference Baron-Cohen, Ring, Bullmore, Wheelwright, Ashwin and Williams 107 , Reference Howard, Cowell and Boucher 108 A recent study used fMRI to study face processing in BAP and found similarities in those with BAP to those in ASD, with hyperactivation in FG and amygdala in individuals with aloof personality vs. hypoactivation in those with non-aloof personality.Reference Yucel, Parlier and Adolphs 214
Hypoactivation has been reported in the posterior superior temporal sulcus, which is part of the ventral visuomotor stream, in response to biological motion cues.Reference Ahmed and Vander Wyk 215 , Reference Ciaramidaro, Bolte and Schlitt 216 Activation of this region may be related to phenotypic expression of social deficits in ASD and may not be a shared genetic liability with unaffected siblings.Reference Kaiser, Hudac and Shultz 217 Mirror neuron system dysfunction in the inferior frontal gyrus is thought to have a role deficits in mentalizing, empathy, and understanding others’ intentionsReference Iacoboni 218 ; it has been found to be hypoactive during imitation and observation of facesReference Leslie, Johnson-Frey and Grafton 219 , Reference Dapretto, Davies and Pfeifer 220 and of emotional expressions.Reference Iacoboni and Dapretto 221 , Reference Southgate and Hamilton 222
Communication/language delays and deficits are core features of ASD. As language is a left hemispheric function, delays in language development may be associated with atypical hemispheric lateralization, ie, decreased left hemispheric dominance.Reference Kleinhans, Müller, Cohen and Courchesne 223 Others have found reduced synchrony between the language-associated areas,Reference Kana, Keller, Cherkassky, Minshew and Just 224 atypical prosody,Reference Wang, Lee, Sigman and Dapretto 225 , Reference Eigsti, Schuh, Mencl, Schultz and Paul 226 processing delays,Reference Knaus, Silver, Lindgren, Hadjikhani and Tager-Flusberg 227 and recruitment of atypical areas for language processing.Reference Eyler, Pierce and Courchesne 228 , Reference Mody, Manoach and Guenther 229
Although not specific to ASD, RBs in ASD have been associated with dysfunction of the frontostriatal pathways and are thought to reflect atypical cognitive control, including response inhibition deficitsReference Mosconi, Kay and D’Cruz 230 , Reference Solomon, Ozonoff and Ursu 231 and compensatory/adaptive behaviors in the context of sensory deficits.Reference Lewis and Kim 232 fMRI studies have used tasks assessing motor control, response inhibition and monitoring, and others. The results have been mixed with both hypoactivation and hyperactivation reported in the frontostriatal pathways, depending upon the task and the analytic methods used.Reference Delmonte, Gallagher, O'Hanlon, McGrath and Balsters 233 Notably, genes for RBs are thought to be independent of those influencing social communication, and RBs may have a familial inheritance.Reference Mandy and Skuse 234 – Reference Silverman, Smith and Schmeidler 236
Task-dependent fMRI has also revealed the presence of functional underconnectivity in frontal-subcortical as well as frontal-posterior networks in ASD.Reference Just, Keller, Malave, Kana and Varma 237 – Reference Mostofsky, Powell, Simmonds, Goldberg, Caffo and Pekar 240 In an fMRI study that used a motor task,Reference Mostofsky, Powell, Simmonds, Goldberg, Caffo and Pekar 240 children with ASD, compared to controls, demonstrated diffusely decreased connectivity across the motor execution network, including the frontal-striatal and frontal-cerebellar. Other studies have revealed “decreased synchronization” or “low bandwidth” between frontal-posterior regions, implying decreased connectivityReference Just, Keller, Malave, Kana and Varma 237 during a language task,Reference Just, Cherkassky, Keller and Minshew 239 a task of executive function,Reference Just, Cherkassky, Keller, Kana and Minshew 238 ToM,Reference Kana, Keller, Cherkassky, Minshew and Just 241 working memory,Reference Koshino, Carpenter, Minshew, Cherkassky, Keller and Just 242 , Reference Koshino, Kana, Keller, Cherkassky, Minshew and Just 243 inhibitory control,Reference Kana, Keller, Minshew and Just 244 and tasks of visuospatial cognition.Reference Damarla, Keller and Kana 245
Resting-state fMRI
Resting-state functional MRI (rs-fMRI) is based on the finding that, even at rest, there is neural activity in disparate brain regions that may be functionally connected.Reference Biswal, Zerrin Yetkin, Haughton and Hyde 246 This activity can be captured by measuring the synchronous fluctuations of blood oxygen level–dependent (BOLD) signals in these regions, at rest, without the use of a neurocognitive task.Reference Huettel, Song and McCarthy 247 Rs-fMRI has thereby become an important tool for studying patterns of functional brain connectivity.Reference van den Heuvel and Hulshoff Pol 248 – Reference Uddin 250 Various analytic approaches have been applied, leading to new insights; eg, a recent study found that increased underconnectivity in the temporooccipital region was associated with higher symptom severity in adolescents with ASD, as compared to underconnectivity in the frontal regions.Reference Keown, Shih, Nair, Peterson, Mulvey and Müller 251
Rs-fMRI has also delineated the default mode network (DMN), a core network that is active when the brain is at rest, with nodal regions composed of the ventral medial prefrontal cortex, posterior cingulate cortex, inferior parietal lobule, lateral temporal cortex, dorsomedial prefrontal cortex, and hippocampal formation.Reference Buckner, Andrews‐Hanna and Schacter 252 Altered functional connectivity has been reported in the DMN in children with ASDReference Assaf, Jagannathan and Calhoun 253 – Reference Supekar, Uddin, Prater, Amin, Greicius and Menon 255 with functional underconnectivity in anterior–posterior connections.Reference Cherkassky, Kana, Keller and Just 256 A recent study of a large heterogeneous sample of individuals with ASD, using rs-fMRI, found that the strength of connectivity within and between distinct functional subregions of the precentral gyrus was related to the ASD diagnosis and to the severity of ASD traits.Reference Nebel, Joel and Muschelli 257
Discussion
As described above, there is a wide range of findings in structural and functional neuroimaging studies in ASD, which may indicate potential endophenotypes. Many of these findings, unfortunately, have not been consistent or replicated. Therefore, leveraging these findings from a neuroendophenotype perspective is an endeavor that is still in its conceptual stages. To be clinically meaningful, these findings will require the combined efforts of ASD researchers focused on different aspects of basic, genetic, neuroimaging, and clinical research.Reference Ecker and Murphy 258 The field is only beginning to scratch the surface, so to speak, of the complex processes that lead to atypical brain development, which may involve nanoscalar aberrations to macroscopic whole brain, regional, lobar, and network-wide alterations that occur with the increasing age of the child with ASD. Studies that pair neuroimaging findings with genetics and behavioral findings (imaging genetics) may bridge the genetic complexity of the disorder with the heterogeneity of the phenotypes. Such studies may potentially reveal the endophenotypes in ASD, which are rooted in the genetic program of the child.
Despite the gains made to date, there are several other areas in ASD research where endophenotype-oriented neuroimaging research can make important contributions. For example, it is imperative that genetic heterogeneity of ASD be taken into account when designing neuroimaging studies. Pairing genetic studies with studies that compare neuroimaging findings in those with syndromic ASD to those with “idiopathic autism,” common gene variants, or BAP or to TD non-autistic populations may further help to correlate the genetic basis to an observed endophenotype.
Elucidating whether the co-occurrence of clinically diagnosable disorders or traits in ASD is true heterotypic comorbidity or if these are distinct endophenotypes that may be indicative of “an autism” is perhaps one of the most pressing areas of investigation. Some disorders, for example ADHD, have a genetic overlap with ASD.Reference Reiersen and Todorov 259 – Reference Reiersen, Constantino, Volk and Todd 261 As ADHD occurs in 16% to 78% of children with ASD, it is a commonly diagnosed and treated condition in children with ASDReference Murray 262 , Reference Hanson, Cerban, Slater, Caccamo, Bacic and Chan 263 ; conversely, ASD traits occur in 20% to 50% of children with ADHD,Reference Rommelse, Franke, Geurts, Hartman and Buitelaar 264 and their presence may be associated with more impaired functioning.Reference Kotte, Joshi and Fried 265 Yet, in contrast to the trajectory in ASD, children with ADHD have a neurodevelopmental trajectory marked by delayed cortical maturation (and thinner cortices) by several years.Reference Shaw, Eckstrand and Sharp 266 In spite of the recent increase in research focused on this issue, it remains to be clarified whether these are co-occurring conditions or if ASD with ADHD is a separate neuroendophenotype of ASD (and conversely, whether the presence of ASD traits in ADHD is a separate neuroendophenotype).Reference Rommelse, Geurts, Franke, Buitelaar and Hartman 267 , Reference Gargaro, Rinehart, Bradshaw, Tonge and Sheppard 268 Similarly, anxiety disorders, which co-occur in 40% to 50% of children with ASD, are frequently the target of psychotropic medications.Reference White, Schry and Maddox 269 , Reference Vasa, Carroll and Nozzolillo 270 It remains to be determined whether some forms of anxiety are core features of ASD, such as wanting predictability and preference for sameness, and when obsessive-compulsive symptoms should be considered to be beyond merely repetitive and ritualistic behaviors of ASD. One could conjecture that using neuroimaging (for example, studying limbic system connectivity in the case of anxiety disorders) to subtype ASD phenotypes with comorbid disorders may help us to develop more targeted and effective therapies.
This delineation of neuroendophenotypes may also have implications insofar as identifying pretreatment abnormalities, the choice of treatment approaches, and monitoring response to psychotropic medications and the outcomes are concerned. Clinical trials tailored to specific subgroups with a particular endophenotype may help with more personalized and effective medication interventions.Reference Reiersen, Constantino, Volk and Todd 261 Furthermore, subtyping ASD based on neuroendophenotypes may lead to more informative predictors of psychopathology, which could facilitate provision of more appropriate supports for the child with ASD at school, home, and in the community, thus affecting their trajectories of development, and consequently, adolescent and adult outcomes.
Despite possible applications, and the explosive increase in the number of studies in ASD over the past 2 decades, findings from vast majority of the neuroimaging studies have yet to be fully integrated with neuroendophenotype research, which may involve recruiting unaffected relatives of children with ASD, besides the children themselves. Neuroimaging itself is limited by the spatial and temporal limits of the image resolution; although macroscopic-level changes have been revealed by VBM and ROI analyses, visualizing microscopic-level changes is still not possible. In ASD, as the neurodevelopmental processes involve cellular level abnormalities, which affect brain development (such as genetically determined distinct pathways leading to increases in surface area and in cortical thickness, and smaller minicolumns), there is a limit to understanding these endophenotypes directly. The challenge to using large-scale neuroimaging in endophenotype studies is also the prohibitive cost of conducting these studies and recruiting enough non-autistic relatives, in addition to the probands, to ensure above-adequate statistical power, as most studies so far have had modest-sized cohorts. The cohorts themselves have been high-functioning and highly selective, and there is a stark lack of population-based studies.
Nevertheless, the current convergent findings lay the groundwork for future research to disentangle the complexities of atypical brain development in children with ASD. The fact that there is increased local, national, and global “connectivity” between ASD researchers from disparate fields of research is a positive development that may help further neuroendophenotype research and, concomitantly, provide greater insight into the etiopathogenesis of ASD, translating into better therapies.
Conclusions
Endophenotypes are internal biomarkers or traits that represent a gene or a set of genes. Identification of endophenotypes may help further the understanding of the etiology and pathogenesis of a complex, genetically rooted disorder, such as ASD. The wide array of structural and functional neuroimaging findings may represent neural endophenotypes that may be unique to ASD when paired with research in ASD genetics, especially in family-based studies and BAP subgroups. Endophenotype-oriented neuroimaging research may potentially help with delineating subgroups that may shed light on comorbid disorders in ASD, with monitoring treatment responses or carrying out clinical trials to personalize interventions. Although in its early stages, and despite the technical and practical limitations of neuroimaging, a concerted effort by researchers studying different aspects of ASD may help achieve this goal.
Disclosures
Dr. Mahajan has no biomedical or financial conflicts of interest to declare. Dr. Mostofsky has received funding from the following grants: grant sponsor: NIH/NINDS, grant number: R01NS048527-08; grant sponsor: Autism Speaks Foundation, Grant number: 2506.