INTRODUCTION
Wood density (specific gravity) is often related to other ecological traits such as mortality (Muller-Landau Reference MULLER-LANDAU2004, Osunkoya et al. Reference OSUNKOYA, SHENG, MAHUD and DAMIT2007), growth rate (King et al. Reference KING, DAVIES, NUR SUPARDI and TAN2005, Suzuki Reference SUZUKI1999, Wright et al. Reference WRIGHT, MULLER-LANDAU, CONDIT and HUBBELL2003), mechanical properties (van Gelder et al. Reference VAN GELDER, POORTER and STERCK2006), hydraulic properties (Hacke & Sperry Reference HACKE and SPERRY2001, Hacke et al. Reference HACKE, SPERRY, POCKMAN, DAVIS and MCCULLOH2001) and shade tolerance (van Gelder et al. Reference VAN GELDER, POORTER and STERCK2006). Because of these correlations, we may expect differences in the wood density of species to at least partially reflect differences in function (Swenson & Enquist Reference SWENSON and ENQUIST2007, Wright et al. Reference WRIGHT, ACKERLY, BONGERS, HARMS, IBARRA-MANRIQUEZ, MARTINEZ-RAMOS, MAZER, MULLER-LANDAU, PAZ, PITMAN, POORTER, SILMAN, VRIESENDORP, WEBB, WESTOBY and WRIGHT2007). Since spatial distributions of tree species in tropical forests are often associated with microhabitat within a local area (Davies et al. Reference DAVIES, TAN, LAFRANKIE, POTTS, Roubik, Sakai and Hamid2005, Gunatilleke et al. Reference GUNATILLEKE, GUNATILLEKE, ESUFALI, HARMS, ASHTON, BURSLEM and ASHTON2006, Harms et al. Reference HARMS, CONDIT, HUBBELL and FOSTER2001, Itoh et al. Reference ITOH, YAMAKURA, OHKUBO, KANZAKI, PALMIOTTO, LAFRANKIE, ASHTON and LEE2003, John et al. Reference JOHN, DALLING, HARMS, YAVITT, STALLARD, MIRABELLO, HUBBELL, VALENCIA, NAVARETTE, VALLEJO and FOSTER2007), we would expect that the spatial distribution of species is caused at least partly by functional differences among species (Kraft et al. Reference KRAFT, VALENCIA and ACKERLY2008). We therefore postulated significant associations between spatial distributions of stand-level wood density and microhabitat.
Both positive and negative data exist for a spatial association between wood density and microhabitat. In a Costa Rican tropical montane forest, Lawton (Reference LAWTON1984) found that the stand-level wood density was higher on ridge crests than slopes and ravines, probably due to species-specific differences in mechanical tolerance toward wind. Kraft et al. Reference KRAFT, VALENCIA and ACKERLY(2008) reported that stand-level wood density was higher on ridges than valleys within a 25-ha lowland rain forest in Ecuador. However, Paoli et al. Reference PAOLI, CURRAN and SLIK(2008) found only small differences in stand-level mean wood densities among forests on alluvial, sedimentary and granite soils within a 340-ha area in Gunung Palung, West Kalimantan, Indonesia.
We should take into account the phenotypic plasticity of wood density because wood density is known to vary not only among species but also within species with genetic differentiation and growing conditions (Koubaa et al. Reference KOUBAA, ZHANG, ISABEL, BEAULIEU and BOUSQUET2001). If intraspecific variation is substantially large within a local population, the observed relationships between wood density and microhabitats are possibly due to the difference in micro-environments rather than the species-specific difference in wood density. However, few studies have examined intraspecific variation in wood density of tropical tree populations (Osunkoya et al. Reference OSUNKOYA, SHENG, MAHUD and DAMIT2007).
In this study, we hypothesized that wood density reflects species-specific difference in function and difference in wood density would cause spatial associations between tree species and topographic habitat in a northern Thai tropical montane forest. We measured the wood density of 515 trees of 72 common species within a 15-ha plot, and analysed intra- and interspecific variation and spatial distributions of stand-level wood densities. Our specific objectives were to evaluate the relative importance of intra- and interspecific variation in wood density; analyse the relationships between wood density and other ecological traits, i.e. maximum size, sapling mortality and sapling growth by species; and analyse fine-scale spatial distribution of stand-level wood density and its relationship to topography.
METHODS
Study site and permanent plot
The study was conducted in Doi Inthanon National Park, northern Thailand (18°24′–18°40′ N, 98°24′–98°42′ E). The park covers an area of 482 km2, and its elevation ranges from 400 to 2565 m asl. Mean annual rainfall and mean monthly minimum and maximum temperatures at the Royal Project Doi Inthanon Station (1300 m asl; 1993–2006) were 1940 mm, 16.4 °C and 26.3 °C, respectively. A distinct seasonality occurs in rainfall; the dry season is from December to April and the rainy season starts in May and ends in November. The vegetation of Doi Inthanon National Park is divided into three zones along elevation gradients: the lowland (400–850 m asl), transitional (850–1400 m asl) and montane (1400–2500 m asl) zones (Teejuntuk et al. Reference TEEJUNTUK, SAHUNALU, SAKURAI and SUNGPALEE2002). The montane zone is further divided into lower and upper montane forests at approximately 1800 m asl (Santisuk Reference SANTISUK1988). Tree species diversity increases with elevation up to around 1800 m, and then decreases toward the summit (Teejuntuk et al. Reference TEEJUNTUK, SAHUNALU, SAKURAI and SUNGPALEE2002).
A 15-ha permanent plot was established within the lower montane forest zone, which had the most diverse vegetation at the site (18°31′24″N, 98°29′42″E, c. 1700 m asl). Bedrock within the plot comprises post-Silurian and post-Permian granite and pre-Cambrian gneiss (Pendleton Reference PENDLETON1962). Soils in the plot are coarse, sandy and well drained (Kanzaki et al. Reference KANZAKI, HARA, YAMAKURA, OHKOBO, TAMURA, SRI-NGERNYUANG, TEEJUNTUK, BUNYAVEJCHEWIN, Losos and Leigh2004). The relative elevations at 10 × 10-m grid points in the plot were measured using a surveying instrument with a compass and a level (LS-25; Ushikata Co. Ltd., Tokyo, Japan). All living trees ≥ 1 cm in diameter at breast height (dbh; 140 cm above the ground) were measured, tagged, mapped and identified to species. The first tree census was completed in March 2000 and the second in March 2003. In terms of basal area, Fagaceae and Lauraceae were the dominant families. The most abundant species was Mastixia euonymoides (Cornaceae) followed by Quercus eumorpha (Fagaceae), Manglietia garrettii (Magnoliaceae), Calophyllum polyanthum (Guttiferae), Quercus brevicalyx (Fagaceae) and Cryptocarya densiflora (Lauraceae). Further details of the plot are given elsewhere (Hara et al. Reference HARA, KANZAKI, MIZUNO, NOGUCHI, SRI-NGERNYUANG, TREEJUNTUK, SUNGPALEE, OHKUBO, YAMAKURA, SAHUNALU, DHANMANONDA and BUNYAVEJCHEWIN2002, Kanzaki et al. Reference KANZAKI, HARA, YAMAKURA, OHKOBO, TAMURA, SRI-NGERNYUANG, TEEJUNTUK, BUNYAVEJCHEWIN, Losos and Leigh2004, Noguchi et al. Reference NOGUCHI, ITOH, MIZUNO, SRI-NGERNYUANG, KANZAKI, TEEJUNTUK, SUNGPALEE, HARA, OHKUBO, SAHUNALU, DHANMMANONDA and YAMAKURA2007, Sri-ngernyuang et al. Reference SRI-NGERNYUANG, KANZAKI, MIZUNO, NOGUCHI, TREEJUNTUK, SUNGPALEE, HARA, OHKUBO, YAMAKURA, SAHUNALU, DHANMANONDA and BUNYAVEJCHEWIN2003).
Wood density measurement
Wood densities were measured for all common species that had more than five individuals in the 15-ha plot (72 species, 54 genera, 33 families; Appendix 1). For each species, 4–26 sample trees (mean = 7.2) were selected from a variety of topographies within the plot. We selected sample trees of various sizes in each species, but all were > 10 cm dbh. The dbh range of sampled trees was 10–158 cm, varying with the maximum size of each species. A wood core was extracted from each sample tree between 1 and 1.3 m above the ground on the uphill side of the trunk using an increment borer with a 5.15 mm core diameter (Mattson, Mora, Sweden). The average length of the wood core was 90 mm for smaller trees (dbh < 30 cm) and 150 mm for larger trees (dbh > 30 cm). The diameters at both ends of each core and its length were measured immediately with digital callipers. The green volume was calculated by multiplying the length by the mean cross-sectional area of the two ends. All wood samples were oven-dried at 85 °C to constant mass (usually 5–7 d), and then weighed to the nearest 0.001 g. Wood density was calculated as dry weight divided by green volume. For more details of wood density measurement, see Chave et al. Reference CHAVE, MULLER-LANDAU, BAKER, EASEDALE, STEEGE and WEBB(2006).
Analysis of intra- and interspecific variation
To determine the degree of phenotypic variation in wood density within a species, we used analysis of variance (ANOVA) to partition total variance in wood density (across all samples, n = 515) into family, genus and species levels. When intraspecific variation is small compared with interspecific variation, a larger proportion of the total variance would be attributable to species.
Demographic properties of species
To analyse correlations between wood density and demographic properties of species, we calculated maximum sizes, mortality rates and dbh growth rates for the study species. Maximum size was the maximum diameter of each species that we found in the plot. Relative dbh growth rate (RGR; y−1) was calculated for each individual as (lnD1 – lnD0)/ΔT, where D0 and D1 are the dbh values at the first and second census, respectively, and ΔT is the time interval between the two censuses (interval range was 2.9–6.1 y). Subsequently, RGRs were averaged for each species. Annual mortality (λ), or specifically, the exponential mortality coefficient (Sheil et al. Reference SHEIL, BURSLEM and ALDER1995), is expressed by
where N is the number of trees and t is time in y. We made estimates for each species using a maximum-likelihood method (Kubo et al. Reference KUBO, KOHYAMA, POTTS and ASHTON2000). Growth and mortality rates were calculated only for saplings (1 ≤ dbh ≤ 5 cm) because these parameters were size-dependent and we could not get reliable values for larger trees of many species due to small sample sizes. We omitted the growth and mortality rates of two species with < 30 saplings in the plot.
Relationships between wood density and each demographic trait (i.e. maximum diameter, RGR and mortality rate) were analysed by model II regression analysis (which is known as reduced major axis analysis (RMA)) since both wood density and demographic traits include estimation errors. Confidence intervals for regression slopes were calculated with standard linear regression approximations (Sokal & Rohlf Reference SOKAL and ROHLF1995). The RGR and mortality rate were log10-transformed before analysis.
Spatial distribution of wood density
To check local spatial distribution of stand-level wood density, we divided the plot into 375 20 × 20-m quadrats and calculated two types of mean wood density for each quadrat, i.e. the stem-based mean (STM) and the basal area-based mean (BAM). Stem-based mean and BAM were calculated with the following equations:
where n is the number of individuals in a focal quadrat and WDi and BAi are wood density and basal area of the ith individual, respectively. We used genus mean values of wood density when species-level wood density was not available for the ith individual (n = 4013). Genus-level averages are known to relate well to species-level wood densities and can be used when values for species are unavailable (Chave et al. Reference CHAVE, MULLER-LANDAU, BAKER, EASEDALE, STEEGE and WEBB2006, Slik Reference SLIK2006); we also found that 71% of the total variance in wood density was attributable to genus-level variance in our wood samples, as mentioned below. Individuals were excluded from the analysis when both species- and genus-level values were unavailable because we were unable to obtain reliable wood-density data; these trees were 17.9% in number and 1.7% in basal area of all trees in the plot.
Relationships between STM or BAM and topography, growth rates and mortalities for the 20 × 20-m quadrats were analysed by RMA. Mean dbh, RGR and mortality were calculated for each quadrat using saplings (1 cm ≤ dbh ≤ 5 cm) of all species in a focal quadrat. Four topographic variables (i.e. relative elevation, slope inclination, slope aspect and index of convexity (IC)) were calculated for each quadrat using the method of Yamakura et al. Reference YAMAKURA, KANZAKI, ITOH, OHKUBO, OGINO, CHAI, LEE and ASHTON(1995). Elevation, inclination and aspect were obtained from a three-dimensional regressed plane of each quadrat, which was determined by the relative elevations at four corner points of a focal quadrat. Index of convexity was defined as the difference between the mean elevation of the four corner points and the elevation measured at the centre of the quadrat. Positive and negative IC values indicate convex and concave land surface features, respectively. Index of convexity is an index of land surface features at a very local scale, while elevation indicates larger-scale topography such as main ridges. Slope aspect was converted to bearing from the east (0°–180°) because wind direction was prevalently westerly at the study site (Noguchi et al. Reference NOGUCHI, ITOH, MIZUNO, SRI-NGERNYUANG, KANZAKI, TEEJUNTUK, SUNGPALEE, HARA, OHKUBO, SAHUNALU, DHANMMANONDA and YAMAKURA2007). Therefore, western and eastern slopes corresponded approximately to windward and leeward slopes, respectively. This was partially confirmed by field observation in that the majority of recent large tree falls were directed eastward (Sungpalee, pers. obs.). Relative dbh growth rate and mortality rate were log10-transformed before analysis. All the statistical analyses were performed with R 2.8.1 software (The R Development Core Team, http://www.r-project.org).
RESULTS
Intra- and interspecific variation in wood density
Of wood density total variance (n = 515), 80%, 71% and 42% were attributable to interspecific, intergeneric and interfamilial variation, respectively (Table 1). Thus, the intraspecific variance component is relatively small (20% of the total) compared with interspecific variation (80%). The small intraspecific variation was also detected by low within-species coefficients of variation (CV), which ranged from 2.6% to 23.4%, with a mean of 8.1% (Appendix 2).
Table 1. Proportions of wood density variance attributable to different taxonomic levels (n = 515 trees in Doi Inthanon National Park, Thailand). Variance proportions were derived from ANOVA. F-ratios and significance levels (*** P < 0.001) are given.
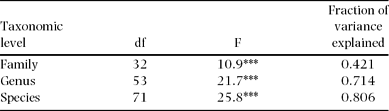
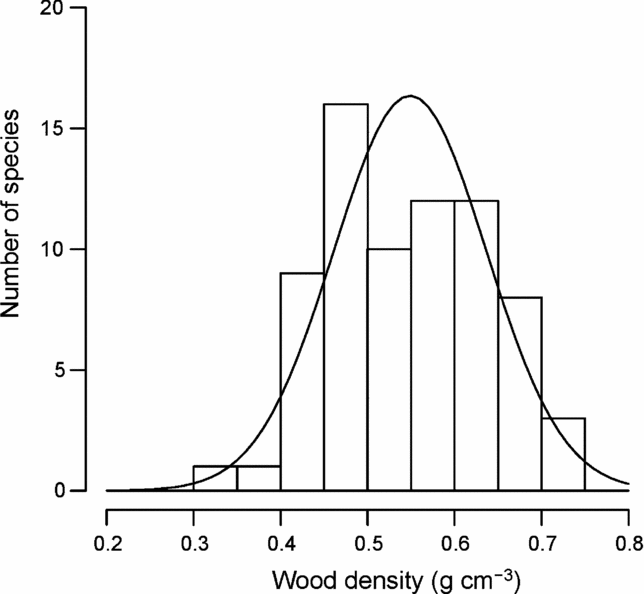
Figure 1 shows the distribution of mean wood density by species. Mean wood density across species was 0.549 ± 0.043 (SD) g cm−3, ranging from 0.333 g cm−3 (Macaranga denticulata, Euphorbiaceae) to 0.731 g cm−3 (Quercus brevicalyx, Fagaceae) (Appendix 2). The distribution was not significantly different from a normal distribution tested by the one-sample Kolmogorov–Smirnov test (P = 0.531) and the Shapiro–Wilk normality test (P = 0.325).

Figure 1. Frequency distribution of wood densities for 72 common tree species in Doi Inthanon National Park, northern Thailand. The solid line is the fitted normal probability distribution.
Species wood densities were significantly negatively correlated with maximum diameter, RGR of saplings and mortality of saplings. The slopes of RMA regression lines were −0.0032 (95% CI: −0.0040 to −0.0024), −0.630 (95% CI: −0.777 to −0.483) and −0.317 (95% CI: −0.392 to −0.242) for maximum diameter, RGR and mortality, respectively. Species with larger maximum diameters, rapid sapling growths and higher mortality rates tended to have lower wood density.
Spatial distribution of wood density
Stand-level wood densities based on stem number (STM) and basal areas (BAM) varied considerably within the plot. The mean STM was 0.555 ± 0.021 (SD) g cm−3 (range =0.47–0.60 g cm−3; CV = 3.8%) and BAM was 0.559 ±0.037 g cm−3 (range = 0.46–0.66 g cm−3; CV = 6.5%). Based on the ranges, the within-plot differences increased 1.3- and 1.4-fold for STM and BAM, respectively.
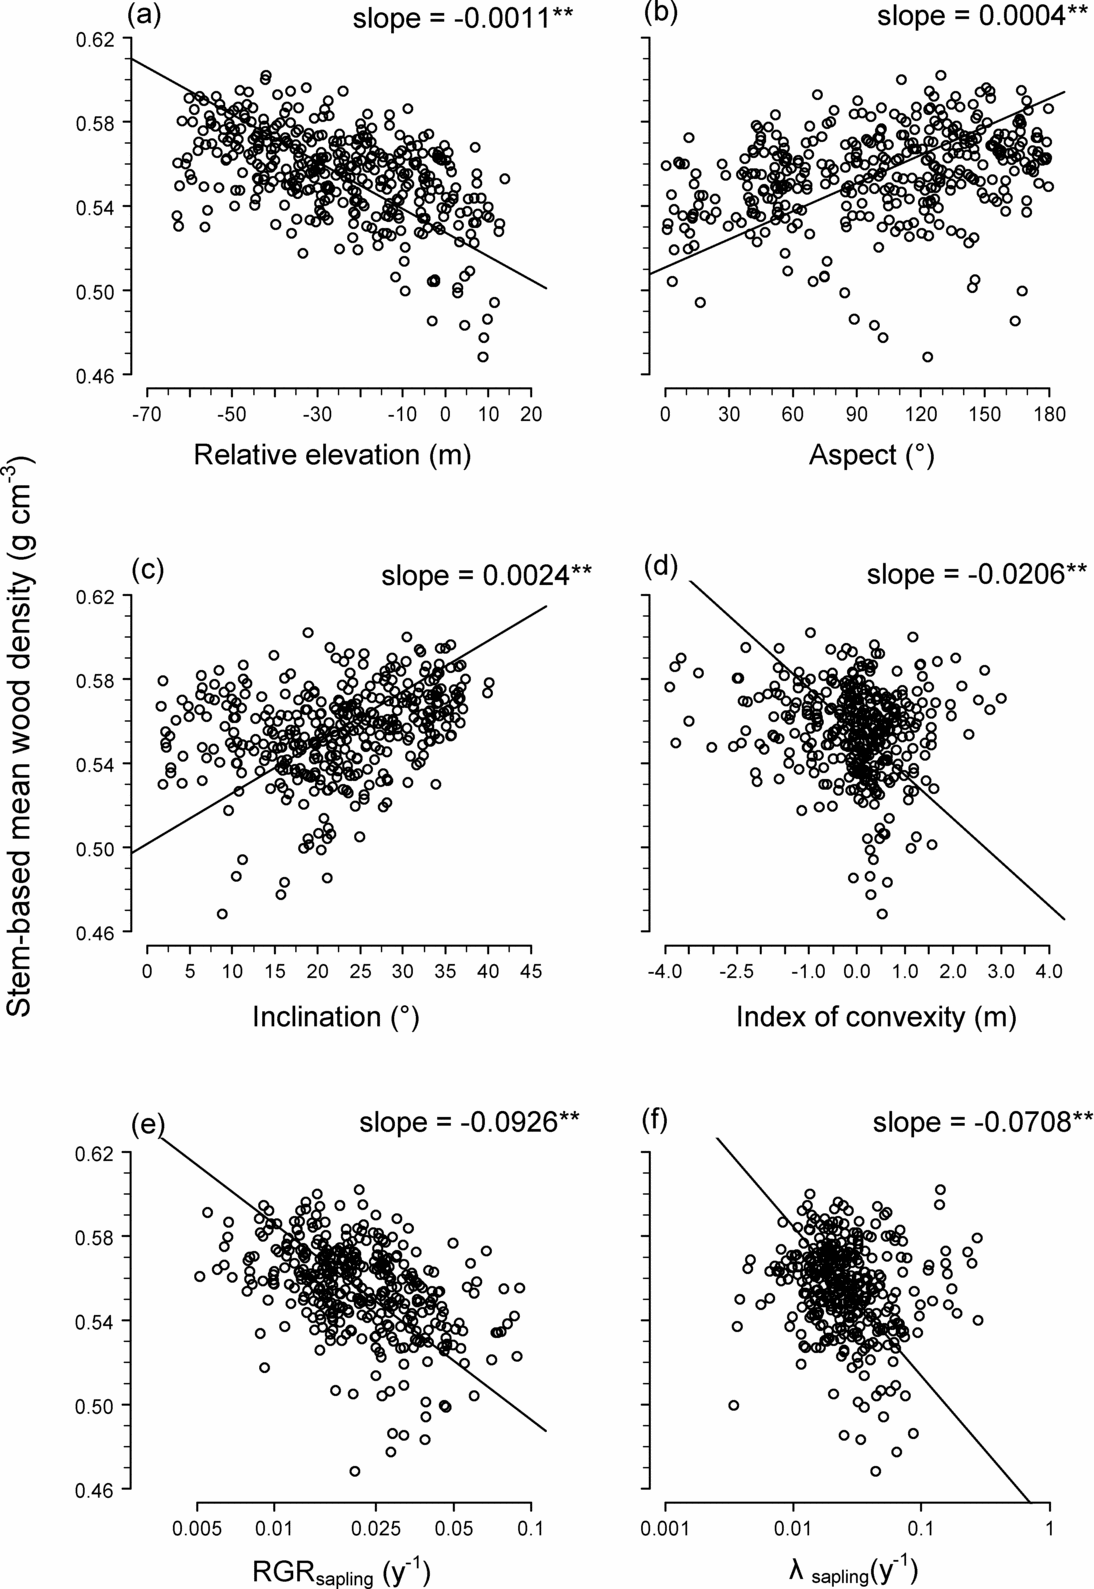
The spatial distributions of STM and BAM are illustrated in Figure 2, which also shows the distribution of stand-level mean RGR of saplings (Figure 2c) and the mortality rate of saplings (Figure 2d). Stem-based mean was significantly negatively correlated with elevation, convexity, RGR and mortality, and positively correlated with inclination and aspect (Figure 3). Basal area-based mean was similarly related to topography and demographic traits, except that BAM was related positively to convexity (STM was related negatively to convexity) (Table 2).
Table 2. Slopes of reduced major axis regressions between basal area-based mean wood density (BAM) and demographic traits of saplings (1 ≤ dbh ≤ 5 cm) and topography within 20 × 20-m quadrats in a 15-ha plot at Doi Inthanon National Park, northern Thailand. RGR: relative growth rate of diameter; λ: annual mortality. Topographic variables were calculated from a regressed plane for each square; positive and negative values of the index of convexity indicate convexity and concavity, respectively, of land surface at a very local scale. Ninety-five per cent confidence intervals are also given.
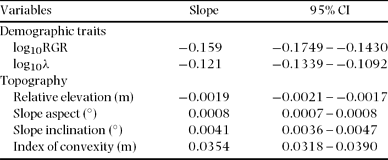

Figure 2. Spatial distribution of stem-based mean wood density (STM) (a), basal area-based mean wood density (BAM) (b), mean relative growth rate (RGR) of saplings (1 ≤ dbh ≤ 5 cm) (c) and mean mortality rate of saplings (d) in a 15-ha plot in Doi Inthanon National Park, northern Thailand. Values were calculated for 20 × 20-m quadrats and divided into four quintile classes. Darker shading indicates higher values. Topographic contours of 10-m intervals are also shown.
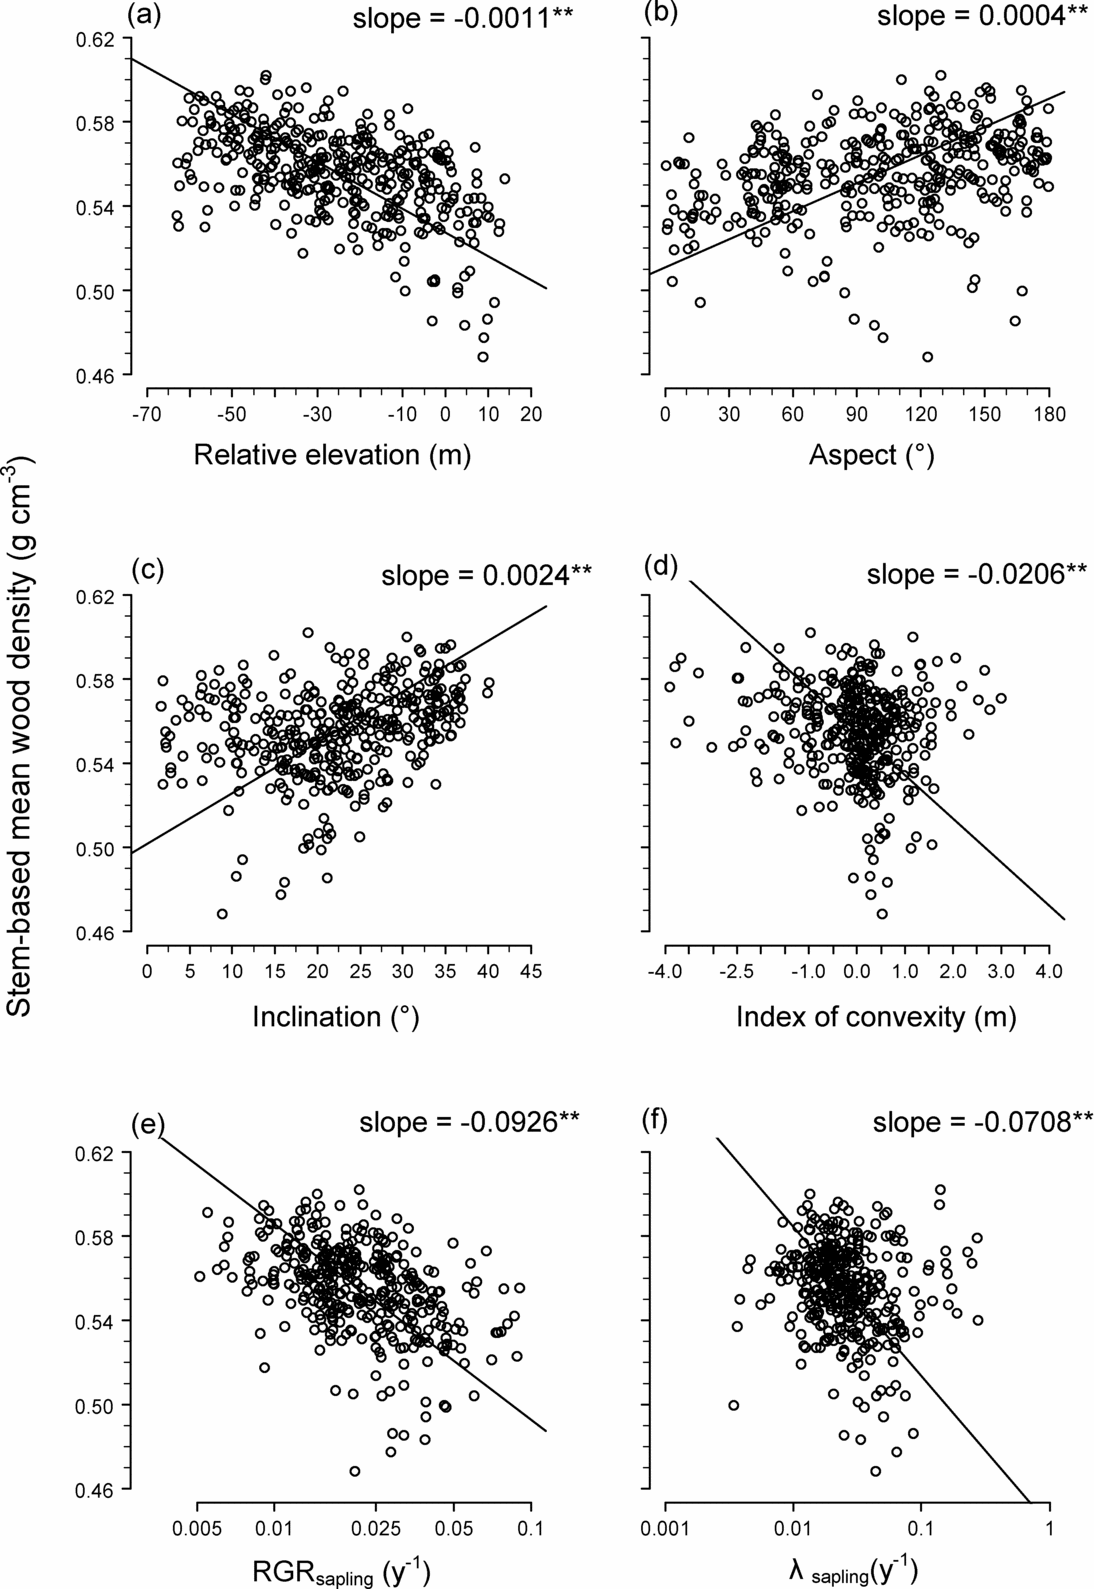
Figure 3. Relationship between stem-based mean wood density (STM) and topography and demographic traits in 20 × 20-m quadrats within a 15-ha plot (n = 372): relative elevation (a), slope aspect (b), slope inclination (c), index of convexity (d), relative growth rate (RGR) of saplings (1 cm ≤ dbh ≤ 5 cm) (e) and mortality rate (λ) of saplings (f). Solid lines are regression lines generated via a reduced major axis regression. Slopes of the regression lines are also shown; ** indicates slope is significantly negative or positive at P < 0.01.
DISCUSSION
Intraspecific variation in wood density
Intraspecific variation was smaller (20% of the total wood density variation in sample trees) than interspecific variation, even though we collected wood samples from variously sized trees growing under diverse topographic conditions. For comparison, we calculated the CVs of intraspecific variation in wood density for trees in a Brunei lowland tropical rain forest (data from Table 1 in Osunkoya et al. Reference OSUNKOYA, SHENG, MAHUD and DAMIT2007). They measured the wood density of 209 trees in 27 species (4–22 trees per species; mean = 7.7 trees per species) in a 1-ha plot. The mean CV of the 27 species was 13.4% (range: 6.4–25.0%), which was slightly larger than that of this study (mean = 8.1%; range: 2.6–23.4%). The small intraspecific variation in the current study indicates that species-specific differences (not intraspecific variation and phenotypic plasticity) are a major determinant of the relationships between wood density and species traits, and between stand-level mean wood density and topography, at least in our study forest.
Interspecific variation and relationships to other traits
Mean wood density (0.55 g cm−3) across the 72 species studied was comparable to, or slightly lower than, within-site species means of wood densities reported for Asian lowland tropical rain forests, e.g. 0.56 g cm−3 in West Kalimantan (Suzuki Reference SUZUKI1999) and 0.59 g cm−3 in Brunei (Osunkoya et al. Reference OSUNKOYA, SHENG, MAHUD and DAMIT2007); in the Neotropics, the mean wood density was 0.54 g cm−3 in Panama, 0.56 g cm−3 in Costa Rica, 0.56 g cm−3 in Peru and 0.70 g cm−3 in Brazil (Muller-Landau Reference MULLER-LANDAU2004). The range of wood density found in this study (0.398 g cm−3) is smaller than the within-site ranges reported for these other rain forests (0.40–0.66 g cm−3).
The significant negative relationships between wood density and species mortalities or growth rates are generally consistent with previous studies in lowland rain forests, such as those in Panama (Muller-Landau Reference MULLER-LANDAU2004), the Amazon (Chao et al. Reference CHAO, PHILLIPS, GLOOR, MONTEAGUDO, TORRES-LEZAMA and MARTINEZ2008), Peninsular Malaysia (King et al. Reference KING, DAVIES, NUR SUPARDI and TAN2005), West Kalimantan (Suzuki Reference SUZUKI1999) and Brunei (Osunkoya et al. Reference OSUNKOYA, SHENG, MAHUD and DAMIT2007). These relationships are often considered a reflection of trade-offs between growth and mortality via traits such as mechanical strength, shade-, pathogen- and drought-tolerance (Wright et al. Reference WRIGHT, ACKERLY, BONGERS, HARMS, IBARRA-MANRIQUEZ, MARTINEZ-RAMOS, MAZER, MULLER-LANDAU, PAZ, PITMAN, POORTER, SILMAN, VRIESENDORP, WEBB, WESTOBY and WRIGHT2007).
Large-statured species with light wood
We found a significant negative correlation between wood density and maximum diameter of the species studied. This was at least partially due to unique features of the tree flora and structure in the study forest, which contained a group of huge canopy species with relatively low wood density, such as Mastixia euonymoides (wood density = 0.49 g cm−3; maximum dbh = 176 cm) and Manglietia garrettii (wood density = 0.44 g cm−3, maximum dbh = 157 cm) (Kanzaki et al. Reference KANZAKI, HARA, YAMAKURA, OHKOBO, TAMURA, SRI-NGERNYUANG, TEEJUNTUK, BUNYAVEJCHEWIN, Losos and Leigh2004). Mastixia euonymoides and M. garrettii were the first and second largest species, respectively, in the study plot (in terms of maximum dbh). Mastixia euonymoides and M. garrettii were ranked first and fourth, respectively, in terms of basal area dominance. Chave et al. Reference CHAVE, CONDIT, AGUILAR, HERNANDEZ, LAO and PEREZ(2004) also reported that wood density was lower in large trees in a Panamanian forest, probably due to the high dominance of large species with light wood, such as Ceiba pentandra (Bombacaceae; wood density = 0.31 g cm−3). The reason why species with light wood are dominant in the upper canopy of these forests has yet to be resolved.
Spatial variation in stand-level wood density
The range of stand-level mean wood densities within the 15-ha plot (0.47–0.60 g cm−3 and 0.46–0.66 g cm−3 for STM and BAM, respectively) was smaller than that among species (0.333–0.731 g cm−3). This is, however, not surprising since stand-level averages across individuals naturally constrain the range. To evaluate the degree of stand-level variation, we need to compare these values with those of other studies.
To date, we have found only one study with which we were able to compare our data on spatial variation in stand-level wood density. Kraft et al. Reference KRAFT, VALENCIA and ACKERLY(2008) calculated STMs of 20 × 20-m quadrats within a 25-ha plot in an Ecuadorian Amazonian lowland rain forest; although they did not measure wood density of the trees in the plot, they used species wood densities obtained from the literature. The range of species wood densities was larger in the Amazonian forest (c. 0.1–1.0 g cm−3 for 256 species) than in the plot we studied in Thailand (0.33–0.73 g cm−3 for 72 species), but the STM ranges were very similar for both forests: 0.47–0.60 g cm−3 and c. 0.52–0.64 g cm−3 for the Thai and the Amazonian forests, respectively. The combination of relatively large STM range and small species-level range in the forest we studied was not expected; a possible explanation is that spatial aggregation among species with similar wood densities may be stronger at our site than in the Amazonian forest.
Relationship between wood density and topography
Stand-level wood density was lower at higher elevations and on eastern slopes than at other locations within the study plot (Figures 2, 3; Table 2). This is the reverse of the density/topographic relationships within a Costa Rican montane forest and within an Ecuadorian lowland rain forest. Stand-level wood density was higher on ridges in these New World forests (Kraft et al. Reference KRAFT, VALENCIA and ACKERLY2008, Lawton Reference LAWTON1984).
A possible explanation for the discrepancy between the present study and earlier works may be found in differing wind disturbance effects. At our site, the ridges may be impacted more strongly and more frequently by gale- or storm-force winds than the lower slopes. The severe disturbance may lead to a more rapid turnover of trees, creating conditions that favour fast-growing species, which typically have low wood density. In the forests studied by Lawton (Reference LAWTON1984), disturbance by wind may be less severe because canopy trees on the ridges were much shorter (5–10 m) than those in our plot (> 30 m), and these short individuals were probably more tolerant of strong wind forces. Wind effects are likely to be minimal even on ridges in the Ecuadorian lowland forest, where wind is generally weak.
This explanation is consistent with our finding that on the ridges and eastern slopes we studied, mortality and growth rates of saplings were elevated (Figure 2c, d), while STM and BAM were negatively related to sapling mortality and RGR (Figure 3e, f). Saplings on the eastern slopes may suffer higher mortality because trees blown down on the ridges would fall mostly in an easterly direction (the prevailing strong winds are westerly). In April 2007, we also observed many recently fallen trees in our plot pointing eastward (Sungpalee, pers. obs.). If the intensity and frequency of disturbance relate to the spatial distribution of stand-level wood density, we would expect lower turnover rates with lower mortality and growth rates on the ridges in the Costa Rican and Ecuadorian forests, but this was not studied by either Lawton (Reference LAWTON1984) or Kraft et al. Reference KRAFT, VALENCIA and ACKERLY(2008).
Alternatively, differences in micro-environments may be related to topography independent of disturbance but may still affect the spatial distribution of stand-level wood density. When soils are less fertile in valleys, the conditions may favour persistent shade-tolerant species, which have relatively high-density woods (Muller-Landau Reference MULLER-LANDAU2004). Trees on ridges may get more light than those in valleys, even without canopy gaps, and thus rapid growth would be advantageous on the ridges. Further studies, especially on spatial patterns of soils and light conditions in the plot and their effects on population dynamics, are needed to identify the causal processes producing the observed relationship between wood density and topography.
ACKNOWLEDGEMENTS
We gratefully acknowledge Mr K. Suntrakorn (Forest Industry Organisation) and his staff for field assistance. We also thank students of the agroforestry course in Mae Jo University for kindly helping with the fieldwork. We wish to thank the forest officers of Doi Inthanon National Park for their support. We are also grateful to Drs T. Santisuk, D. Sookchaloem, V. Anusarnsunthorn, J. F. Maxwell, W. Nanakorn and W. Eiadthong for assistance in species identification. We thank Dr S. Bunyavejchewin for his support in establishing the 15-ha plot. This study was partly supported by MEXT and JSPS, Japan (KAKENHI #11691194, #15255005).
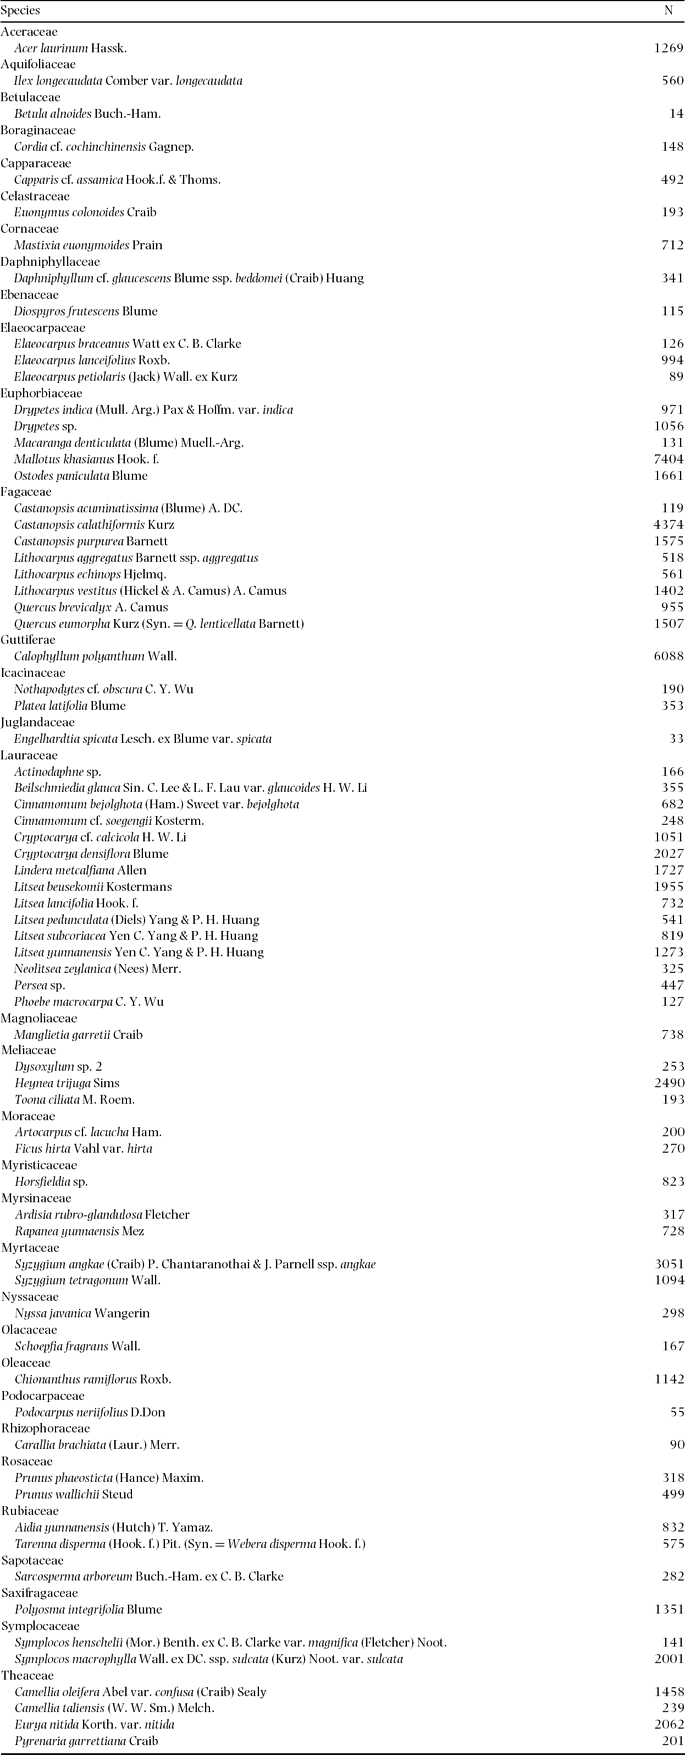
Appendix 1. List of 72 common tree species studied in a 15-ha plot of a tropical lower montane forest in Doi Inthanon National Park, northern Thailand. N: number of trees (dbh ≥ 1 cm) in the plot.

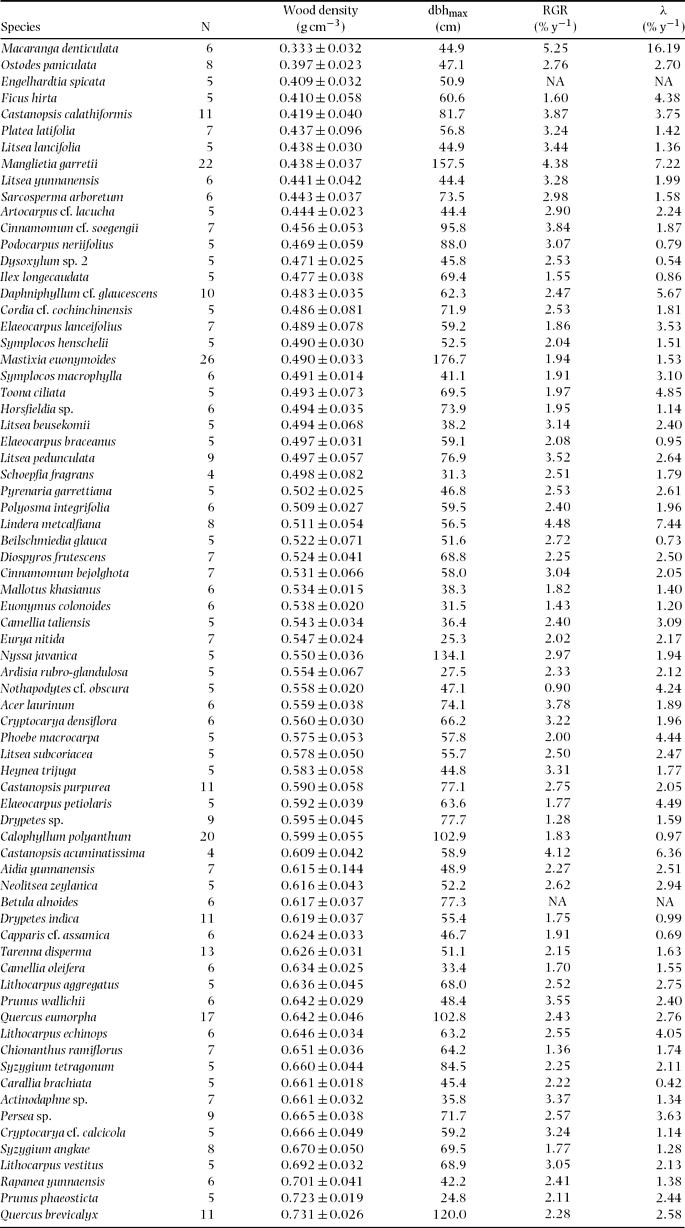
Appendix 2. Wood density (mean ± SD) and ecological traits of 72 species studied in a 15-ha plot within Doi Inthanon National Park, northern Thailand. N: number of wood core samples; dbhmax: maximum diameter in the plot; RGR: mean relative growth rate of saplings (1 cm ≤ dbh ≤ 5 cm); λ: exponential mortality coefficients of saplings; NA: data not available due to small sample size (n < 30). Species are sorted by wood density in increasing order.