


Although the original “home” for the concepts of gender identity and personality attributes was psychology, more recent research has indicated their relevance to broader health research. Gender identity is the extent to which individuals perceive themselves as masculine and/or feminine given what each of these social constructs means in a given context and regardless of the individual’s biological sex (Burke, Stets, & Piroggood, Reference Burke, Stets and Piroggood1988; Spence, Reference Spence1985; Stets & Burke, Reference Stets and Burke2000). Gender roles are socially and culturally assigned personality attributes and behaviours expected of women and men (Lindsey, Reference Lindsey2005). Both gender identity and roles are not fixed and may change with changes in time and place (Perry & Bussey, Reference Perry and Bussey1979; Spence, Reference Spence1984). Gender role orientation (GRO) or gender stereotypes are determined and constrained by social systems through widely accepted judgment or bias regarding expected masculine and feminine behaviours; however, not all men and women conform to these stereotypes (Annandale & Hunt, Reference Annandale and Hunt1990). Individually held stereotypes are reflected in gender role beliefs regarding the appropriate role of men and women in society (Bazik, Reference Bazik2011; Eagly & Mladinic, Reference Eagly and Mladinic1989).
Within any society, some personality characteristics, behaviours, interests, and roles are thought of as masculine whereas others are feminine (Williams & Best, Reference Williams and Best1982). Traditionally, masculinity has been characterized by a cognitive focus on “getting the job done” and is related to instrumental/agentic behaviours and attributes such as aggressiveness, assertiveness, competitiveness, and independence. The traditional traits that typify femininity are more affective and include concern for the welfare of others and communal-expressive behaviours and attributes such as submissiveness, dependence, deference, cooperation, caring, and nurturing (Bem, Reference Bem1974; Williams & Best, Reference Williams and Best1982). A cross-cultural comparison of 14 countries showed that in egalitarian, more economically and socially developed countries, behavioural differences between sexes and self-perceptions of men and women are less stereotypical in nature than in less affluent countries, but they do still exist (Williams & Best, Reference Williams and Best1990).
Historically, masculinity and femininity were conceptualized as opposite ends of a continuum and linked to biological sex (Gough, Reference Gough1952). The congruence between sex and sex roles was challenged by Constantinople (Reference Constantinople1973) who proposed a two-dimensional concept of gender in which masculinity and femininity are not two ends of a single scale, but are instead independent characteristics that could co-exist in an individual. Sandra Bem (Reference Bem1974) built on this, developing the Bem Sex Role Inventory (BSRI) to measure masculinity and femininity. This tool relies upon an individual’s endorsement of a series of adjectives which have been judged as culturally characteristic of either males or females in the United States, on a scale from 1 (“never or almost never true”) to 7 (“always or almost always true”). In its current form, the BSRI includes four categories based on answers to a 60-item Likert-type scale which comprises three 20-item scales about Masculinity (BSRI-M), Femininity (BSRI-F), and Social Desirability. Individuals who score high on masculinity and low on femininity are classified as “masculine”. Similarly, individuals are classified as “feminine” if they score high on femininity and low on masculinity. High scorers on both the masculinity and femininity scales are classified as “androgynous”, whereas those scoring low on both are classified as “undifferentiated”.
Bem has suggested and validated an abbreviated 30-item version of the original BSRI that consisted of three subscales with 10 items each. Items were omitted from the longer BSRI if they were redundant or showed low correlation with the corresponding scale. The masculine and feminine scales of the 30-item BSRI appear to be more internally consistent than those of the original BSRI (Bem, Reference Bem1981). Later on, the 30-item BSRI and many other abbreviated versions were developed to arrive at norms suited with different cultural settings and populations (Katsurada & Sugihara, Reference Katsurada and Sugihara1999; Mateo & Fernández, Reference Mateo and Fernández1991; Özkan & Lajunen, Reference Özkan and Lajunen2005). These abbreviated versions of the BSRI have been widely used among students, but their construct validity and research findings using abbreviated scales among older adults are limited. Moreover, issues have been raised concerning its cross-cultural relevance and validity (Ballardreisch & Elton, Reference Ballardreisch and Elton1992; Hoffman & Borders, Reference Hoffman and Borders2001; Holt, Reference Holt1998; Zhang, Norvilitis, & Jin, Reference Zhang, Norvilitis and Jin2001).
The measurement structure of the BSRI has been investigated using various methods of factor analysis. However, most of these studies were limited to exploratory factor analysis (EFA) among samples of university students. A meta-analysis of previous EFA studies indicated that, with regard to feminine items, a single factor was most frequently found, whereas with the masculine items there were two or three factors (Choi & Fuqua, Reference Choi and Fuqua2003). This suggests that the concept of masculinity may be more complex than that proposed by Bem. Interestingly, findings from studies among populations of older adults in Spain and Brazil supported the original BSRI two-factor structure of masculinity–femininity (Carver, Vafaei, Guerra, Freire, & Phillips, Reference Carver, Vafaei, Guerra, Freire and Phillips2013; Vafaei et al., Reference Vafaei, Alvarado, Tomás, Muro, Martinez and Zunzunegui2014), but in both studies no statistically significant association was observed between BSRI and biological sex.
Using EFA to determine the validity of latent constructs or concepts (factor validity) raises methodological issues (Bollen, Reference Bollen1989). Implementation of confirmatory factor analysis (CFA) in validity studies is important because such methods test models that are falsifiable (Brown, Reference Brown2006). The few existing CFA studies on the BSRI have yielded some contradictory results. For instance, among high school and university students from Australia, a two-factor model provided reasonable fit to the BSRI data (Marsh, Reference Marsh1985), whereas findings from two samples of young adults and another of middle-aged participants in Midwestern U.S. states suggested a three-factor model with one feminine factor and two complex masculine factors produced the best fit (Choi, Fuqua, & Newman, Reference Choi, Fuqua and Newman2009). Interestingly, results obtained with a sample of students from the United Kingdom also demonstrated a three-factor structure, with a bipolar factor reflecting interpersonal sensitivity/dominance, a masculine factor reflecting personal agency, and a third factor reflecting interpersonal expressiveness (Colley, Mulhern, Maltby, & Wood, Reference Colley, Mulhern, Maltby and Wood2009). Among populations over age 60, it is unclear whether a two-factor model adequately fits the BSRI data (Windle & Sinnot, Reference Windle and Sinnot1985). Secondary findings from both waves of the longitudinal Social Relations and Mental Health over the Life Course Study suggest that the two-factor solution proposed by Bem fits the data well, on the basis of a 40-item version used in the first wave and an abbreviated 22-item version in the second wave of the study (Sellars, Reference Sellars2008). In summary, an overview of previous research highlights ongoing ambiguities in measuring gender roles across cultures, among older populations and using shorter versions of the inventory.
In this study, we used a 12-item BSRI short form. This abbreviated version of BSRI was initially tested for validity in a sample of university students from Spain (Mateo & Fernández, Reference Mateo and Fernández1991) and has been re-examined in two separate pilot studies of Spanish and Brazilian older-adult populations by means of EFA and shown as a valid tool to measure gender role stereotypes (Carver et al., Reference Carver, Vafaei, Guerra, Freire and Phillips2013; Vafaei et al., Reference Vafaei, Alvarado, Tomás, Muro, Martinez and Zunzunegui2014).
Our aim was to examine the psychometric properties, as well as convergent and discriminant validity of the 12-item BSRI short form (6 items for measuring femininity and 6 for masculinity), in an international sample of older adults via both exploratory and confirmatory factor analysis.
Methods
Participants
The study subjects were part of wave 1 of the International Mobility in Aging Study (IMIAS) project. IMIAS is a prospective cohort study of 1,995 non-institutionalized men and women aged between ages 65 and 74 (as of 2012) from five sites: Natal, Brazil (n = 402), Manizales, Colombia (n = 400), Tirana, Albania (n = 394), Kingston (n = 398), and Saint-Hyacinthe (n = 401) respectively in Ontario and Quebec, Canada. Baseline data were collected in 2012 with follow-ups in 2014 and 2016. In Latin American and Albanian sites, participants were recruited randomly from their neighborhood primary care centers. In Canadian sites, letters were sent by family physicians to appropriate patients inviting them to contact the field coordinator for more information about the study. This was done to comply with the ethics guidelines at Queen’s University and the University of Montreal. Approximately 30 per cent of those invited to participate in Canadian sites contacted the field coordinator to get information about the study. Of those, 95 per cent enrolled.
In Latin American and Albanian sites, the response rates were almost 100 per cent. We expected that the response rate in Canadian sites would not be as high when compared to Latin American and Albanian sites, as suggested by existing literature (Galea & Tracy, Reference Galea and Tracy2007; Helliwell, Aylesworth, McDowell, Baumgarten, & Sykes, Reference Helliwell, Aylesworth, McDowell, Baumgarten and Sykes2001; Wong, Pelaez, Palloni, & Markides, Reference Wong, Pelaez, Palloni and Markides2006). In Saint-Hyacinthe, the sample of participants was representative of the community’s older adult population as documented in the 2006 Canadian Census in terms of marital status, education, and income. In Kingston, participants are more highly educated than the community norm but are representative in terms of income and marital status (again, according to Canadian census data for Kingstonians, ages 65 to 74). Data collection was carried out at all sites through structured face-to-face interviews at the participants’ homes unless they requested otherwise.
The IMIAS questionnaire comprised detailed structured interviews and included a wide range of measures of personal and social circumstances, self-report of existing medical conditions, health behaviours, quality of life, physical development and functioning, along with assessment of grip strength, vision, and blood pressure. Standardized training was offered to all interviewers at each site. All procedures, including data collection documents and manuals were available in local site languages. Potential participants were excluded if they had four or more errors in the Orientation Scale of the Leganes Cognitive Test (LGT) (De Yebenes et al., Reference De Yebenes, Otero, Zunzunegui, Rodriguez-Laso, Sanchez-Sanchez and Del Ser2003) which was administered on initial contact. Low LCT scores were considered indicative of an inability to meet the study requirements. Five people were excluded in Natal for this reason; exclusions numbered three people in Manizales and Tirana, and zero in Kingston and Saint-Hyacinthe.
Measures of Study
Since our questions on gender roles were only a part of a large project of mobility in aging, we privileged the use of a shorter version of the BSRI in older adults. For the purpose of this study, gender-stereotyped traits were measured using the 12-item BSRI short form initially used in the Spanish population (Mateo & Fernández, Reference Mateo and Fernández1991). The masculinity scale consists of six traits that are traditionally related to instrumental behaviours and attitudes that are characterized, and perhaps stereotyped, as masculine. These traits are as follows: acting as a leader, being dominant, having leadership abilities, having a strong personality, defending one’s own beliefs, and making decisions easily. The femininity scale consists of six traits that are traditionally related to expressive behaviours and attitudes that are characterized/stereotyped as feminine, specifically: being gentle, warm, sympathetic, tender, affectionate, and sensitive to others’ needs. Participants were asked to rate the extent to which these items describe themselves using a 7-point Likert scale. This part of the IMIAS questionnaire took approximately 10 minutes to complete. The short form of BSRI used in this study was translated into French, Portuguese, and Albanian languages by two bilingual researchers from each IMIAS site. All the translated versions were then back-translated into English by a native English speaker to ensure accuracy and conceptual equivalency of items (Brislin, Thorndike, & Lonner, Reference Brislin, Thorndike and Lonner1973) (Table 1). These measures were done to ensure that the BSRI questions had the same general meanings in all IMIAS sites.
Table 1: English items of the 12-item short form of BSRI used in this study along with French, Spanish, Portuguese, and Albanian translations

Statistical Analysis
Preliminary statistical analysis was performed using IBM SPSS software, version 21, and STATA software, version 11. Participants with missing values on any item were excluded from the current analysis (n = 45). The majority of those participants were from Manizales, Colombia (53.3%). They were not different from those included in the analysis in terms of age, sex, years of schooling, education level, occupation type, and income sufficiency. Table 2 shows the socio-demographic characteristics of participants included in the study.
Table 2: Distribution of study participants according to demographic and socioeconomic characteristics (n = 1,950)

* p values comparing men and women at each research site.
For the purpose of this article, we randomly split the combined IMIAS population samples into two data sets of approximately equal size: a “training sample” (n = 971) and a “holdout sample” (n = 979). EFA was conducted on the training sample. We performed principal component analysis (PCA), which is of an exploratory nature, to examine the link between the observed items and the latent constructs and to identify the factor structure (Tabachnick, Reference Tabachnick and Fidell2013). The inter-relationships between the BSRI inventory dimensions were assessed using Pearson correlation coefficients. Identification of the potential number of factors was informed by the Kaiser Guttman rule of eigenvalues > 1, Cattell’s scree plots, and parallel analysis (Cattell, Reference Cattell1966; Hayton, Allen, & Scarpello, Reference Hayton, Allen and Scarpello2004; Kaiser, Reference Kaiser1960). The internal consistency of BSRI dimensions was assessed using Cronbach’s alpha reliability coefficient. Alpha values higher than 0.7 are considered acceptable (Tavakol & Dennick, Reference Tavakol and Dennick2011). Known group validity, which is the ability of the short-form BSRI to distinguish participants of one group from another, was evaluated by comparing men and women using an independent t-test.
The resulting model from EFA was confirmed on the holdout sample using CFA. We then compared this model with the original two-factor structure proposed by Bem. CFA was what we used to assess measurement models with respect to goodness-of-fit indices as well as convergent and discriminant validity. Large and statistically significant factor loadings indicate that items associated with the same latent variables are highly inter-correlated, supporting convergent validity (Brown, Reference Brown2006; Kline, Reference Kline2011; O’Leary-Kelly & Vokurka, Reference O’Leary-Kelly and Vokurka1998). To assess discriminant validity, we used chi-square difference testing to compare two models, one in which latent variables are correlated and one in which they are not. Statistically significant differences in the chi-square test between the two models support discriminant validity (Segars, Reference Segars1997; Zait & Bertea, Reference Zait and Bertea2011). For these measurement models, we used structural equation modeling (SEM) via IBM SPSS AMOS 19 software to assess relationships between factors and their observed measures. First, we assessed the multivariate normality in the holdout data set to determine the appropriate CFA estimation method. Second, we employed the modification indices to measure the amount by which the overall model chi-square test would be reduced if a parameter that was previously fixed to zero was then estimated freely (Silvia & MacCallum, Reference Silvia and MacCallum1988). Finally, we tested the fit of the models in the holdout sample, and for men and women.
Assessing the Degree of Model Fit
We used the AMOS 19 software to assess the global fit of the models using fit statistics that possess different computational logic (Hoyle, Reference Hoyle, Tinsley and Brown2000). Six goodness-of-fit statistics were calculated which included chi-square, goodness-of-fit index (GFI), Bentler comparative fit index (CFI), root mean square error of approximation (RMSEA), Akaike’s information criteria (AIC), and the Browne-Cudeck criterion (BCC). It is generally accepted that a statistically non-significant chi-square test indicates a good model fit, while a statistically significant chi-square test suggests that the model has a poor fit to data. However, the chi-square test is sensitive to sample size, being almost always statistically significant in larger samples such as ours, which might erroneously suggest a poor fit (Schreiber, Nora, Stage, Barlow, & King, Reference Schreiber, Nora, Stage, Barlow and King2006).
Therefore, other goodness-of-fit indices are recommended in addition to the chi-square test. GFI values close to 1 are indicative of good fit (Schreiber et al., Reference Schreiber, Nora, Stage, Barlow and King2006). Values for CFI around 0.90 are considered acceptable, whereas values around 0.95 suggest a good model fit (Bentler & Bonett, Reference Bentler and Bonett1980; Hu & Bentler, Reference Hu and Bentler1999). RMSEA values below 0.05 indicate a good fit with values between 0.05 and 0.08 indicating a reasonable fit, those between 0.08 and 0.1 suggesting only a mediocre fit, and, finally, values greater than 0.10 indicating a poor model fit (Diamantopoulos & Siguaw, Reference Diamantopoulos and Siguaw2000; Hu & Bentler, Reference Hu and Bentler1999; Kahn, Reference Kahn2006; Steiger, Reference Steiger2007). We compared the model resulting from EFA and the two-factor structure model of Bem. The AIC and the BCC were used as measures of the final model’s likelihood of being replicated in other samples of a similar size and population (Byrne, Reference Byrne2001; Hu & Bentler, Reference Hu and Bentler1999). The model with the lowest values of both AIC and BCC is more likely to yield a good fit in other samples.
Results
Principal Component Analysis
As preliminary steps for the PCA, we carried out the Kaiser Meyer-Olkin (KMO) test of sampling adequacy and Bartlett’s test of sphericity on the training sample. The KMO index (0.745) is greater than 0.60–0.70 which means the data set is adequate for analysing EFA results (Netemeyer, O’Bearden, & Sharma, Reference Netemeyer, O’Bearden and Sharma2003). Bartlett’s test rejects the hypothesis that the correlation matrix is an identity matrix, without significant correlations between variables (at p < 0.000) (Tabachnick & Fidell, Reference Tabachnick and Fidell2001). Both tests confirm that the training sample is suitable for factor analysis.
Based on the guidance of the Kaiser-Guttman rule, scree plot, and parallel analysis test (Figure 1), we determined that a three-factor structure was most appropriate.

Figure 1: Difference in eigenvalues from parallel analysis
Oblique rotations using the Promax method (Kappa = 4) were generated to assist in factor structure interpretation because we found that factors 1 and 3, and factors 2 and 3, were slightly correlated (see Table 3) (Hendrickson & White, Reference Hendrickson and White1964).
Table 3: Correlation matrix of the three factor structure of the 12-item short-form BSRI in training sample (n = 971)
The factor label components are as follows: F1, femininity (expressiveness) factor; F2, masculinity (instrumental) factor, F3 mixed factor
* p < 0.05.
Inspection of the pattern matrix revealed a three-factor structure. All of the 12 items had factor loadings greater than 0.45 following the criteria of Comrey and Lee (Reference Comrey and Lee1992), communalities were greater than or equal to 0.43, and no items failed to show salient loadings on any of the factors. The three factors accounted for 56.8 per cent of variance in scores. Factor 1 (femininity or expressiveness factor) accounted for 25.94 per cent of the variance (eigenvalue = 3.11). Factor 2 (masculinity or instrumentality factor) accounted for 20.60 per cent of the variance (eigenvalue = 2.47). Factor 3 (mixed factor) accounted for 10.26 per cent of the variance (eigenvalue = 1.23). The expressiveness factor had five items, the instrumentality factor had four items, and the mixed factor had three items. Factor loadings, communalities, and mean score and standard deviation of each item are shown in Table 4.
Table 4: Principal component analysis of the 12-item short-form BSRI with communalities (h 2) of each item in training sample (n = 971)

The factor label components are as follows: F1, femininity (expressiveness) factor; F2, masculinity (instrumental) factor; F3, mixed factor
The factor pattern coefficients of 0.45 and below were replaced by zeros.
Items were scored (Never/almost never true = 1, almost/always true = 7).
Confirmatory Factor Analysis
A CFA framework was applied to the whole holdout sample, also to the aggregate holdout sample of men and women. The holdout sample showed multivariate non-normal distribution with a value of more than five for Mardia’s coefficient. We used the asymptomatic distribution-free (ADF) estimation which is a trustworthy estimation method recommended for CFAs under non-normal conditions, provided that the sample size is adequate (Raykov & Marcoulides, Reference Raykov and Marcoulides2006). Before doing CFA, we calculated internal consistency for the three factors. Cronbach’s alphas were 0.77, 0.78, and 0.47 for expressiveness, instrumentality, and the mixed factor respectively. The first two factors showed acceptable reliability whereas for the third factor reliability was poor (Tavakol & Dennick, Reference Tavakol and Dennick2011). We also calculated the reliability coefficients for the two factors structure as proposed by Bem, and found alphas values of 0.76 for the expressiveness factor and 0.75 for the instrumentality factor. These values indicate acceptable alphas for the two-factor model.
Next, the three-factor model consistent with factor structure from the EFA (model 1), along with the two-factor model (model 2) proposed by Bem, were considered using CFA to assess how well data fit both models. One common assumption in these models is that a parameter is fixed at zero (e.g., in a two-factor model, items related to one factor are free to load on it while restricted to have zero loadings on the other factor). Modification indices were employed to assess how reasonable these assumptions were when they were relaxed (Silvia & MacCallum, Reference Silvia and MacCallum1988). The results indicated that a two-factor structure (model 2) had a satisfactory fit, and it clearly demonstrated better fit than a three-factor solution (model 1). Specifically, the fit indices for model 2 in the whole holdout sample are as follows: χ2 = 125.34, GFI = 0.96, CFI = 0.93, and RMSEA = 0.046. The same goodness-of-fit indices for model 1 are as follows, in sequence: 218.99, 0.93, 0.86, 0.06.
We obtained similar results when fitting models for men and women separately (see Table 5). Model 2 showed that all un-standardized factor loadings were statistically significant at p < 0.001, rejecting the null hypothesis that the unconstrained loadings are zero. All standardized factor loadings showed moderate to high values, indicating that each item is at least moderately related to its corresponding latent variable (Figure 2). Only item 10 (“defends own beliefs”) showed low standardized factor loading (0.22). We assessed a model without this item, but the goodness-of-fit indices were worse compared to the 12-item, two factor model. Therefore, we consider model 2 with acceptable convergent validity. Using the entire IMIAS data set, we compared CFA results of model 2 in which the two latent variables correlate, with the same model in which they did not correlate. The chi-square difference test (χ2 – χ2 = 32.82; df 1 – df 2 = 1) was statistically significant (p < 0.001), indicating discriminant validity.
Table 5: Goodness-of-fit indices for the three-factor and the two-factor models of the 12-item short-form BSRI in the holdout sample of the IMIAS population

AIC = Akaike’s information criteria
BCC = Browne-Cudeck criterion
CFI = comparative fit index
GFI = goodness-of-fit index
IMIAS = International Mobility in Aging Study
RMSEA = root mean square error of approximation
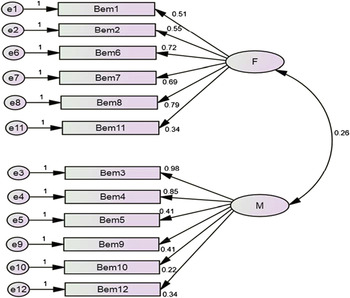
Figure 2: Hypothesised two-factor model (model 2) of factorial structure of Bem Sex Role Inventory (n = 979). Bem 1 = Gentle; Bem 2 = Sympathetic; Bem 3 = Has leadership abilities; Bem 4 = Act as a leader; Bem 5 = Dominant; Bem 6 = Tender; Bem 7 = Warm; Bem 8 = Affectionate; Bem 9 = Strong personality; Bem 10 = Defends own belief; Bem 11 = Sensitive to others’ needs; Bem 12 = Make decisions easily. Standardized factor loadings appear on the lines. All loadings are statistically significant at p < 0.00
Known Group Validity
Known group validity was used to determine the extent to which the two-factor structure of the 12-item BSRI revealed known differences in gender role stereotypes between men and women. In the whole sample, we found statistically significant differences between men and women on both dimensions using independent samples t-tests. In general, higher mean values were found for expressiveness among women and instrumentality for men in the aggregate sample and when data were disaggregated by site (see Table 6). Mean masculinity scores were higher in men compared to women in Tirana, St-Hyacinthe, and Kingston (p < 0.05), while mean femininity scores were higher in women than men in Manizales, Tirana, and Kingston (p < 0.05).
Table 6: Comparison between men (n = 462) and women (n = 517) responses on two-factor model of the 12-item short form of the Bem Sex Role Inventory in the confirmatory holdout sample of the IMIAS population

* p < 0.05
IMIAS = International Mobility in Aging Study
Discussion
According to previous literature, the original and the abbreviated versions of the BSRI have both been used primarily among younger populations, and knowledge about validity in older-adult populations is limited. We decided to use the Bem Sex Role Inventory as a measure of gender-stereotyped traits because of recent evidence on the salience of these traditional gender roles in Latin America and Southern Europe (Chant & Craske, Reference Chant and Craske2003; Miluka, Reference Miluka2009; Särnhult, Reference Särnhult2014; Silova & Magno, Reference Silova and Magno2004; Stecklov, Carletto, Azzarri, & Davis, Reference Stecklov, Carletto, Azzarri and Davis2010). In addition, research findings obtained from a sample of older adults from Canada refer to these same gender roles as personality attributes having significant effects on general wellness and life satisfaction in older women (Gale-Ross, Baird, & Towson, Reference Gale-Ross, Baird and Towson2009). We hypothesized that gender roles may be more applicable to older generations than to younger populations who have more opportunity to choose or to explore more flexible gender roles, and this hypothesis needs to be investigated. The purpose of this analysis was to evaluate the psychometric properties and construct validity of the 12-item short-form BSRI in older adults and in developing as well as developed countries.
We conducted an exploratory and then a confirmatory factor analysis of the 12-item BSRI. The exploratory factor analysis revealed a three-factor model. This model was further confirmed by CFA and compared with the two-factor model initially proposed by Bem. The CFA revealed that the two-factor solution showed satisfactory construct validity and superior fit compared with the three-factor solution, according to the standard recommendations of SEM literature (Diamantopoulos & Siguaw, Reference Diamantopoulos and Siguaw2000; Hu & Bentler, Reference Hu and Bentler1999; Kahn, Reference Kahn2006; Steiger, Reference Steiger2007). In addition, the two-factor model showed the lowest values of both AIC and BCC, indicating that it is more likely to reproduce findings in other samples of similar populations. Discrepancy between results from exploratory and confirmative factor analysis is not surprising because EFA is data driven and involves a number of subjective decisions (Brown, Reference Brown2006). In terms of reliability, the CFA two-factor solution showed higher than the recommended cut-off point of 0.70 (Bland & Altman, Reference Bland and Altman1997; Tavakol & Dennick, Reference Tavakol and Dennick2011), indicating acceptable internal consistency for the whole IMIAS sample (α = 0.75 and α = 0.76 for instrumentality and expressiveness items respectively) and for men and women separately (α ranged between 0.73 and 0.78 ). A significant gender difference was found in the two factors. Men tended to have significantly higher instrumentality and lower expressiveness scores than women. These findings confirmed expected differences in gender stereotype compositions assumed by men and women.
There are several justifications for the existence of two factors as proposed by Bem, even where more than two factors exist. Gender role orientations may vary across cultural settings or due to changes in self-concepts of gender roles over time and in response to economic, social, and political transitions. For instance, research findings from studies in the United States and Latin America suggest that stereotypes of women and women’s self-perceptions have become more instrumental in line with their increasing emancipation and participation in public life (Diekman & Eagly, Reference Diekman and Eagly2000; Diekman, Eagly, Mladinic, & Ferreira, Reference Diekman, Eagly, Mladinic and Ferreira2005). Again, the BSRI was developed to assess the extent to which traditional cultural norms of desirable female and male attributes reflect individual self-perceptions (Bem, Reference Bem1979). It could be argued that the North American norms of the 1970s, upon which the BSRI was constructed, may define concepts of masculinity and femininity that are no longer applicable in North America and whose applicability elsewhere was never established. However, in this work we provided evidence for all four gender roles in both Canadian cities and also in very different international contexts supporting the ubiquitous existence of these four types. Other researchers suggest that the factor structure of BSRI may be more complex than Bem’s proposal of masculine or feminine items split into two factors (Feather, Reference Feather1978; Maznah & Choo, Reference Maznah and Choo1986; Ratliff & Conley, Reference Ratliff and Conley1981). This means that it may be inappropriate to define masculinity and femininity based on single factors when more than one factor might be embedded in each concept. Despite these concerns, our findings support Bem’s two-factor model and are consistent with most of the recent literature on BSRI validation using CFA in a sample where older adults were over-represented (Sellars, Reference Sellars2008).
One of the major strengths of this study is a large sample size (n = 1,950). Furthermore, we applied EFA to a sample of 971 participants; a high ratio of participants to BSRI items (ratio 81:1) ensured that stable factors could be identified using EFA (Gorsuch, Reference Gorsuch1983). CFA was conducted with a separate, large sample (n = 979). Our findings therefore provide strong support for the 12-item short form BSRI as a valid measure of gender roles as reflected by individual sex roles among older adults.
The results of this study strongly support the psychometric properties and construct validity of the 12-item short-form BSRI among an international sample of older adults. However, limitations of the study must be acknowledged. First, in less-educated participants, BSRI may contribute to measurement errors and information bias. We attempted to minimize these errors by administering the BSRI at all sites using responsive visual aids. Second, the Kingston sample was overeducated compared with the 2006 Kingston population census data for this 65–74-year-old age group. Consequently, participants included in the study from Kingston may not be representative of their community, and generalization of results from this specific site may be of limited validity. However, the diverse samples provide a wide distribution range of social variables for analysis, reinforcing the validity of the instrument. Finally, the instrument is a self-reported measure that allows participants to rate themselves in some aspects of common cultural values. We cannot exclude possible social desirability bias because we cannot determine the extent to which responses accurately reflect participants’ actual characteristics, behaviours, and experiences.
Conclusions
The 12-item short form BSRI appears to be a brief, robust, reliable, and psychometrically sound instrument that can be readily implemented in studies to assess gender roles. It offers a method for studying whether gender norms, expectations, and constraints have an impact on outcomes such as mental and physical health. Further use of the current 12-item BSRI is justified and will provide additional evidence to refine and compare its psychometric properties and construct validity among older-adult populations.
Supplementary Material
To view supplementary material for this article, please visit http://dx.doi.org/S0714980816000404


