


Introduction
Ninety-five (65%) taxa of the ~147 species of marine microalgae associated with harmful algal blooms (HABs) are dinoflagellates, and they represent ~49% of the nearly 80 species identified as toxin producers (Peña et al., Reference Peña-Manjarrez, Flores-Trujillo, Helenes-Escamilla, García-Mendoza, Quijano-Scheggia, Olivos-Ortiz and Nunez-Vazquez2016). Among the different toxins produced by dinoflagellates, paralytic shellfish toxins (PSTs) are of great concern, since these metabolites can cause mass mortalities of marine organisms and are transferred through the food chain to humans, representing a risk to public health.
PSTs are a group of at least 50 water-soluble neurotoxic alkaloid analogues to saxitoxin that are responsible for Paralytic Shellfish Poisoning (PSP) in humans (Wiese et al., Reference Wiese, D'agostino, Mihali, Moffitt and Neilan2010). In the marine environment, PSTs are produced by Gymnodinium catenatum, Pyrodinium bahamense and different species of the genus Alexandrium (Band-Schmidt et al., Reference Band-Schmidt, Bustillos-Guzmán, Gárate-Lizárraga, Lechuga-Devéze, Reinhardt and Luckas2005; Penna et al., Reference Penna, Perini, Dell'Aversano, Capellacci, Tartaglione, Giacobbe and Scardi2015). Human fatalities have been associated with PSTs produced by G. catenatum (37 intoxicated and three deaths) and P. bahamense (476 intoxicated and 18 deaths) in Mexican Pacific coasts (Band-Schmidt et al., Reference Band-Schmidt, Duran-Riveroll, Bustillos-Guzman, Leyva-Valencia, Lopez-Cortes, Nuñez-Vazquez, Hernández-Sandoval and Ramirez-Rodriguez2019). Gymnodinium catenatum was described as a new species by Graham (Reference Graham1943) from samples collected during a cruise held in the Gulf of California (GC) in 1939. This species became notorious after an important PSP outbreak that occurred in 1979 in the coast of Sinaloa, Mexico when 18 people were intoxicated and three died after consuming bivalves contaminated with PSTs (Mee et al., Reference Mee, Espinosa and Diaz1986). After this event, several G. catenatum proliferations have been recorded throughout the Pacific Mexican coast and in the GC but a negative impact has been documented in only a few of them (López-Cortés et al., Reference López-Cortés, Hernández-Sandoval, Band-Schmidt, Bustillos-Guzmán, Núñez-Vázquez, García-Mendoza, Quijano-Scheggia, Olivos-Ortiz and Nuñez-Vazquez2016; Medina-Elizalde et al., Reference Medina-Elizalde, García-Mendoza, Turner, Sánchez-Bravo and Murillo Martínez2018; Band-Schmidt et al., Reference Band-Schmidt, Duran-Riveroll, Bustillos-Guzman, Leyva-Valencia, Lopez-Cortes, Nuñez-Vazquez, Hernández-Sandoval and Ramirez-Rodriguez2019).
Gymnodinium catenatum HABs are a recurrent problem in the northern part of the GC (nGC). The presence of PSTs in this region affects fisheries, wildlife and has impacted public health. In 2010, the first sanitary ban was implemented in the nGC when PSTs concentrations in geoduck clams (Panopea globosa) were higher than the regulatory limit of 800 μg STX eq kg−1 (COFEPRIS, 2015). In the following years, no bans were implemented but in January 2015, PSTs concentrations in P. globosa reached up to 16,740 μg STX eq kg−1 and the extraction of these organisms was prohibited for ~8 months (Medina-Elizalde et al., Reference Medina-Elizalde, García-Mendoza, Turner, Sánchez-Bravo and Murillo Martínez2018). Accumulation of PSTs in P. globosa was associated with a G. catenatum HAB that also caused mass mortalities of marine mammals and sea birds in the San Felipe region Medina-Elizalde (Reference Medina-Elizalde2021). Most importantly, five people were intoxicated in Los Angeles Bay after the consumption of unidentified clam species contaminated with PSTs (COFEPRIS, 2015). After 2015, HABs have occurred every year except for 2016 and have caused substantial economic losses due to the prohibition of the extraction of bivalves in the region (Medina-Elizalde, Reference Medina-Elizalde2021).
The reason for the increase in the frequency of occurrence of G. catenatum HABs in the nGC is still unknown. Adequate environmental conditions must exist for cell proliferation but also a seeding population is needed for the development of G. catenatum HABs. Generation of temporal and resistance cysts is a strategy to cope with adverse conditions and facilitates the dispersion of G. catenatum (Dale, Reference Dale and Fryxell1983). Cysts play a critical function in the reproduction of this species, and in other dinoflagellates (Figueroa & Bravo, Reference Figueroa and Bravo2005). Autochthonous and allochthonous G. catenatum bloom formation is associated with the location of the cyst beds in relation to where vegetative growth occurs (Hallegraeff et al., Reference Hallegraeff, Blackburn, Doblin and Bolch2012). In the first case, seedbeds with high concentrations of cysts are present in the same region (Tahvanainen et al., Reference Tahvanainen, Alpermann, Figueroa, John, Hakanen, Nagai, Blomster and Kremp2012) where the proliferation of dinoflagellates occurs, as in the case of Tasmanian blooms. In allochthonous blooms, the abundance of G. catenatum cysts in surface sediments is insufficient for the generation of local HABs and seedbeds are located in nearby areas where excystment occurs (Hallegraeff et al., Reference Hallegraeff, Blackburn, Doblin and Bolch2012). For example, vegetative cells proliferate in the open ocean, and they are transported inshore. This type of HAB occurs in the coastal zone of the Atlantic Iberian Peninsula, specifically in the Galician Rias (Figueroa et al., Reference Figueroa, Bravo, Ramilo, Pazos and Moroño2008).
Germination of cysts serves as an inoculum for the proliferation of some dinoflagellates, and cyst abundance in sediments represents crucial information to understand and possibly predict HABs (Erdner et al., Reference Erdner, Percy, Keafer, Lewis and Anderson2010). For example, recurrent HABs of Alexandrium catenella in the Gulf of Maine are closely related to local cyst seedbeds, and resuspension by currents and waves plays a critical role in cyst redistribution (Butman et al., Reference Butman, Aretxabaleta, Dickhudt, Dalyander, Sherwood, Anderson, Keafer and Signell2014). Physical stress and the erosion capacity of the sediment are related to the release and mobilization of cysts. Therefore, cyst distribution is related to physical characteristics of the sediments and the hydrodynamics of the region (Butman et al., Reference Butman, Aretxabaleta, Dickhudt, Dalyander, Sherwood, Anderson, Keafer and Signell2014). Cysts can behave as fine sediments since there is a high abundance of cysts in areas where this type of sediment dominates (Anderson et al., Reference Anderson, Stock, Keafer, Nelson, Thompson, McGillicuddy, Keller, Matrai and Martin2005; Horner et al., Reference Horner, Greengrove, Davies-Vollum, Gawel, Postel and Cox2011; Triki et al., Reference Triki, Laabir, Lafabrie, Malouche, Bancon-Montigny, Gonzalez, Deidun, Pringault and Daly-Yahia2017).
Gymnodinium catenatum HABs have been recently reported in the nGC (Gárate-Lizárraga et al., Reference Gárate-Lizárraga, Arellano-Martínez, Ceballos-Vázquez, Bustillos-Guzmán, López-Cortés and Hernández-Sandoval2007b; Medina-Elizalde et al., Reference Medina-Elizalde, García-Mendoza, Turner, Sánchez-Bravo and Murillo Martínez2018). The proliferations appear in a well-defined period from December/January to April/March (Ramírez Castillo, 2020) and they are probably associated with cyst seedbeds present in this region. However, there is no information about the presence of resting cysts of G. catenatum and the effect of hydrodynamics (circulation) on their distribution in the nGC. Therefore, we evaluated cyst abundance in surface sediments during two periods that coincided with a non-bloom year condition (July 2016) and after a major HAB registered in the nGC that occurred in January 2017. We related the distribution of the cysts to local circulation to characterize the transport and relocation of the cysts and sediments in the region. Our results provide key information to understand G. catenatum ecology and specifically, to understand the geographic and temporal appearance of HABs in the region.
Characteristics of the northern Gulf of California (nGC)
The Gulf of California has been divided into four zones according to their oceanographic, physical and biological conditions (Espinosa-Carreón & Valdez-Holguín, Reference Espinosa-Carreón and Valdez-Holguín2007). The present study was performed in the shallow (~200 m) northern Gulf of California (nGC) and the shallowest (~30 m) northernmost part denominated as the upper Gulf of California (uGC; Figure 1). The nGC presents a very well-defined seasonality with sea surface temperatures that reach 31–32 °C in August and September, while in January and February temperatures drop to 15–17 °C (Ramírez-León et al., Reference Ramírez-León, Álvarez-Borrego, Turrent Thompson, Gaxiola Castro and Heckel Dziendzielewski2015). Specifically, the uGC is described as an inverse estuary (Lavín et al., Reference Lavín, Godínez and Alvarez1998) with an evaporation rate of 0.8 m y−1 (Montes et al., Reference Montes, Lavín and Parés-Sierra2016). Salinity increases from 35.4 in open areas up to 39 in the shallow parts, due to low annual rainfall and the inverse estuarine conditions (Álvarez-Borrego et al., 1975; Lavín et al., Reference Lavín, Godínez and Alvarez1998). Recorded currents reach 1 m s−1 with tidal ranges up to 6 m (Argote et al., Reference Argote, Amador, Lavín and Hunter1995). Winds blow in a north-westerly direction from July to October, and cold and dry air blow in a south-easterly direction between December and May with speeds up to 8–12 m s−1 cooling the surface waters in the Gulf (Bray & Robles, Reference Bray and Robles1991).
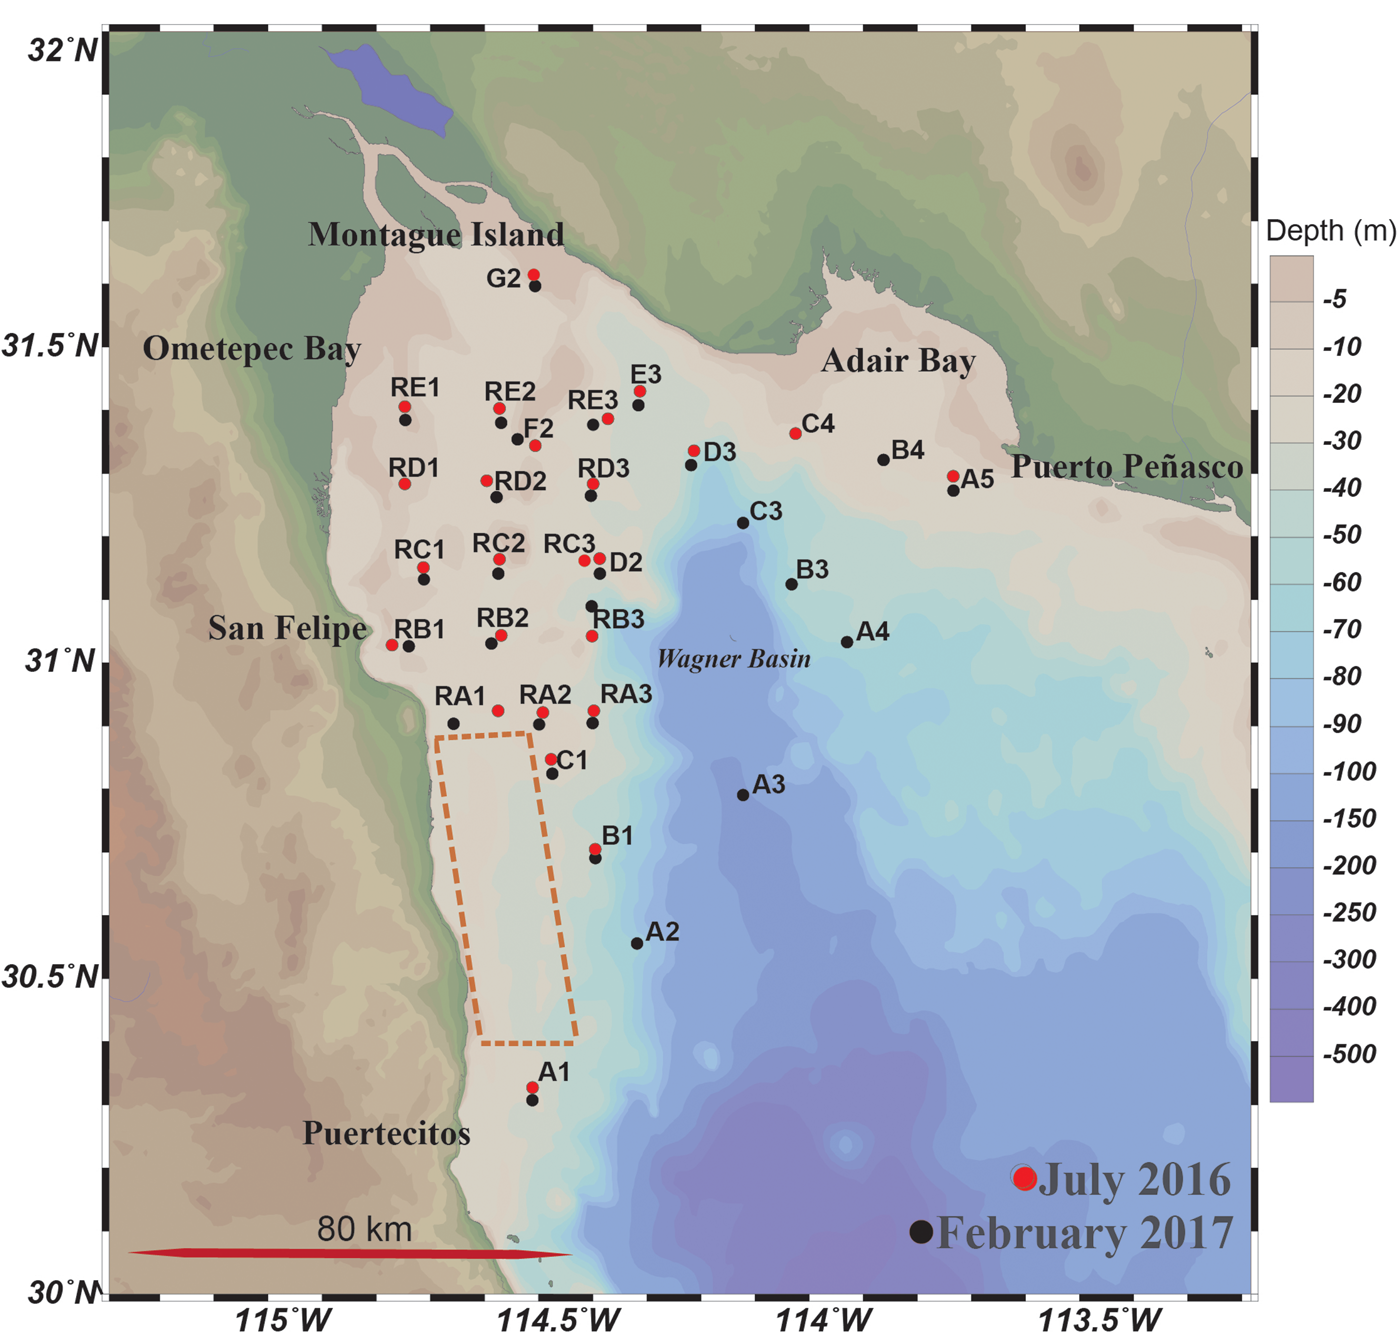
Fig. 1. Northern (nGC) and upper Gulf of California (uGC), and sample collection during July 2016 (red dots; N = 25) and February 2017 (black dots; N = 28). Panopea globosa extraction area is highlighted in a dashed red line.
Tidal amplitude increases in the uGC and the flow accumulates due to the narrowing and shallowing of the seafloor, increasing the maximum tidal range by ~10 m (Stock, Reference Stock1976 in Brusca et al., Reference Brusca, Álvarez-Borrego, Hastings and Findley2017). In the nGC the surface circulation presents a cyclonic gyre during summer (June–September) while an anticyclonic weak gyre occurs from November–March (Lavín et al., Reference Lavín, Durazo, Palacios, Argote and Carrillo1997; Beier & Ripa, Reference Beier and Ripa1999; Palacios-Hernández et al., Reference Palacios-Hernández, Beier, Lavín and Ripa2002).
Materials and methods
Sample collection
Surface sediment samples (N = 53) were collected during two oceanographic campaigns (2016, 2017) on board the Tecolutla Research Vessel of the Mexican Navy. In 2016, a set of 25 samples was collected from 19–27 July. In the second campaign held from 23–28 February 2017, a total of 28 samples were collected. This second sampling period took place after one of the most major HABs in this region. The sampling stations were located between 30°–32°N and 112°–115°W at depths from 3–168 m (Figure 1).
Sediment samples were taken using a Mini Multi-Corer MC-200-4 from Ocean Instruments, Inc. It carries four 6.25 cm × 32.5 cm sample tubes with an effective penetration of 20 cm. Each sediment sample was stored in airtight containers in darkness at 4 °C until analysed in the laboratory.
Palynological analysis
Surface subsamples were lyophilized and processed by the modified palynomorph extraction technique of Wood et al. (Reference Wood, Gabriel, Lawson, Jasonius and McGregor1996). This technique consists in washing 10 g of freeze-dried sediment sample with detergent and adding a tablet of Lycopodium clavatum (Batch: 124,961 = 12,542 ± 931 spores per tablet; Lund University, Sweden) to estimate the concentration of cysts recovered per gram of dry sediment (cyst g−1) (Maher, Reference Maher1981; Mertens et al., Reference Mertens, Verhoeven, Verleye, Louwye, Amorim, Ribeiro and Deaf2009, 2012). The carbonate elements and silicates were removed with hydrochloric acid and hydrofluoric acid, respectively. After this treatment, sodium polytungstate (Density = 2) was added to separate organic and inorganic matter and sieved to isolate the 120–15 μm fraction. Finally, 7–10 drops of the residue were collected and mounted on a 25 × 50 mm coverslip with glycerine-jelly. The cyst concentrations for the 53 samples were calculated using the Benninghoff's (1962) formula. The mean and standard deviation were calculated for the exotic marker (Lycopodium) recovered from all samples (Maher, Reference Maher1981).
Considering the low recovery of organic-walled dinoflagellate cysts, a minimum sample size (n0) was calculated based on values of L. clavatum spores (N = 12,542) as a finite population. Cochran's Formula (n 0 = Z 2 p q/e 2) (Cochran, Reference Cochran1963; Singh & Masuku, Reference Singh and Masuku2013) was applied with a confidence of 95% (Z = 1.96) and a margin of error of 5% (e = 0.05). As a result, a minimum expected number of L. clavatum was 412-spores for tablets with 12,542-spores and a standard deviation in L. clavatum recovery of 804 spores in the 53 samples. Therefore, this study considered the presence of at least 800 spores in the palynological laminae recovery. The plates were analysed (duplicate) with an Olympus optical microscope (CX31) at 400 × magnification, and sweeps were made from one side to the other of the plates, completely covering the surface with ~24 sweeps. For a more detailed analysis of the cysts present in the samples 600 × and 1000 × amplifications were used. Photographs were taken with an Olympus camera integrated to the microscope. Gymnodinium catenatum cysts were identified according to their size, shape and reticulation as described by Anderson et al. (Reference Anderson, Jacobson, Bravo and Wrenn1988), Rees & Hallegraeff (Reference Rees and Hallegraeff1991) and Bolch et al. (Reference Bolch, Negri and Hallegraeff1999). The abundance of G. catenatum cysts found in the samples were quantified to determine their contribution to the trophic affinity of dinoflagellate cysts of other species found in the samples.
Granulometry analysis
The sediment in the study area is predominantly silt, clay and fine sand (Carriquiry et al., Reference Carriquiry, Sánchez and Camacho-Ibar2001). To characterize the type of sediments present in the study area a subsample was wetly sieved (350–500 μm). The fine portion that passed through the sieves was gauged with distilled water and sodium oxalate was added as a dispersant, and the mixture was agitated. A subsample was diluted with distilled water and sodium oxalate, shaken and added to the analysis chamber of the LISST model 100X-C Laser In-Situ Scattering and Transmissometer (LISST-100X – Sequoia Scientific). The angular range programmed in the Transmissometer corresponds to a spherical particle size range of 2.5–500 μm diameter. The grain size distribution was estimated with the GRADISTAT v8.0 software (Blott & Pye, Reference Blott and Pye2001). The Udden–Wentworth granulometric scale was used to classify the type of sediment present in the samples (Wentworth, Reference Wentworth1922) (Table S2).
Chlorophyll-a satellite analysis
Satellite chlorophyll-a (Chlsat) images were obtained from the Sentinel-3 OLCI Level 2 full resolution (WFR). Chlorophyll-a concentration values were extracted for 28 stations (Table S3), with a spatial resolution of 300 m per pixel for different dates of 2017 when images were available (6, 18, 19, 30 January, 10, 21, 25 February and 1 March). Products were directly obtained from the Copernicus Online Data Access (CODA) of the European Space Agency (ESA) and processed with SNAP-ESA Sentinel Application Platform v7.0.0 (http://step.esa.int).
A monitoring program for G. catenatum has been conducted by FICOTOX laboratory (CICESE) since 2011 in the P. globosa clam extraction areas located south of San Felipe (Figure 1). The database was consulted for surface cell abundance reported in cells l−1, thus the information for abundance is limited to this area.
Statistical analysis
The distribution of cyst concentrations from the 53 sampling stations were tested for normality with a Shapiro–Wilk test. Data distribution failed the normality test, and differences in G. catenatum cyst concentrations by years were tested with a Wilcoxon test, comparing paired samples and considering increases or decreases in the concentrations, also the number of both negative and positive differences were analysed (Siegel & Castellan, Reference Siegel and Castellan1988).
A principal component analysis (PCA) was performed to evaluate the relationship between satellite derived Chlsat and the abundance of cysts in the nGC. PCA was applied to simplify the complexity in the relationship between the distribution and abundance of G. catenatum cysts, and the Chlsat values in the 28 stations sampled in February 2017. The level of significance of all statistical tests was α = 0.05. Analyses were performed with Statistica software v12.5 (StatSoft, 2014).
The association between the sediment grain size and G. catenatum cyst concentrations was also verified on both sampling years with cluster analysis. The Unweighted pair-group average (UPGMA) algorithm using the correlation distance matrix of the sediment component (in %) and cyst concentration in the nGC by year was used to explore the association between variables. These analyses were performed in the software PAST v4.02 (Hammer et al., Reference Hammer, Harper and Ryan2001).
Cyst geographic distribution analysis
Gymnodinium catenatum cyst concentrations interpolation between stations was performed with the Data-Interpolating Variational Analysis tool (DIVA) of Ocean Data View (ODV v5.5.1) software (Schlitzer, Reference Schlitzer2021). Cyst distribution was compared with the mean surface currents velocity field at 5 m above the bottom for July 2016 and February 2017. These velocity fields were generated with a Numerical Ocean Model implemented in the region.
Numerical Ocean Model and particle-tracking experiments
Numerical ocean-model outputs were included in the analysis to elucidate the possible origin and distribution of the cysts in the nGC. This numerical model is based on the Regional Ocean Modeling System (ROMS, e.g. Rivas & Samelson, Reference Rivas and Samelson2011). It extends from the nGC through ~500 km beyond the Gulf's mouth (see Figure S1). The model has a horizontal resolution of ~3 km and 22 sigma levels in the vertical (with enhanced resolution near the bottom and the surface). The configuration, mixing/advection schemes and boundary treatment are based on the regional model used by Cruz-Rico & Rivas (Reference Cruz-Rico and Rivas2018). Monthly data from the Global Ocean Data Assimilation System (GODAS; e.g. Ravichandran et al., Reference Ravichandran, Behringer, Sivareddy, Girishkumar, Chacko and Harikumar2013) were used in the model's lateral open boundaries, adding daily sea surface height and geostrophic velocity taken from an altimeter gridded product of absolute dynamic topography (Rio et al., Reference Rio, Pascual, Poulain, Menna, Barceló and Tintoré2014). At the surface, net heat flux, freshwater flux (evaporation minus precipitation), and wind stress were calculated internally in the model, using bulk formulae (Fairall et al., Reference Fairall, Bradley, Rogers, Edson and Young1996), from meteorological surface fields from the North American Regional Reanalysis (NARR; Mesinger et al., 2006).
In particular for the nGC, a comparison between monthly sea surface temperature of the model and the corresponding satellite product shows high correlations (r ≥0.94) for the 2013–2017 period, and moderate correlations (0.40 ≤ r an ≤ 0.79) after removing the mean seasonal cycle (Figure S1). The lowest correlations are found in a small northern area, most probably associated with a water input from land, which is absent in the model. Although a comparison with other variables such as water velocity is necessary to determine if the model reproduces the water circulation adequately, as will be shown below, the model shows circulation patterns consistent with those reported in the literature, which reinforces the confidence in this numerically modelled velocity field.
Geographic origin of the cysts found in the uGC was explored by a Lagrangian particle-tracking method based on Rivas & Samelson (Reference Rivas and Samelson2011). This approach consists of computing paths of particles that are passively advected by the model's three-dimensional velocity field. Groups of particles were initialized at the positions of the observational points and advected backward in time for 30 days (analysing intermediate points at 6, 14, 22 and 30 days), to determine the possible locations of the sources of cysts assuming that they were generated by vegetative cells during the HAB. In this way, the image of the Lagrangian paths during the 22 days prior to the particles release was selected in both analyses (July and February) since the particles manage to separate sufficiently from their initial point without leaving the domain determined in the analysis (Figure S2).
For analysis of the July-2016 sampling period, particles were released on 22 July at bottom depth for the 20 observational points with non-zero cyst concentration. Similarly, for the February-2017 analysis, particles were released on 25 February at the surface of the 23 observational points with non-zero cyst concentration. The objective of these experiments was to explain the possible origin of the cysts of G. catenatum observed in July 2016 and February 2017 by taking as a destination the location at the time of sampling.
Results
Gymnodinium catenatum cysts were pale brown, spherical and microreticulated (five and six-sided), with low (<2 μm) rounded ridges that covered the entire cyst surface (Figure 2). The diameter of the cysts collected in the nGC ranged from 38–60 μm. The cingulum was bordered by two cingular bands, and the sulcus presented a longitudinal line of paravesicles that begins at the lower margin of the flagellar pore region, showing a whorled pattern of paravesicles. Cysts were often split along the edge of the cingulum (roughly in half) as described by Anderson et al. (Reference Anderson, Jacobson, Bravo and Wrenn1988) (Figure 2).
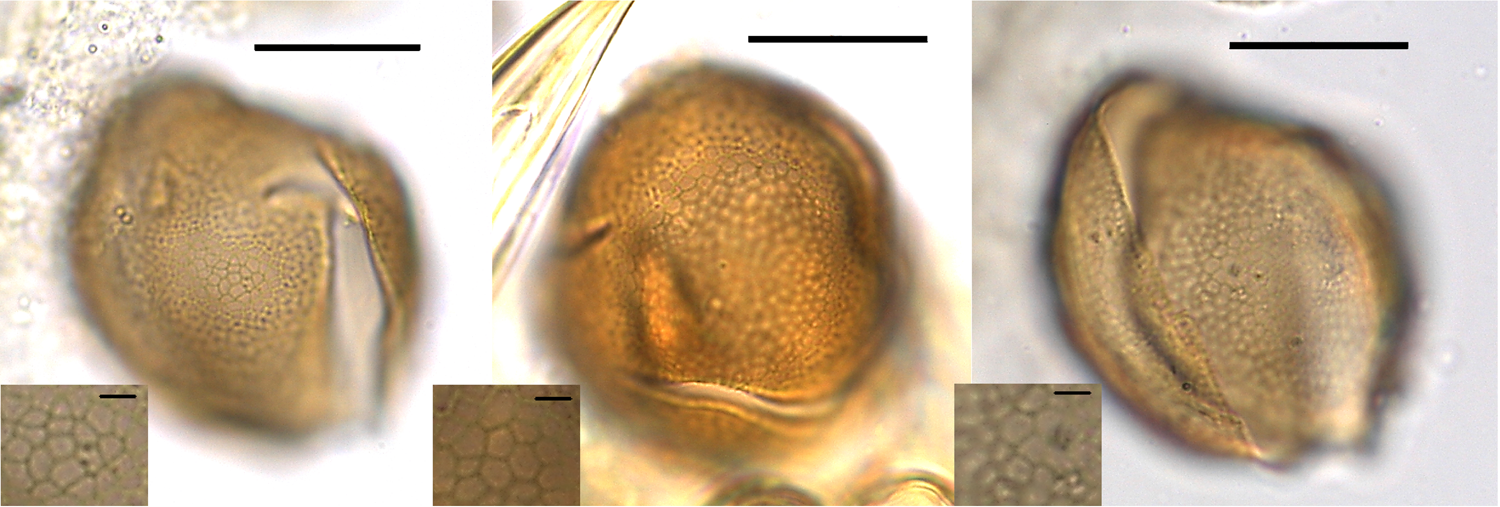
Fig. 2. Gymnodinium catenatum cysts found in sediments collected in the northern Gulf of California. The reticulate delineate five to six-sided paravesicles (details in lower left corner of the photographs, scale bar 2 μm). The empty cysts are divided roughly in half. Scale bar 20 μm.
Cysts of G. catenatum were identified in 43 of the 53 sampling locations (N = 20 in 2016, N = 23 in 2017). In July 2016, G. catenatum represented 23% (805 cysts) of the assemblage of 3481 cysts, and 39% of the autotrophic species cysts. In February 2017, the relative abundance of G. catenatum increased slightly to 27% (1146 cysts) of the total cyst assemblage (4223), where autotrophic species represented 51%. Cyst assemblages in surface sediments of the nGC showed a high diversity with respect to the GC.
Cyst concentrations in sediments observed in 2016 (N = 805) were significantly different to the ones detected in 2017 (N = 1146, P = 0.021). In 2016, concentrations varied between 6–124 cyst g−1 with an average of 32 cyst g−1 and in 2017, concentrations varied from 8–158 cyst g−1 (41 cyst g−1; Table S1). In general, during both sampling years the same relative abundance of empty cysts (~50–60%) was observed, except in those stations located close to Adair Bay where all the cysts were open in 2017.
Cyst geographic distribution
The geographic distribution of the cysts and their relationship with the bathymetry was analysed to characterize areas that presented a change in cyst accumulation between sampling periods.
The sampling effort was concentrated on relatively shallow stations. Only a few sampling stations were in depths below 50 m. Most of the G. catenatum cyst found in July 2016 (92%) were distributed in a range between 3–32 m depth (Figure 3A). The remaining 8% of the cysts were present in sediments below 42 m depth (Figure 3A). In February 2017, 85% of the cysts were accumulated in the range between 3–32 m depth. In this period (Figure 3B), some samples were collected in depths below 50 m. 61 cyst g−1 were registered at 67 m in station B3, and 7 cyst g−1 were detected in a sample collected from the Consag Basin at a depth of 168 m (Figure 3B). Therefore, the major proportion of G. catenatum cysts were found above 30 m depth in the shallow zone of the nGC. They were heterogeneously distributed in this area. In 2016, cysts were present in the north and north-east zones, and mainly constrained to the uGC (Figure 3C). A clear accumulation area with cyst concentrations of 110–120 cyst g−1 was located off the coast between San Felipe and Ometepec Bay extending north-north-east towards the coast of Sonora (Figure 3C). A different distribution pattern was observed in 2017. Three accumulation areas with high cyst concentrations were identified: (1) the west coast of the southern nGC between San Felipe and Puertecitos with concentrations higher than 150 cyst g−1; (2) the Adair Bay at the north-west of Puerto Peñasco with 112 cyst g−1; and (3) south of Montague Island in the centre of the uGC in the Colorado River Delta Biosphere Reserve with concentrations around 90 cyst g−1 (Figure 3D).
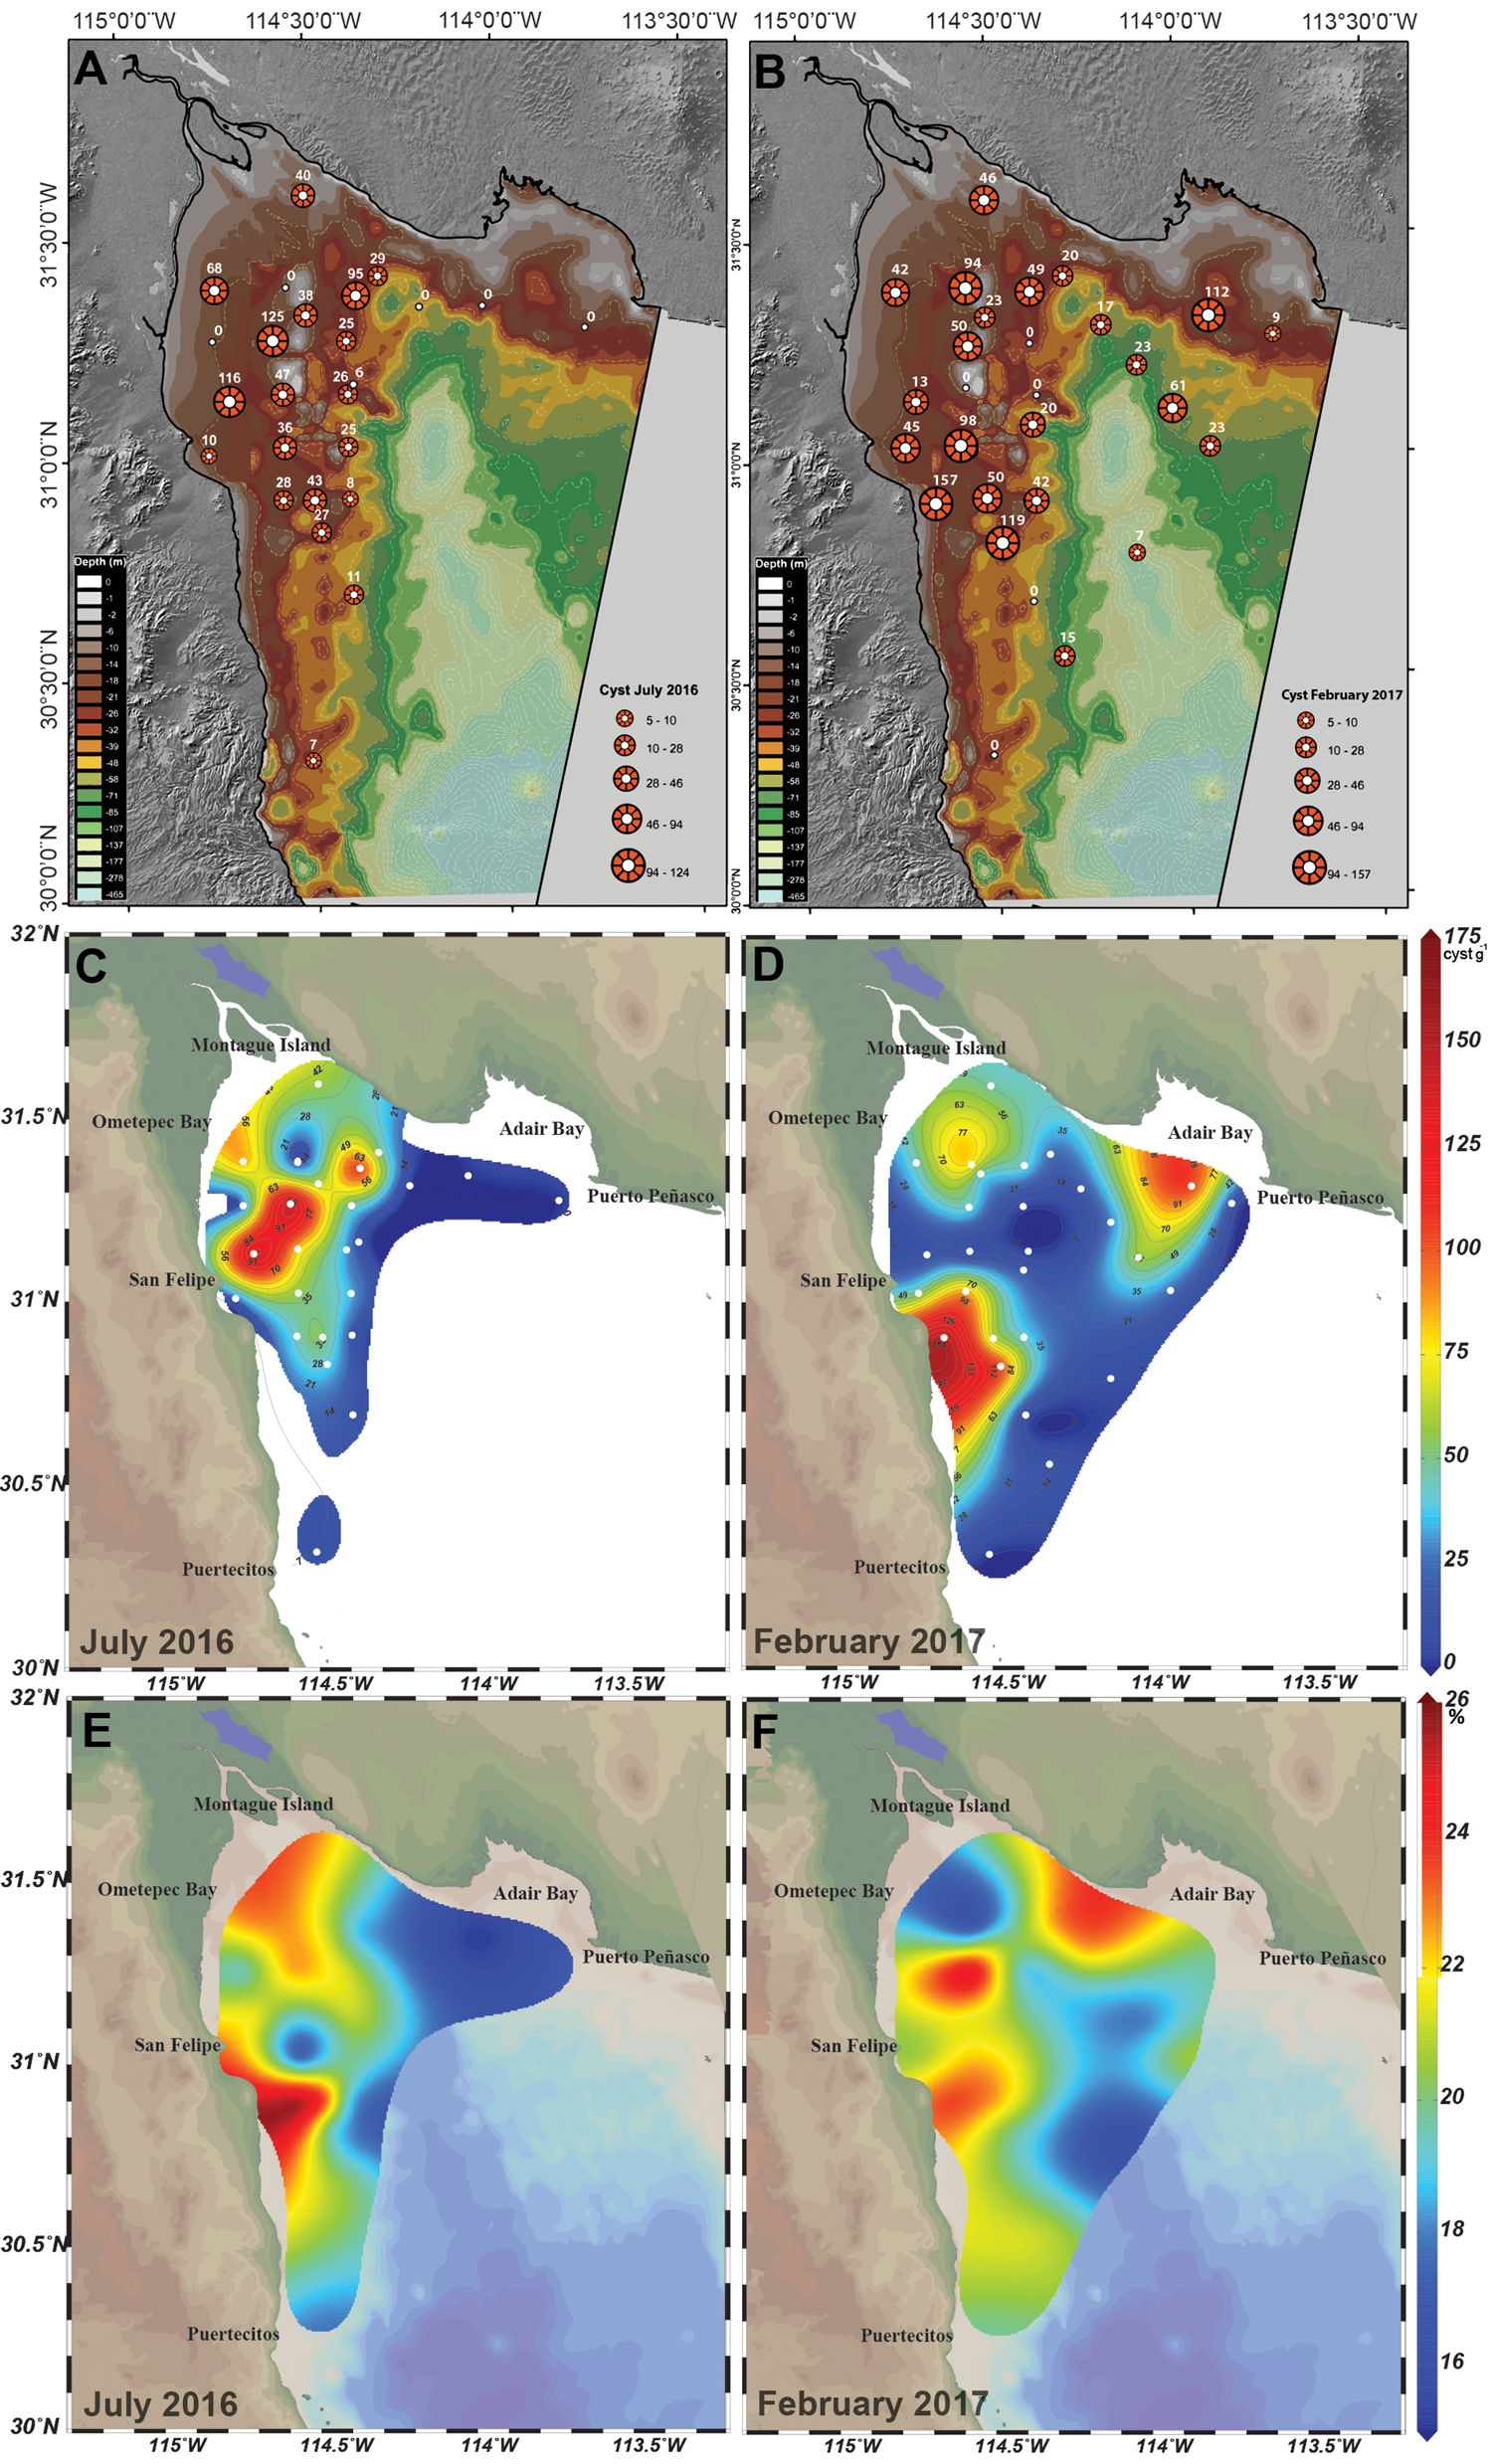
Fig. 3. Distribution of cysts in the northern Gulf of California, the image shows bathymetry and cyst concentration during (A) July 2016, and (B) February 2017 sampling campaigns. Geographic distribution of G. catenatum cysts concentrations observed during (C) July 2016 and (D) February 2017. Right scale shows concentrations from 0 to 175 cysts g−1. (E) Distribution of fine silts (in %) in July 2016 and (F) fine sands (in %) in February 2017 in the northern Gulf of California.
Granulometry characteristics of the sediment
The analysis of the type of sediment present in the nGC during the 2016 and 2017 sampling campaigns was performed to evaluate if cysts were associated with specific sediment types and if they presented a similar spatial distribution pattern. The sediment grain composition was similar in both sampling periods (Table 1). Silts (≈2–63 μm) represented 79.3 and 74.6% of all grain components for July 2016 and February 2017, respectively. Sands represented 20.6% of all grain fractions for July 2016 and 25.3% in February 2017. In July 2016 clay represented 1.4% of all components and was absent in February 2017. Representation of the sand subfractions was also similar in both sampling periods, with the exception of medium sand that was 0.3% of all sediment components in July 2017 and 6.3% in February 2017. In relation to mud subfractions, fine and very fine silts were more represented (20.4 and 12.5%) in July 2016 than in February 2017 samples (9.9 and 1.2%; Table 1 and Table 2S).
Table 1. Granulometric composition (in percentage) of sediment samples collected in July 2016 and February 2017 in the northern Gulf of California

Micron size range is presented.
We analysed the relation between the type of sediment and the presence of G. catenatum cysts in each station of both sampling campaigns. Gymnodinium catenatum cysts were associated with different sediment components in the two sampling periods. In February 2017, G. catenatum and the fine sand fraction formed a group that was separated from the rest of the granulometric components with a similarity value of 0.2. In contrast, in July 2016 cysts were associated with fine silt (corr. 0.3), a much smaller size fraction component. The association of fine silt and fine sand with the presence of G. catenatum cysts was evident when the spatial distribution of these sediment fractions was analysed. In July 2016 the highest accumulation of fine silt was found in front of San Felipe and Ometepec Bay (Figure 3E). This type of grain represented ~20% of the sediments and, as described before, a high concentration of G. catenatum cysts was also found in these areas (Figure 3C). In February 2017, similar to the G. catenatum cyst distribution, fine sands accumulated in two well-defined areas of the nGC. Fine sand represented ~8% of the sediment components close to the coast south from San Felipe to Puertecitos, and in front of Adair Bay, in the east coast of the region (Figure 3F).
Deposition of the cysts produced by G. catenatum, transport and relocation define the accumulation areas of this material. Sediments are also exposed to transportation and relocation processes. In February 2017 the geographic distribution of the cysts could be related to the HAB of G. catenatum that occurred one month before.
The 2017 G. catenatum HAB
Gymnodinium catenatum is commonly present in the P. globosa extraction areas from November/December to April/May (Medina-Elizalde et al., Reference Medina-Elizalde, García-Mendoza, Turner, Sánchez-Bravo and Murillo Martínez2018). In the 2015 HAB G. catenatum maximum surface cell abundance was 152 × 103 cells l−1 and represented as much as 55% of all species collected in net samples (Medina-Elizalde et al., Reference Medina-Elizalde, García-Mendoza, Turner, Sánchez-Bravo and Murillo Martínez2018). In 2016, maximum surface cell abundance in January was 320 cells l−1; therefore, cyst abundance detected in July of this year was associated with a non-bloom year. In contrast, cysts in February 2017 were associated with a bloom that occurred before the sampling period. Gymnodinium catenatum was detected from January (no samples were obtained in December) to May 2017 in the clam extraction areas. The highest abundance of 311 × 103 cells l−1 in surface was detected in January 17 (Figure 4) and G. catenatum represented 92% of the phytoplankton community on this date (Figure 4). Cell abundances decreased to 283 × 103 cells l−1 in January 23 and to 28.5 × 10³ cells l−1 in February. On these dates, G. catenatum still was highly represented in net samples (higher than 60%) and detected in various samples collected in April but not in May (Figure 4).
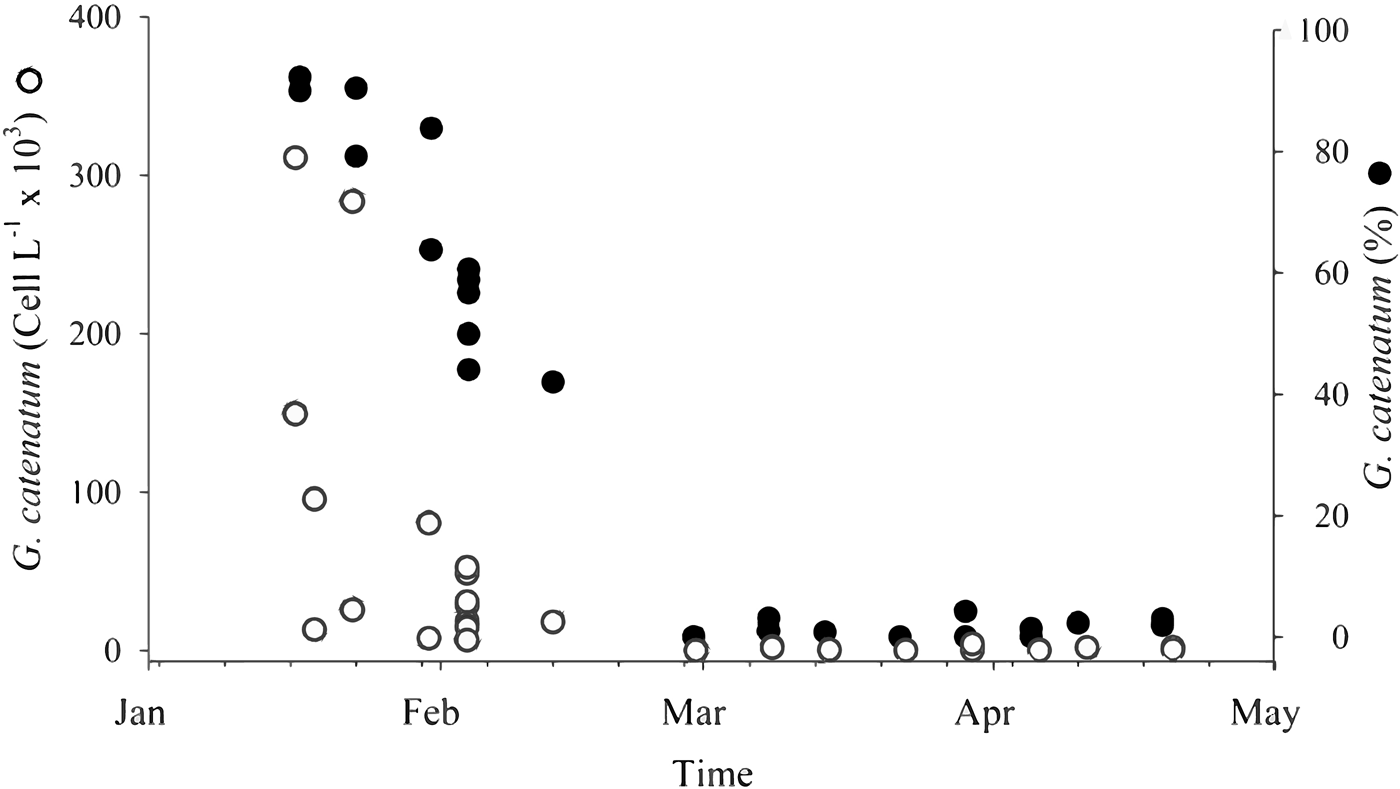
Fig. 4. Gymnodinium catenatum surface abundance and relative abundance in net samples collected in the clam extraction area south from San Felipe, B.C.
Information of the HAB was limited to P. globosa extraction area. Therefore, to evaluate the probable extension and evolution of the HAB in the region, the distribution of the chlorophyll-a concentration was estimated from satellite data (Chlsat). On 6 January, the accumulation of Chlsat was evident as filaments in the west coast south from San Felipe Bay. On 18 and 19 January, the area of high Chlsat increased in the west coast of the nGC. Especially, concentrations higher than 15 mg m−3 were detected in an area of ~600 km−2 located parallel to the coast between San Felipe and Puertecitos. Low Chlsat were present to the north and to the east of this area. Another Chlsat accumulation area was detected in the continental coast of the nGC close to Adair Bay and Puerto Peñasco. The highest Chlsat (23 mg m−3) and the largest extension of the bloom were detected on 10 February (Figure 5). During the period of the sampling campaign the Chlsat decreased as seen in the images of 21, 25 February and 1 March (Figure 5). After this last date, Chlsat was lower than 5 mg m−3 in the region. Chlsat indicates that the bloom initiated in the west side of the Gulf south from San Felipe (although there is also a small area of high Chlsat in the continental side of the Gulf) and moved and dispersed in a northward but principally in a westward direction.
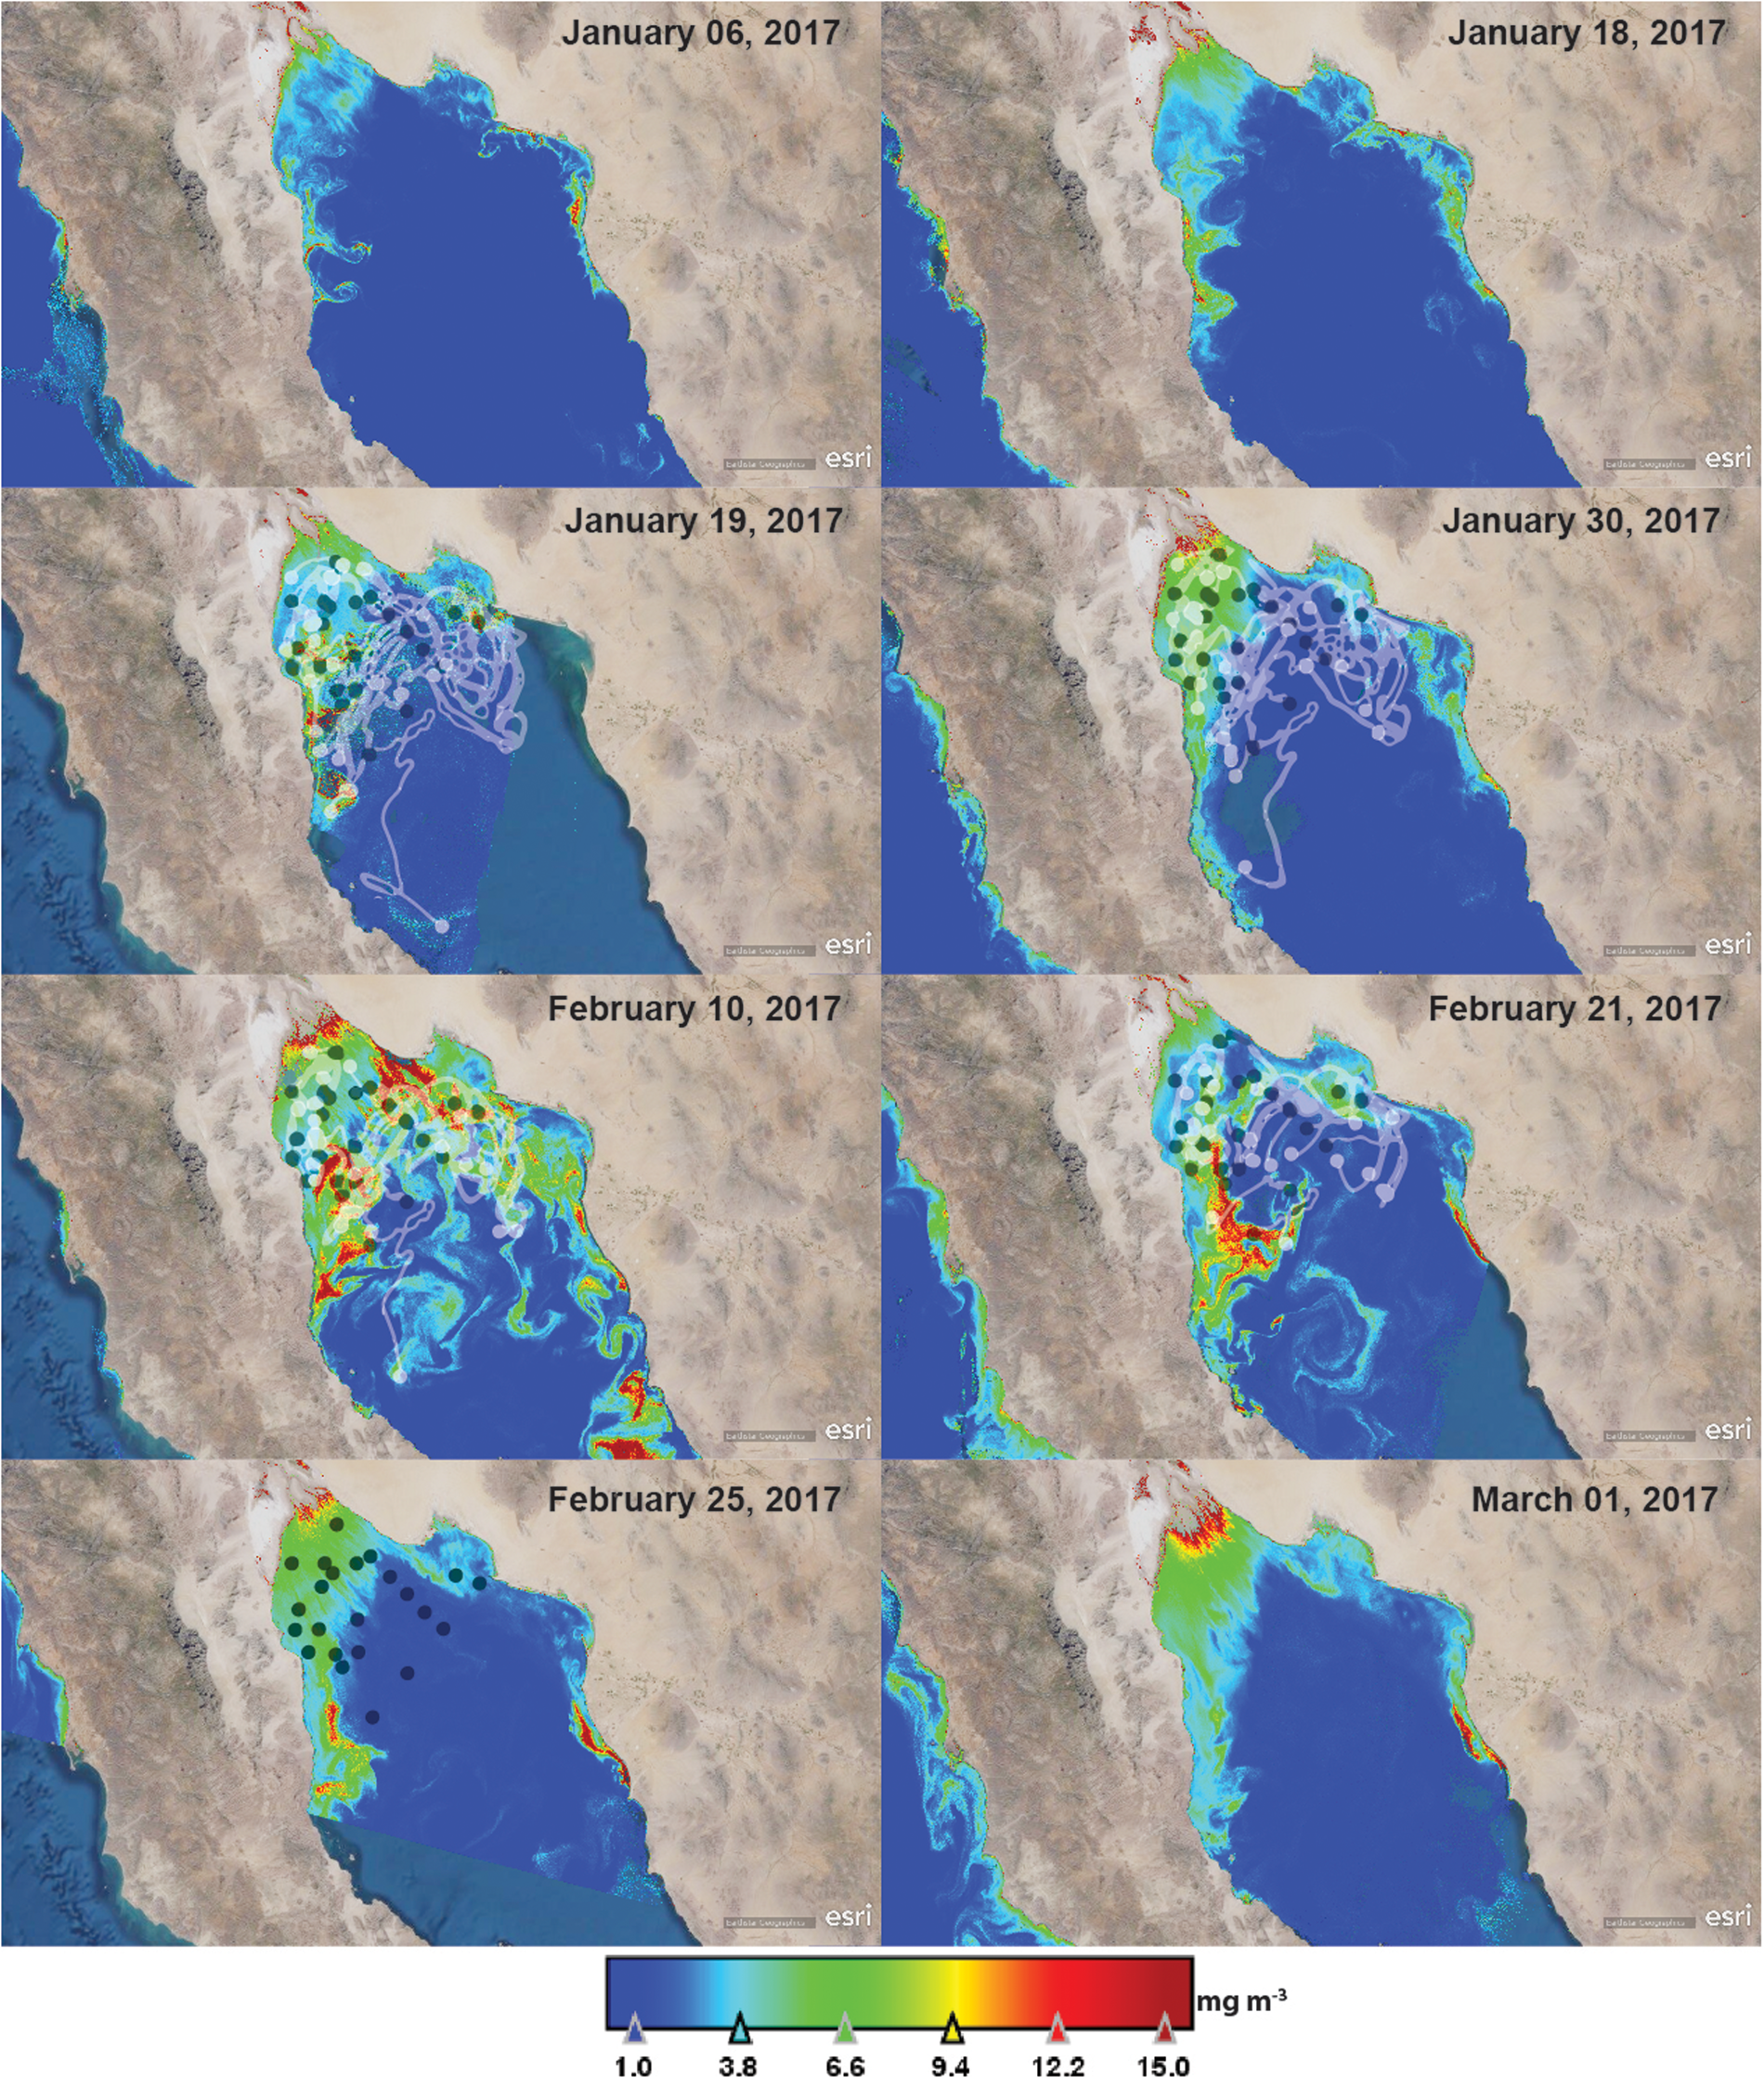
Fig. 5. Distribution of satellite-derived chlorophyll-a concentration (Chlsat) in January and February 2017 in the northern Gulf of California. Chlsat is presented at a maximum concentration of 15 mg m−3 in the figures. Lagrangian trajectories estimated from the Lagrangian particle-tracking analysis from 19 January to 25 February 2017 are also presented. Black dots represent the final position of the advected particles on 25 February. The white dots represent the position of the particles in the daytime indicated on the satellite chlorophyll image (10, 21, 25 February and 19, 30 January). The lines represent the trajectory between these dates.
The result of the particle-tracking analysis, introduced in the Chlsat maps, also indicates this dispersion pattern of the bloom. For example, particles of 19 January that originated in the west coast of the Gulf showed westward and northward trajectories and remained in the nGC, mainly in the upper region (Figure 5). Therefore, the areas of high cysts accumulation in February 2017 were probably related to the appearance and dispersion of the HAB.
To probe this assumption, the relation between Chlasat and cysts abundance in the sediment was analysed with a principal component analysis (PCA).
Three factors of the PCA explained 73.1% of the total variance of the relation between Chlsat during different dates and G. catenatum cyst abundance (Table S4). PCA showed the formation of two groups. 6, 18, 30 January and 25 February, and 1 March 2017, formed a group with lower Chlsat concentration compared with the second group comprising 19 January, 10 and 21 February, that was positively correlated with cyst abundance (Figure 6). This analysis supports the assumption that February 2017 seedbeds originated from the HAB present in the region ~1 month before the sampling period.

Fig. 6. PCA results of the relation between Chlsat concertation of several days between 19 January, 10 and 21 February with cyst abundance.
Cyst dynamics in the northern Gulf of California
Gymnodinium catenatum cyst distribution in February coincided with the distribution of relatively large grain types of sediments (fine sands) and of Chlsat. Therefore, location of seedbeds in February was probably associated with the bloom of the dinoflagellate and its dispersion. To check this, we evaluated the dispersion of vegetative cells related to water circulation using a numerical circulation model and particle advection experiments. The circulation pattern at the surface and at 5 m above the bottom were characterized during February 2017 in the nGC (Figure 7A). Surface circulation in this month was dominated by a strong anticyclonic eddy located south of the sampling area at about 30.5° N. The highest speeds both on the surface and close to the bottom were present in this eddy with a maximum mean of 0.42 and 0.12 m s−1, respectively. The intensity of surface currents decreased northward from the eddy where a west to the east flow direction was clearly evident around 31°N. As the intensity of surface currents decreased towards the northernmost part of the uGC, the circulation showed different directions. Especially south of Montague Island and south of San Felipe there was a poorly defined circulation pattern. In this region surface, current speeds were <0.10 m s−1. In contrast to surface circulation, there was an unclear circulation pattern at the bottom of the uGC and, in general, the current speeds are slower than ones at the surface.
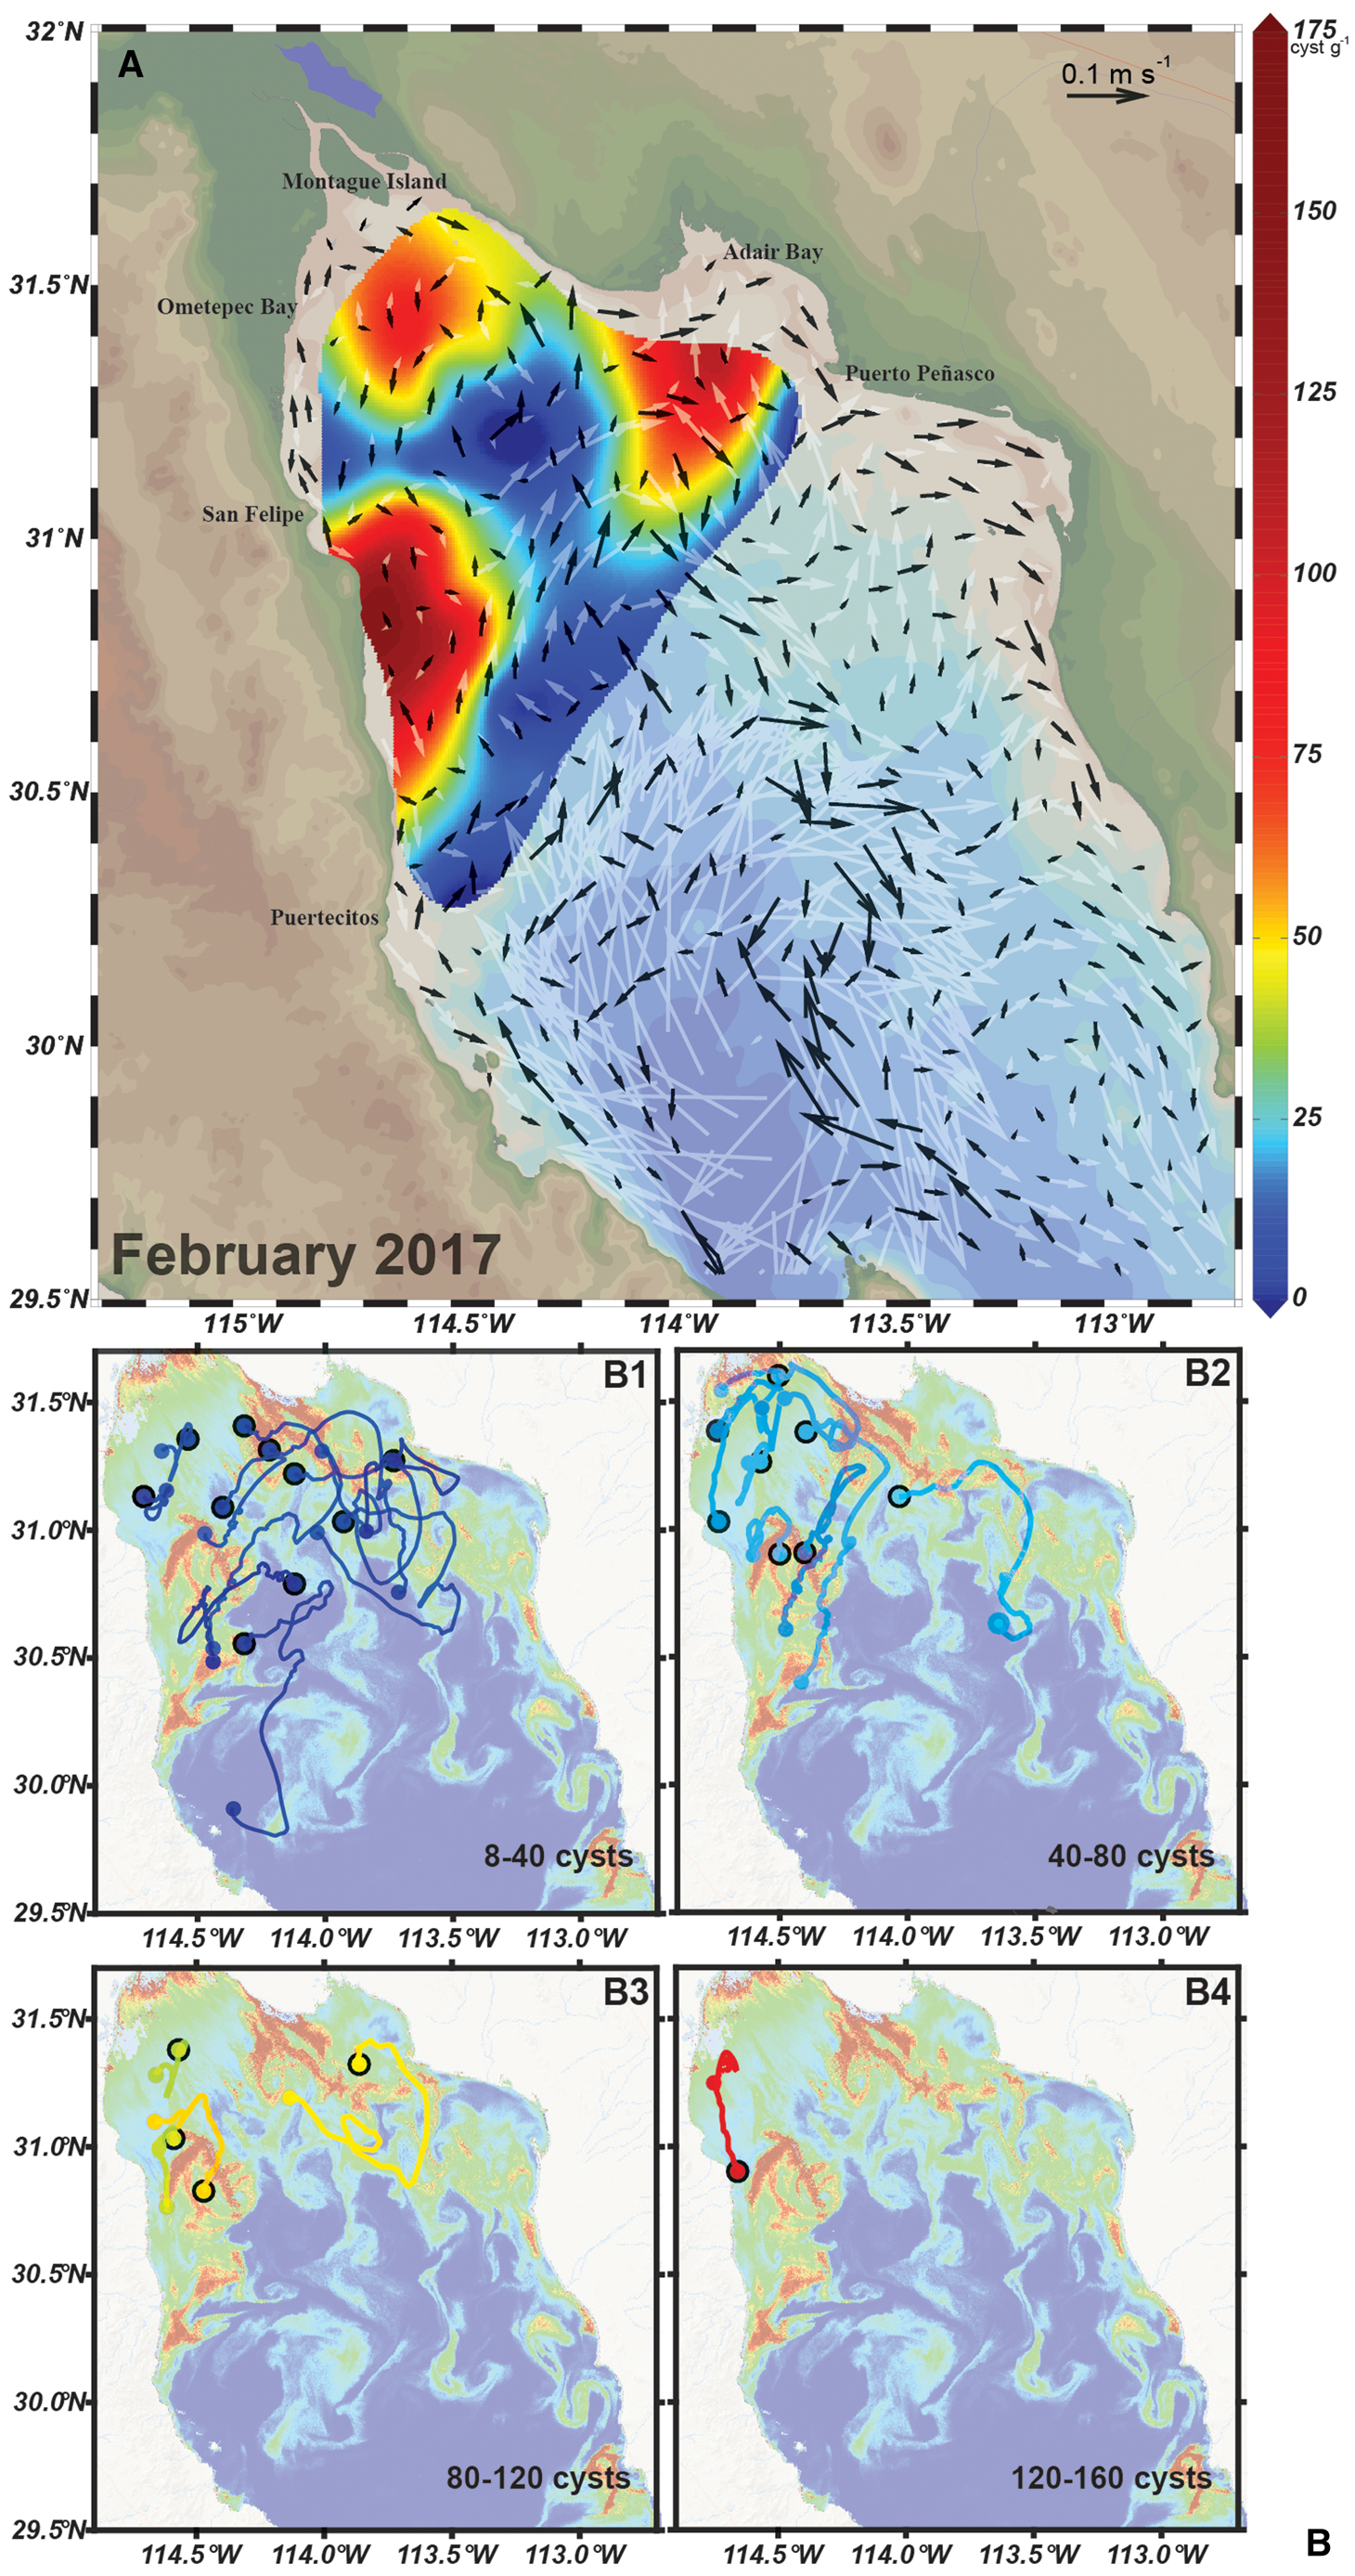
Fig. 7. (A) Vectors of monthly mean velocity at the surface (white vectors) and at 5 metres above the bottom (black vectors), and G. catenatum distribution (colour scale) in February 2017; the maximum surface speed is 0.42 m s−1. (B) Lagrangian 22-day trajectories, during 3–25 February 2017; large dots and black outline represent the positions final of the advected particles on 25 February; these final positions correspond to the observational points with non-zero cyst concentration indicated by the rainbow-coloured palette. The trajectories were separated according to their cyst concentration in four ranges for clarity in the plots, and are plotted on the Chlsat image of 10 February 2017, as a base map.
Cyst beds were found in locations with weak surface and bottom flow as was evident in the west and in the northern areas of the nGC. Also, a high cyst accumulation area was located where the surface direction of the flow was towards the coast, as in Adair Bay (Figure 7A). The location of the cysts for this period seemed to be unrelated to the near-bottom circulation. This was confirmed by the modelled Lagrangian particle-tracking results (Figure 7B).
We followed the movement of particles released on the surface assuming that the cysts found in the sediment originated from the HAB recorded during this period. The origin of the cysts located in areas of low concentration (<80 cysts g−1) in the sediments was heterogeneous (Figure 7B 1). In contrast, cysts in high accumulation areas originated from nearby locations. The cysts in seedbeds detected between San Felipe and Puertecitos most probably had their origin in northern locations, then were transported in a southward direction (Figure 7B 2–4).
The cysts on the continental side of the nGC (Adair Bay) seemed to originate from particles (vegetative cells) located north-west and southward from this location and it is likely they are transported from the uGC towards Adair Bay. The cysts located close to Montague Island are related to particles present south from this location or seemed trapped in this area (Figure 7B1 and B3). Circulation and particle-tracking analysis indicate that HABs present a local behaviour since cysts are deposited during vegetative proliferation and remain trapped in the northern part of the region. This was corroborated in the analysis of the circulation condition and particle tracking during the cyclonic gyre in July 2016. In this period, the circulation is characterized by a strong cyclonic eddy centred around 30.5° N and strong surface currents on the east side oriented towards the uGC (white vectors in Figure 8A). The surface currents were more intense than the ones present in February 2017, since they reached speeds up to 0.54 ms−1. Currents at the bottom were weaker (0.15 ms−1) than surface currents. The strongest currents were present in the upper part of the Gulf and in the west coast related to the eddy located at 30.5° N. In both areas, the bottom circulation presented a southward direction. The high concentration of cysts of G. catenatum in the peninsular side of the uGC is most likely related to the bottom circulation pattern. Seedbed was located in an area where bottom speeds and direction were different from the surrounding predominant pattern. There is a strong east to west current in the northernmost part of the uGC that turns southward, and flows close to the coast (Figure 8A). The west cysts are retained since the speed of the bottom is minimal in this area and runs to the north-east direction (Figure 8A, B).
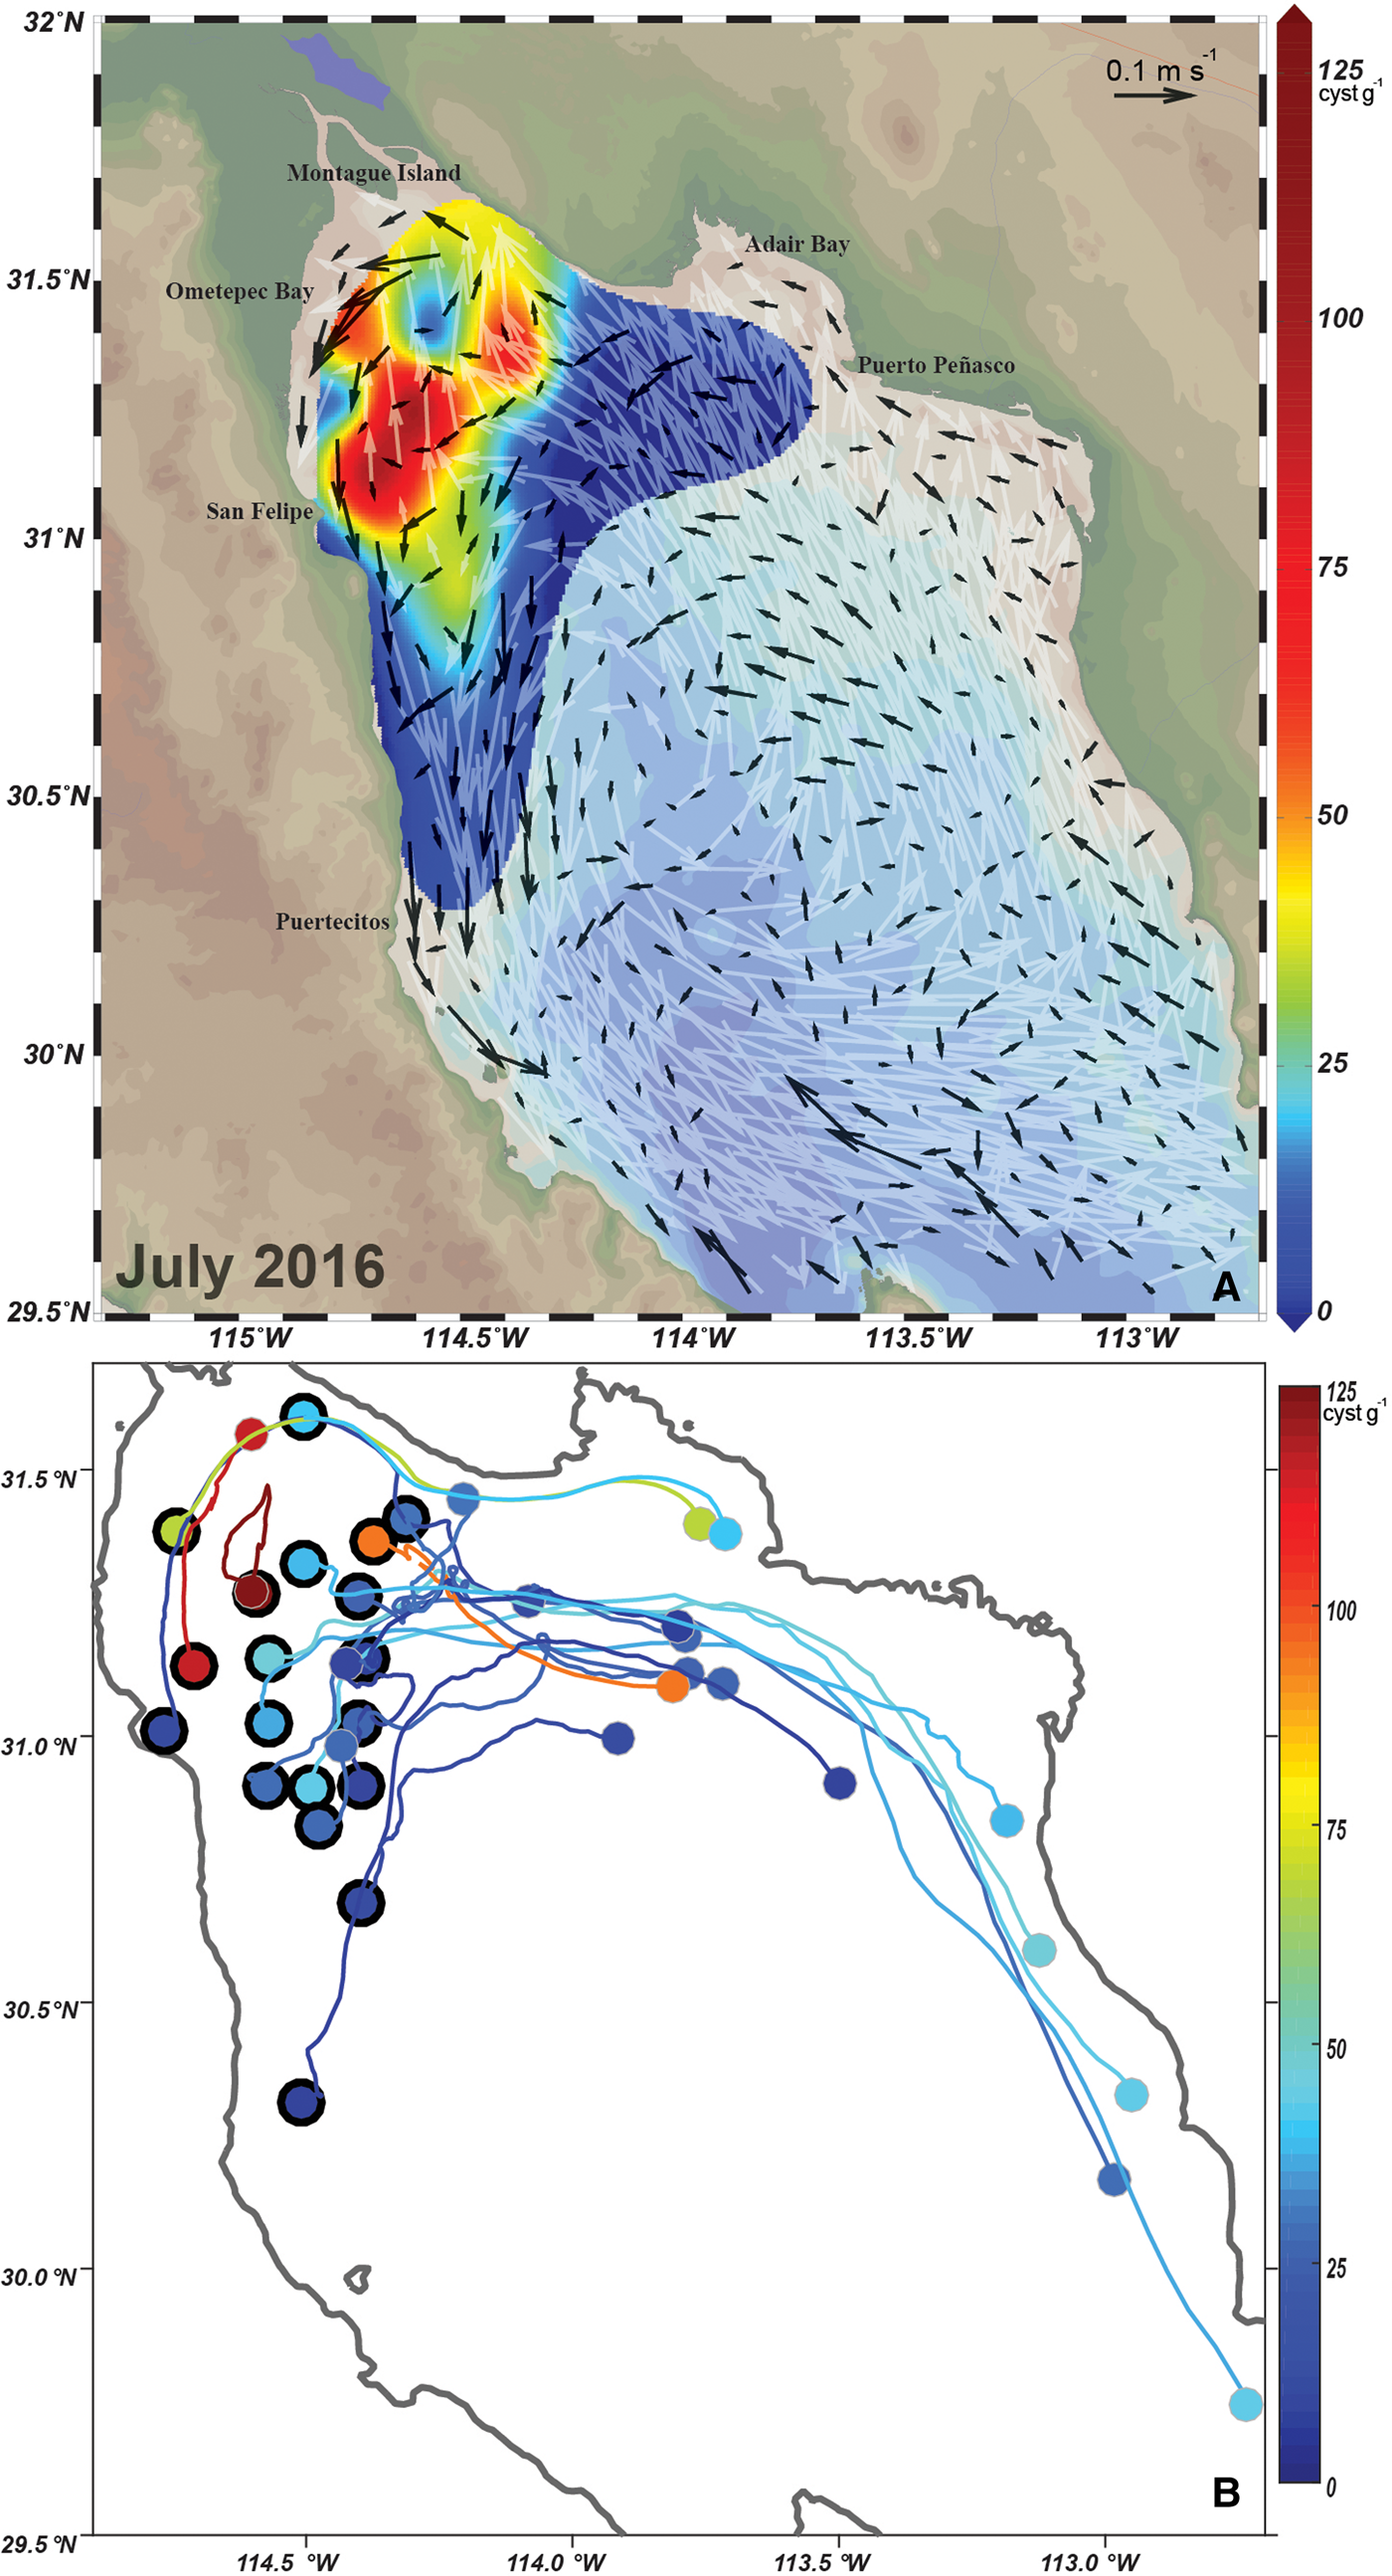
Fig. 8. (A) Vectors of monthly mean velocity at the surface (white vectors) and at 5 m above the bottom (black vectors), and G. catenatum distribution (colour) in July 2016; the maximum surface speed 0.54 m s−1. (B) Lagrangian 22-day trajectories, during 1–22 July 2016; large dots and black outline represent the final positions of the advected particles on 22 July; these final positions correspond to the observational points with non-zero cyst concentration indicated by the rainbow-coloured palette.
Particle tracking analysis indicates also that close to the bottom, hydrodynamics influenced sediment and cyst localization after being deposited by a HAB event in the nGC. At least, it is related to the localization of the seedbed during July 2016. In this period, particle surface movement was strongly influenced by the cyclonic circulation (Figure 8A). The origin of most of the 20 particles released in July 2016 was far south and outside of the surrounding area of the uGC (Figure 8B). The trajectories clearly follow surface circulation and do not correlate with the location of the seedbed. The particle-advection experiments for both periods (July 2016 and February 2017) confirm the effect of circulation on the distribution of G. catenatum cysts on the nGC.
Discussion
Gymnodinium catenatum cysts were present in recent sediments of the northern part of the Gulf of California. Cysts were heterogeneously distributed, and areas of high accumulation were detected. Seedbeds were dynamic since variation in cyst abundance and geographic distribution was evident during different seasons. Cysts of G. catenatum were highly represented in the sediments (as much as 27% of the total cysts) and presented a wide geographic distribution.
The representation of G. catenatum seems unusually high, since Pospelova et al. (Reference Pospelova, de Vernal and Pedersen2008) reported a relative abundance of 0.3% of this species in sediments collected close to the nGC. Also, the percentage found in the nGC seems atypical when compared with other regions (Table S5). Gymnodinium catenatum represented 3.1% of cyst assemblages from Concepcion Bay (Morquecho & Lechuga-Devéze, Reference Morquecho and Lechuga-Devéze2003), and 5.6% in Pescadero Basin (Duque-Herrera et al., Reference Duque-Herrera, Helenes, Flores-Trujillo, Ruiz-Fernández and Sánchez-Cabeza2020) within the GC. Cyst representation in the nGC is much higher than in the coasts of Korea (0.3–3%; Pospelova & Kim, Reference Pospelova and Kim2010; Shin et al., Reference Shin, Yoon, Kim and Matsuoka2011) and China (0.3–2.6%; Wang et al., Reference Wang, Matsuoka, Qi and Chen2004; Hwang et al., Reference Hwang, Kim, Lee and Kim2011; Liu et al., Reference Liu, Shi, Di, Sun, Wang, Dong and Shao2012), Swedish fjords (0.3%; Harland et al., Reference Harland, Nordberg and Filipsson2004), Baltic Sea (0.6%; Nehring, Reference Nehring1994), Tasmania (3.4%; Bolch & Hallegraeff, Reference Bolch and Hallegraeff1990) and Lisbon Bay (5%, Ribeiro & Amorim, Reference Ribeiro and Amorim2008). However, the percentage of G. catenatum cysts in the nGC is similar or lower than in other regions where recurrent HABs occur. Gymnodinium catenatum cysts along the Portuguese coast could represent ~24% of the cysts found in the sediments and can reach a representation as high as 71% (Amorim & Dale, Reference Amorim and Dale1998; Amorim et al., Reference Amorim, Dale, Godinho and Brotas2001). High concentrations are recorded after recurrent HABs events in different points of the Portuguese coast, being deposited from November to January and in mid-July (Amorim et al., Reference Amorim, Dale, Godinho and Brotas2001). In the coast of Galicia, specifically in Ria de Arousa, high concentrations of G. catenatum cysts have also been reported (Blanco, Reference Blanco1995). The high variability in the relative concentrations of cysts is probably related to the type of sampling and methodological approaches, but most importantly to the heterogeneous distribution and the presence of areas of high accumulation of G. catenatum cysts.
This is the only work where G. catenatum seedbeds are described in detail. In the areas with high accumulation of cysts the extension of seedbeds has not been characterized, nor the temporal variation of its abundance associated with the dynamics of these regions.
The seedbeds detected on February 2017 were related to a G. catenatum HAB that occurred during winter in the nGC. The presence of G. catenatum cysts related to recurrent HABs has been documented in other regions of the world but there is not a clear pattern between cyst concentration found in the sediment and vegetative cell abundance in the water column (Table S6). For example, the highest cyst abundance has been reported in the West Coast of the North Island in New Zealand after 2000 and 2001 HABs (MacKenzie, Reference MacKenzie2014). Maximum cyst concentration was 10,200 cysts cm−2 that was related to a maximum cell abundance of 27 × 103 cells l−1 detected in the surf zone (MacKenzie, Reference MacKenzie2014). In contrast, only 40 cysts g−1 were reported in sediments of Taiwan Strait when 1200 × 103 cells l−1 were present in the water column (Liu et al., Reference Liu, Gu, Krock, Luo and Zhang2020). A similar ratio between concentrations of cysts and vegetative cell abundances to the nGC has been reported offshore from Rías of Galicia, a maximum concentration of 263 cysts cm3 wet weight of surface sediments were related to a HAB event that occurred in 2005 with cell abundances that reached 634 × 103 cells l−1 (Figueroa et al., Reference Figueroa, Bravo, Ramilo, Pazos and Moroño2008).
The relationship between cyst abundance and vegetative cells will depend on environmental conditions, local strain physiology, circulation and hydrodynamic processes that affect sediment dynamics. The analysis of the development and dispersion of the 2017 bloom and the dynamics of the cysts between a non-HAB and a HAB year permit us to identify probable critical conditions for the appearance blooms in the region. In 2017, maximum cell abundances were registered in January and gradually decreased to the end of February. HABs in the nGC have a clear seasonality of appearance, G. catenatum is detected from November/December and disappears in April/May (Ramírez Castillo, 2020). Relatively low abundances (lower than 20 × 103 cells l−1) have been detected before 2015. From this time, HABs have been registered every year except for 2016 (Medina-Elizalde, Reference Medina-Elizalde2021).
Favourable temperatures for vegetative cell growth seem essential for the development of HABs in the nGC. Gymnodinium catenatum of the Gulf of California is considered as a warm ecotype (Band-Schmidt et al., Reference Band-Schmidt, Morquecho, Lechuga-Devéze and Anderson2004). Strains isolated in southern locations (Concepción Bay, La Paz Bay, Mazatlán Bay) grow in a wide temperature interval from 15–29 °C but have maximum growth rates between 21–29 °C (Band-Schmidt et al., Reference Band-Schmidt, Morquecho, Lechuga-Devéze and Anderson2004). Also, blooms in the south-east coast of the GC and in the tropical Pacific coast of Mexico occur in summer after upwelling events (Band-Schmidt et al., Reference Band-Schmidt, Morquecho, Lechuga-Devéze and Anderson2004, 2010; Morquecho & Lechuga, Reference Morquecho and Lechuga-Devéze2004; Gárate-Lizárraga et al., Reference Gárate-Lizárraga, Band-Schmidt, López-Cortés, Bustillos-Guzmán and Erler2007a). Blooms of G. catenatum in the nGC occur in winter when temperature drops below 17–18 °C and they are not registered in warmer months (Medina-Elizalde et al., Reference Medina-Elizalde, García-Mendoza, Turner, Sánchez-Bravo and Murillo Martínez2018; Ramírez Castillo, 2020; Medina-Elizalde, Reference Medina-Elizalde2021). This species proliferated at temperatures as low as 13–14 °C (Ramírez Castillo, 2020). Therefore, G. catenatum of this region can be characterized as a cold ecotype since it presents similar temperature preferences as the ones reported in Tasmania (Blackburn et al., Reference Blackburn, Hallegraeff and Bolch1989; Hallegraeff et al., Reference Hallegraeff, McCausland and Brown1995).
The proliferation of this species probably does not depend on a pulsed input of nutrients associated with upwellings. We did not measure the concentration of nutrients, but it is well known that nutrient concentrations are high in the nGC. Mixing by tidal currents and winds, sediment re-suspension, remineralization in the wetlands from the Colorado River delta maintain a constant high macronutrient concentration in this region (Millán-Núñez et al., Reference Millán-Núñez, Santamaría del Ángel, Cajal-Medrano and Barocio-León1999; Orozco et al., Reference Orozco-Durán, Daesslé, Camacho-Ibar, Ortiz-Campos and Barth2015; Ramírez-León et al., Reference Ramírez-León, Álvarez-Borrego, Turrent Thompson, Gaxiola Castro and Heckel Dziendzielewski2015).
Another key observation that HABs do not depend on pulsed inputs of nutrient is that the high phytoplankton biomass accumulation initiated in the west coast and dispersed westward and northward covering almost the entire region ~1 month after its initiation. This dispersion pattern seems consistent every year since the times of implementation of sanitary bans (closure of extraction areas of bivalves) follow the same pattern (Medina-Elizalde, Reference Medina-Elizalde2021). Usually, P. globosa extraction areas south from San Felipe are the first to be closed during winter (Medina-Elizalde, Reference Medina-Elizalde2021). There are no punctual sources of organic matter and terrigenous nutrients (there are no river discharges) in this area and upwelling occurs in the continental side of the Gulf of California when winds have a southward direction (Brusca et al., Reference Brusca, Álvarez-Borrego, Hastings and Findley2017).
We propose that resuspension of cysts, particularly on the west coast, must be another critical process for HAB development in the nGC. Assuming that the deposition of seedbeds in 2015 was similar to that of February 2017, then localization of seedbeds in July 2016 represents the result of long-term hydrodynamic processes that maintain cysts in the nGC for a period of at least 2 years. Cysts seem to be transported in an eastward direction after deposition and accumulated in an extensive area north of San Felipe that is probably the seedbed responsible for the initiation of HABs in the region.
Cyst distribution in the nGC seems to be a combination of vertical and horizontal advection that also affects sediment transport. The effect of strong semidiurnal tidal currents causes resuspension which is present continuously in the region, mean monthly velocities and their difference between surface and close to the bottom are likely to be responsible for cyst re-distribution. Localization of seedbeds during February 2017 reflects short-term processes between deposition and redistribution of the cyst in sediments. The deposition of cysts was related to the evolution of the HAB after its initiation on the west coast and mild current conditions cause deposition of cysts produced during the HAB. This was confirmed by the particle advection analysis. In contrast, particles were on the continental side of the GC. Then predominant circulation associated with the anticyclonic gyre seems to disperse vegetative cells from the west to the east coast of the nGC coinciding with areas of the predominance of fine sands. Cysts present in front of San Felipe (west coast) originated originated from the centre of the uGC and the seedbed detected in Adair Bay is likely the result of transportation of cells and cyst deposition related to convergence of strong surface currents present during winter in the area. After deposition, circulation and tidal processes could reduce the concentration of cysts in the original deposition areas, and they could be relocated into other zones.
An autochthonous origin of HABs seems to be the scenario that prevails in the nGC. We demonstrated that the nGC is a retention area of cysts (and sediments) that permit the formation of seedbeds that could be important for G. catenatum HAB development. Particularly, the uGC is an area of high particle retention and low reception of particles from other areas (Marinone, Reference Marinone2012) and it has been calculated that particles can travel about 400 km before leaving the area after 30 days (Marinone et al., Reference Marinone, Lavín and Parés-Sierra2011).
An autochthonous origin of HABs is shared with Tasmania (Hallegraeff et al., Reference Hallegraeff, Blackburn, Doblin and Bolch2012) and Concepcion Bay, Baja California Sur (Morquecho & Lechuga-Devéze, Reference Morquecho and Lechuga-Devéze2003, 2004). However, as mentioned previously cyst concentration cannot be related to the magnitude of G. catenatum HABs even in these conditions. In contrast, it has been recognized that A. catenella cyst concentration in seedbeds seems to determine the intensity of the blooms in the Gulf of Maine (Anderson et al., Reference Anderson, Keafer, Kleindinst, McGillicuddy, Martin, Norton, Pilskaln, Smith, Sherwood and Butman2014). Cyst distribution, sediment transport and bloom dynamics of A. catenella have been extensively studied and it is recognized that resuspension is main cause of the redistribution of cysts in the Gulf of Maine. Approximately 1 mm of sediment is resuspended and could be transported laterally, modifying the spatial distribution of the cysts, and they would have better access to light, which favours germination and growth (Anderson et al., Reference Anderson, Keafer, Kleindinst, McGillicuddy, Martin, Norton, Pilskaln, Smith, Sherwood and Butman2014; Aretxabaleta et al., Reference Aretxabaleta, Butman, Signell, Dalyander, Sherwood, Sheremet and McGillicuddy2014; Butman et al., Reference Butman, Aretxabaleta, Dickhudt, Dalyander, Sherwood, Anderson, Keafer and Signell2014). This must occur close to the coast where the semidiurnal tides and costal currents intensify (Butman et al., Reference Butman, Aretxabaleta, Dickhudt, Dalyander, Sherwood, Anderson, Keafer and Signell2014). The same process may be present in the nGC where the suspended cysts form biogenic conglomerates in the water column together with terrigenous particles of the same size range and are transported to relatively shallow areas. There, the cysts remain until they are resuspended by changes in the direction and intensity of the currents. This occurs during the autumn–winter transition (Montes et al., Reference Montes, Lavín and Parés-Sierra2016).
However, physiological differences must be considered when comparing the process of HAB development between G. catenatum and A. catenella. Resting cyst production rate of G. catenatum is between 10–40% of total vegetative cells, and cysts have a dormancy period of 1–2 weeks (Blackburn et al., Reference Blackburn, Hallegraeff and Bolch1989). In contrast, cyst generation for A. catenella could be as high as 100% of vegetative cells and they present a dormancy period of 1–6 months (Figueroa & Bravo, Reference Figueroa and Bravo2005). Therefore, the concentrations of A. catenella cysts in the sediment are much higher than the ones reported for G. catenatum. HABs of A. catenella probably depend on a large inoculum of vegetative cells associated with cyst germination while G. catenatum proliferation probably relies more on vegetative growth after cyst germination.
The role of seedbeds on G. catenatum HABs and its importance in HAB development still is an open field of investigation. Most of the studies report concentrations from limited sampling points. This is the only work that describes the presence of extensive defined areas of high accumulation of cysts of this species. Having the opportunity to compare the concentration and spatial distribution of cysts between a HAB and a non-HAB year permitted us to investigate the dynamic nature of seedbeds and the behaviour of cysts as sedimentary particles in the nGC. The redistribution and retention of these particles in the zone must be crucial for HAB formation in the nGC.
Supplementary material
The supplementary material for this article can be found at https://doi.org/10.1017/S0025315421000795
Acknowledgements
We thank Oc. Edna Collins for the support in palynological analysis. We also thank CONACYT for financial support of the PhD scholarship 24805 – CV617226.
Financial support
This work was funded by CONACYT scholarship 24805 – CV617226; FORDECYT – CONACYT project number 260040-2015. D. Rivas was supported by CICESE through the internal project 625118. The GODAS and NARR products were provided by the National Oceanic and Atmospheric Administration (NOAA) – Earth System Research Laboratory (ESRL) Physical Science Division (PSD) through its website: http://www.esrl.noaa.gov/psd/data/gridded/. The altimeter product was provided by the Archiving, Validation, and Interpretation of Satellite Oceanographic data (AVISO) through its website (https://www.aviso.altimetry.fr). The satellite SST imagery was available at the National Aeronautics and Space Administration (NASA) OceanColor Web: http://oceancolor.gsfc.nasa.gov.


