INTRODUCTION
Randomized clinical trials (RCT) aimed to improve outcomes in patients with severe traumatic brain injuries (sTBI) have failed to demonstrate treatment efficacy, despite promising pre-clinical data (Robertson et al., Reference Robertson, Hannay, Yamal, Shankar, Goodman and Tilley2014; Vanderploeg et al., Reference Vanderploeg, Schwab, Walker, Fraser, Sigford and Date2008; Wright et al., Reference Wright, Yeatts, Silbergleit, Palesch, Hertzberg and Frankel2014; Zhao et al., Reference Zhao, Ding, Want, Gan, You and Yang2016). Recently, Robertson et al. (Reference Robertson, Hannay, Yamal, Shankar, Goodman and Tilley2014) reported on the results of a double blind randomized clinical trial (RCT) for the acute treatment of serious closed head injury, referred to as the Erythropoietin (Epo) Severe TBI trial. Using a factorial design, acute treatment with Epo did not improve primary outcome of neurological recovery at 6 months post-injury, nor did the maintenance of hemoglobin concentration at ≥10 g/dL Versus ≥7 g/dL with transfusions. Failures to demonstrate efficacy in these trials could indicate weak treatment effects, but can also stem from study design features, such as the choice and timing of outcome measures and data analytic methods (Menon & Maas, Reference Menon and Maas2015).
Interpatient differences in their recovery over time are often clinically important yet not captured in comparisons made at a single time point (Bryk & Raudenbush, Reference Bryk and Raudenbush1987; Francis, Fletcher, Stuebing, Davidson, & Thompson, Reference Francis, Fletcher, Stuebing, Davidson and Thompson1991). Differences that exist between individuals at a fixed time point provide a limited view of the recovery process, say little to nothing about how an individual arrived at that point, and may not generalize to future time points. Most importantly, individuals with the same score at a given time point may differ greatly in their recovery process, having arrived at the same score at a given time in very different ways. For example, one individual’s recovery may have stabilized at the current level several weeks ago, whereas another individual continues to improve and will not stabilize for some weeks. Furthermore, characteristics of individual patients, such as injury severity, may influence individual recovery trajectories by accounting for individual differences in the parameters of the curves (Ewing-Cobbs et al., Reference Ewing-Cobbs, Barnes, Fletcher, Levin, Swank and Song2004; Francis et al., Reference Francis, Fletcher, Stuebing, Davidson and Thompson1991; McCauley, Hannay, & Swank, Reference McCauley, Hannay and Swank2001; Thompson et al., Reference Thompson, Francis, Stuebing, Fletcher, Ewing-Cobbs, Miner and Eisenberg1994). Considering the shape of individuals’ recovery curves, known to provide the means for predicting long-term functional outcomes and cognitive status (Fleming & Maas, Reference Fleming and Maas1994), may better capture the dynamic nature of recovery and inform future clinical trials.
In this secondary analysis of the Epo Severe TBI trial, we re-evaluate treatment efficacy applying longitudinal analytics to capture interindividual differences in recovery from sTBI using the outcome measure Disability Rating Scale (DRS) obtained weekly for weeks 1–4, at discharge from the Level 1 trauma center’s primary care hospital, and at 3 and 6 months post-injury and also consider effects of TBI severity on recovery and treatment efficacy. This approach might reveal clinically relevant benefits of treatment that were lost by focusing on only 6-month outcomes, such as patient subgroups that recovered faster due to treatment. We hypothesize that Epo-treated patients will generally improve earlier than the Placebo group and that those maintained at a hemoglobin concentration of 10 g/dL will have better improvement in neurological outcomes beyond the acute phase than those maintained at the 7 g/dL threshold, when adjusting for baseline injury severity over time.
METHODS
Sample/Study Design
This research was completed in accordance with the Helsinki Declaration. The significance, design, and primary analytical procedures of the Epo Severe TBI clinical trial are reported in Robertson, et al., Reference Robertson, Hannay, Yamal, Shankar, Goodman and Tilley2014. Briefly, 200 individuals ≥15 years of age with a closed head injury admitted to two Level 1 trauma centers were recruited for participation if unable to follow commands post resuscitation and could be enrolled within 6 hr of injury. Patients could not meet any of the following exclusionary criteria: (1) a Glasgow Coma Scale (GCS) score of 3 and fixed dilated pupils, (2) penetrating head injury, (3) life-threatening systemic injuries, (4) pregnancy, (5) severe polytrauma, and (6) spinal cord injury. Enrolled participants were randomly assigned to administration of Epo or placebo and to hemoglobin transfusion thresholds of 7 or 10 g/dL in a 2×2 factorial design (Table 1). Further details regarding the demographics and injury characteristics of this study population have been described in Robertson et al. (Reference Robertson, Hannay, Yamal, Shankar, Goodman and Tilley2014).
Table 1 Study design and sample size of Epo RCT

This study used a 2×2 factorial design, so patients were included in one of the four combinations of Epo and TT. The primary paper found no significant interaction between the two variables, Epo and TT; thus, results were reported separately. The original treatment regimen consisted of one treatment Epo dose or one placebo. For the first 74 patients, the initial dosage regimen was one dose given within 6 hr of injury followed by two additional doses given every 24 hr; and for the erythropoietin 2 regimen, in 2009, the initial dosage regimen was changed per FDA for the subsequent 126 patients to one dose given within 6 hr of injury. Primary results were reported as three randomization groups (Epo1/38, Epo2/64, Placebo/98) (Robertson et al, Reference Robertson, Hannay, Yamal, Shankar, Goodman and Tilley2014).
Outcome Measure
The primary outcome for the current study was the DRS (Rappaport et al., Reference Rappaport, Hall, Hopkins, Belleza and Cope1982), developed to measure functional change in recovery among moderate to sTBI patients. The DRS has been validated and frequently used in TBI research (Giacino et al., Reference Giacino, Whyte, Bagiella, Kalmar, Childs, Khademi and Sherer2012; Gouvier, Blanton, LaPorte, & Nepomuceno, Reference Gouvier, Blanton, LaPorte and Nepomuceno1987; Hall, Bushnik, Lakisic-Kazazic, Wright, & Cantagallo, Reference Hall, Bushnik, Lakisic-Kazazic, Wright and Cantagallo2001; Hall, Cope, & Rappaport, Reference Hall, Cope and Rappaport1985; McCauley et al., Reference McCauley, Hannay and Swank2001; Rappaport, Hopkins, Hall, & Belleza, Reference Rappaport, Hopkins, Hall and Belleza1981, Robertson et al., Reference Robertson, Hannay, Yamal, Shankar, Goodman and Tilley2014; Struchen, Hannay, Contant, & Robertson, Reference Struchen, Hannay, Contant and Robertson2001; Vanderploeg et al., Reference Vanderploeg, Schwab, Walker, Fraser, Sigford and Date2008; Wright et al., Reference Wright, Yeatts, Silbergleit, Palesch, Hertzberg and Frankel2014). Given the range of values for severe disability (7–21) and for vegetative state (22–29), the DRS has the potential to serve as a measure of recovery over time in patients with sTBI (Hall et al., Reference Hall, Cope and Rappaport1985). DRS scores range from 0 to 29, with 29 indicating extreme vegetative state and 0 indicating no disability. Although the original DRS reports a maximum score of 29, several authors have extended the scale to 30 to indicate death (Hall et al., Reference Hall, Mann, High, Wright, Kreutzer and Wood1996; Struchen et al., Reference Struchen, Hannay, Contant and Robertson2001). We chose this version of the scale for greater analytic consistency with our RCT study (Robertson et al., Reference Robertson, Hannay, Yamal, Shankar, Goodman and Tilley2014). DRS measurements were collected by trained neuropsychological research staff at weeks 1–4, months 3 and 6, and at discharge from the Level 1 trauma center’s primary care hospital. Data were obtained in person or via telephone by neuropsychology personnel and/or HJH from the patient, next-of-kin, significant others and/or caretakers, and medical personnel. If necessary, information was obtained from records of facilities and practices upon appropriate signed release. All neuropsychology personnel collecting outcome data except the clinical neuropsychologist (H.J.H.) were fully bilingual in English and Spanish due to the large proportion of Spanish-speaking individuals among the TBI population for this study region.
TBI Severity Substrata
For this study, we constructed a severity measure of TBI based on the IMPACT prognostic score (International Mission for Prognosis and Analysis of Clinical Trials in traumatic brain injury) (Steyerberg et al., Reference Steyerberg, Mushkudiani, Perel, Butcher, Lu, McHugh and Maas2008). The IMPACT score is based on an estimate of the predicted odds of a poor outcome (Steyerberg et al., Reference Steyerberg, Mushkudiani, Perel, Butcher, Lu, McHugh and Maas2008), where the prediction is based on baseline injury and demographic information. Specifically, baseline predictors include age in years, enrollment GCS motor score, pupillary reactivity, computerized tomographic Marshall CT classification (Marshall et al., Reference Marshall, Marshall, Klauber, Van Berkum, Eisenberg, Jane and Foulkes1992), occurrence of prehospital hypoxia or hypotension, presence of traumatic subarachnoid blood, presence of an epidural hematoma, and admission lab characteristics (glucose and hemoglobin levels). This score, which expresses the expected odds of a poor outcome based on admission injury characteristics, is then grouped into tertiles for inclusion in the analysis of DRS outcomes. The use of tertiles allows flexibility in the assumptions of the response function over time and makes no assumption of the distributional shape of the regression function with respect to the IMPACT probability score. Although grouped on tertiles, the resultant thresholds corresponded substantially with meaningful differences in the risk of poor outcome. The lowest tertile (≤.23) was ~1 to 3 times less likely to have poor outcome (least severely injured, least sTBI), the second tertile (.23 to .51) range group had no worse than equal odds of poor outcome (intermediate sTBI); and the highest tertile had a probability of at least .51 of poor outcome (most sTBI).
Statistical Analyses
All analyses were conducted using SAS 9.4 (SAS Institute Inc., Cary, NC). DRS scores were analyzed as a continuous variable and patient data were analyzed on an intent-to-treat (ITT) basis. Patients with ≥1 DRS measurement recorded and with baseline information to generate an Injury Severity Score (ISS) were included in this analysis. Because a DRS score was collected at discharge from Level 1 trauma center’s primary care hospital, we allowed a person-specific DRS (floating) time point. Median day of discharge from primary care was 25 days post-injury (25th percentile: 15 days; 75th percentile: 40 days). If the day of discharge occurred on the same day as a scheduled outcome recording, the duplicate score was omitted from the analysis.
Mixed effects linear modeling, also referred to as growth modeling (Laird & Ware, Reference Laird and Ware1982), was used to analyze patients’ individual recovery trajectories to account for correlation of repeated measurements within subjects over unequal intervals of time, possible heterogeneity in variances between groups, and lack of balance in the repeated measures and between subjects elements of the data. A major advantage of this approach is that each individual contributes to the estimation of the fixed and random effects in the model, and in particular to the effect of treatment, regardless of how many time points they contributed. Each individual’s fitted trajectory is a weighted average of their personal trajectory based exclusively on their data and the expected trajectory for individuals like them based on their standing on all predictors included in the model. The weighting is a function of the precision of the individual and group-based estimates; for patients with more data, the weighting favors the trajectory based on their observed data, whereas for patients with fewer observed DRS scores, their trajectory is shifted toward the expected trajectory for individuals like them as reflected by the predictors in the model. An extensive description of our final model fitting and specification can be found in Supplementary Materials S.1 and S.2, and includes comparisons of alternative fixed and random polynomial change trajectories and assessment of interaction effects. Note that, as was done in the primary report, main effects of Epo and hemoglobin transfusion thresholds treatments were estimated in the absence of an interaction. Akaike information criterion and deviance statistics were used for model comparisons.
Epo randomization groups [Epo Versus Placebo; Hemoglobin transfusion threshold (TT) 10 g/dL Versus 7 g/dL] were the primary effects of interest. Control variables for the current study were selected a priori adhering to pre-specified covariates that had been used in the final outcomes article for the Epo sTBI clinical trial and included in the computation of the ISS and IMPACT prognostic scores.
RESULTS
Data from a total of 193 (97%) participants were analyzed. Of a total of 7 possible scheduled follow-up points, the number of DRS measurements during the 6-month follow-up period varied from 2 to 7, with a median of 7. Patients not included in this analysis either withdrew from the study (n=3), were lost to follow up (n=2) before completing any assessments, or were missing all DRS outcome measures (n=2).
Descriptively, median DRS scores decreased at each time point for Epo and TT treatment groups, with more notable drops at months 3 and 6 (Table 2). The median score for each group improved by at least 16 points between week 1 and month 6 of follow-up.
Table 2 Summary of DRS scores at weeks 1–4, month 3 and 6 by Epo and TT randomization groups among individuals with sTBI

Median (25th, 75th): Median and 25th and 75th percentiles.
At each time point, the median DRS score was consistently worst for those patients with the most sTBI (IMPACT tertile 3), followed by those with intermediate sTBI (IMPACT tertile 2), and those with the least sTBI (IMPACT tertile 1) (Table 3). The magnitude of the difference between injury severity groups tended to vary over time with the largest difference observed at week 4 between those with intermediate sTBI and those with the most sTBI. Between the intermediate and least sTBI groups (tertiles 1 and 2), the magnitude of the difference in DRS scores increased from week 1 until week 4 and decreased in the long term (months 3 and 6).
Table 3 DRS (Median and 25th, 75th percentiles) scores by injury severity probability of poor outcome to indicate most, intermediate, and least sTBI a

a Discharge from Level 1 trauma center’s primary care hospital represents a variable time point.
We examined mortality across factors of interest as a potential bias that could affect our estimates. Information on survival, including Kaplan-Meier curves and mortality rates for the transfusion threshold groups and Epo dosing regimen groups can be found in Robertson, et al (Reference Robertson, Hannay, Yamal, Shankar, Goodman and Tilley2014). Briefly, six patients in the erythropoietin 1 regimen group, 7 in the erythropoietin 2 regimen group, and 18 in the placebo group died during the 6 months of follow-up with no significant differences in mortality. Fourteen patients died during the 6 months of follow-up with the transfusion threshold of 7 g/dL and 17 with the threshold of 10 g/dL, again no difference in mortality between groups. Among injury severity groups, 22 individuals with the most sTBI, 6 patients with intermediate sTBI, and 3 patients with the least sTBI died during the 6 months of follow-up (see Figure 2) (p<.0001).
Longitudinal Model Results
The final model included baseline covariates as predictors of the random intercept, RCT randomization groups and TBI severity groups as predictors of the random intercept and time slope, and the interaction of Epo*TBI severity level as a predictor of both the random intercept and time slope. A more complete description and presentation of the model selection process and results can be found in Supplementary Materials S.2 and Supplementary Table S2. Maximum likelihood estimates can be found in Supplementary Table S1.
Observed trajectories of the DRS over time are presented in Figure 1 and display the curvilinear pattern of recovery as well as the heterogeneity in the recovery process across patients. Observed trajectories of the DRS are presented by randomization groups and TBI severity in Supplementary Materials S.3 Figures S1–S3.
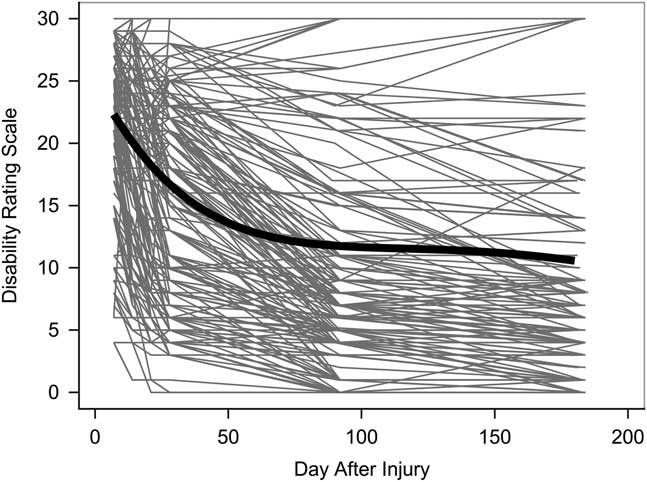
Fig. 1 Individual trajectories of DRS scores across patients in the Epo randomization trial (n=193). The thick black line indicates the average change trajectory for the entire sample.
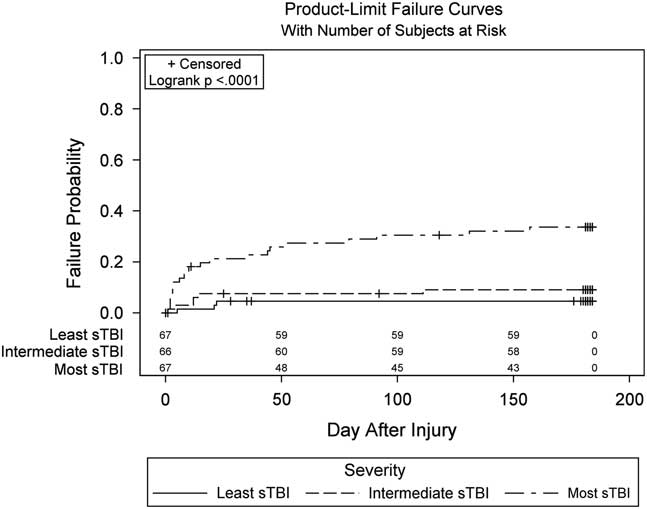
Fig. 2 Inverted Kaplan-Meier curves of mortality rates by injury severity group. The count at each time point (e.g., 67, 66, 67) represents the number of patients at-risk of mortality at that time point.
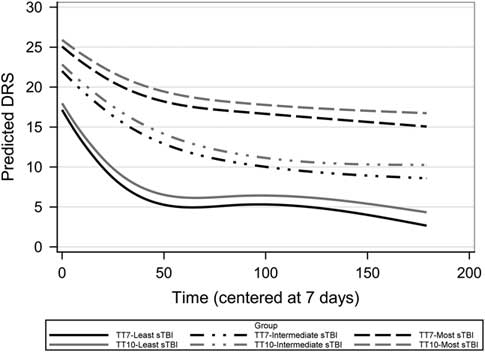
Presentation of the results here focuses on differences in the estimated recovery trajectories for the Epo and transfusion threshold randomization group broken down by TBI severity groups (Figures 3, 4). The figures depict conditional growth models controlling for the abbreviated injury score measured at baseline as a predictor of the random intercept. The recovery trajectories allow us to estimate the effect sizes for the treatments at different points in the recovery process (i.e., at specific time points of interest). The estimated least squares means and 95% confidence intervals (CIs) for 6-month follow-up (6 month) are referenced throughout the text and presented in Table 4. We present the results from the final model separately for Epo and TT.

Fig. 3 Estimated recovery curves of DRS scores by Epo randomization group and sTBI group, among individuals from the Epo randomization trial. This figure represents the DRS cubic change based on the growth curve parameter estimates (Supplementary Table S1). Time is measured in days after injury.

Fig. 4 Estimated recovery curves of DRS scores by TT randomization group and TBI injury severity groups from the Epo randomization trial. This figure represents the DRS score cubic change based on the growth curve parameter estimates (Supplementary Table S1). Time is measured in days after injury.
Table 4 Estimated least square means at 6 months using model estimates (supplement to recovery curve figures)

Note. Estimated least square means at 6 months with 95% CIs.
Epo
The effects of Epo on the DRS depend on injury severity and the time at which the DRS is measured. This inference is based on the three-way interactions of Epo, TBI Severity, and the specific growth parameters that capture the effect of time [Type III fixed effects: TBI Severity*Epo {*Time (p=.0002), *Time 2 (p=.0016), *Time 3 (p=.0028)}]. Rather than attempt to interpret the individual model parameters, it is more straight-forward to examine the model estimated least squares means for the nine individual groups formed by crossing treatment (Epo1, Epo2, and Placebo) with injury severity (most sTBI, intermediate sTBI, and least sTBI). Figure 3 presents the estimated DRS curves, and Table 4 provides estimated DRS scores at 6 months for each of the nine groups. The estimates in Table 4 show that the most sTBI patients randomized to Placebo had the worst outcomes at 6 months (Placebo: Estimated Mean DRS at 6 months =18.3; CI [13.9, 22.7]) and that those randomized to Epo1 had better outcomes (Estimated Mean DRS at 6 months= 12.4; CI [5.4, 19.5]), which is comparable to the outcomes for similar patients randomized to the Epo2 regimen (Estimated Mean DRS at 6 months=14.4; CI [8.7, 20.1]). Among the patients with the least sTBI, the Epo1 group showed the greatest improvement during the first 4 weeks and had the best 6-month outcomes (Estimated Mean DRS at 6 months=0; CI [0, 3.8]). Outcomes for the placebo (Estimated Mean DRS at 6 months=3.1; CI [0.2, 6.0]) and Epo2 (Estimated Mean DRS at 6 months=2.4; CI [0, 6.5]) regimens were similar in the patients with the least sTBI, with no notable difference in DRS during the first 4 weeks nor in the final endpoint. Among those with intermediate sTBI, the Epo1 group tended to have consistently higher DRS scores, which was reflected in their outcomes at 6 months (Estimated Mean DRS at 6 months=13.8; CI [7.7, 19.9]) in comparison to the other treatment groups with similar injury severity (Estimated Mean DRS at 6 months: Placebo=6.3; CI [2.5, 10.1]; Epo2=7.8; CI [3.6, 11.9]).
In a follow-up analysis of the interaction found between Epo and injury severity group, we estimated the simple effects of Epo within injury severity subgroups. These effects were estimated in separate analyses for each injury severity group as well as in a comprehensive model that included all injury severity groups. The latter is more powerful to investigate interactions, but assumes homogeneity across severity groups. In both approaches, we detected a statistical interaction of Epo randomization group by time components among the patient group with intermediate sTBI (results not presented in the interest of space). No effects of Epo*TIME were detected within the groups with the most nor the least sTBI.
Transfusion Threshold
Figure 4 displays the average estimated trajectories broken down by injury severity and transfusion threshold groups. Although not significant, those in the hemoglobin TT7 group showed slightly better DRS outcomes at 6 months regardless of injury severity (Estimated Mean DRS at 6 months: TT7=7.7; CI [5.5, 10.0], TT10=9.57; CI [7.3, 11.6]).
DISCUSSION
The current study proposed to re-evaluate the efficacy of treatments in the Epo Severe TBI trial using longitudinal analytics to capture interindividual differences in recovery from sTBI. These models provide a more accurate characterization of the nonlinear temporal trend in the data, missed with single endpoint analyses, and provide important clinical implications.
Our study demonstrated that TBI severity was found to interact with treatment and, therefore, the effects of Epo treatment must be interpreted on the basis of the interaction. In the longitudinal reanalysis of the Epo trial, among individuals with the least severe TBI and those with the most sTBI, the Epo1 group showed a trend toward the most improvement relative to Epo 2 and Placebo. In contrast, Epo 1 had the least effect on outcomes among those with an intermediate sTBI. To assess the sensitivity of our result, an additional analysis using injury type (diffuse vs. non-diffuse injury) as a clinical indicator of injury severity was conducted, but we were unable to confirm findings from our analysis. Although diffuse injury status plays a large role in recovery and disability (Englander, Cifu, Wright, & Black, Reference Englander, Cifu, Wright and Black2003), injury severity based on the baseline IMPACT score provides additional information that may help explain individual differences among patients in recovery from sTBI. Additionally, in examining mortality across Epo and injury severity as a potentially biasing factor that could affect our estimates, the rate and cause of death appeared to vary by treatment group among those with an intermediate sTBI (Epo1: 50%; Epo2: 16.7%; Placebo: 33.3%), whereas rates were more comparable for Epo1 and Epo2 in other groups. Thus, we cannot rule out the contribution of differential mortality to the Epo treatment differences in the intermediate sTBI patients at this time.
Potentially, it is worth a future study to understand the recovery process for varying levels of injury severity among patients with sTBI, particularly targeting those with an intermediate sTBI. Those with the least sTBI tended to recover to the point of having a partial level of disability (DRS=2.5) and those with the most sTBI tended to recover to having a moderately severe to severe disability (DRS=12.5) on average. Clinically, these improvements are important to the everyday lives of patients with sTBI and any caretakers who are involved.
In the longitudinal reanalysis of transfusion threshold randomization groups, results from this study indicate that the TT10 group tended to have poorer recovery across all time points and across injury severity, suggesting a trend toward better improvement in those with a sTBI using a less conservative transfusion threshold. However, transfusion threshold did not impact the trajectory of recovery statistically over and beyond the other factors in our statistical model. Importantly though, effect sizes for varying time points (using the information across all time points) in addition to the primary endpoint can be obtained from this study to aid in design of future research studying the maintenance of transfusion threshold levels.
Additionally, the estimated recovery plots from this study show clearly not only the temporal trends of interventions on recovery from sTBI but also provide insight into the treatment differences over time that could not be visible in a single endpoint trial. Although single endpoint analysis accurately estimates the effects of treatment on outcomes at that specific time point, they fail to provide information on the timing of the recovery process that would help to inform future trials. For example, recovery with Epo 1 treatment among the least-severely injured group improved rapidly during the first 3 months and continued to show improvement to mild disability by the 6 months. In contrast, among the most-severely injured groups, the recovery process was much slower and the Epo treatment groups appeared not to have reached their recovery plateau by 6 months, whereas the placebo group did seem to have reached its plateau by 6 months. Clinically, our results indicate that a 6-month time point may be suitable to evaluate some patients, but that longer follow-up might be needed to assess treatment effects on recovery outcome status.
In contrast to studies of TBI patients with baseline evaluated at rehabilitation admission that occurs at varying time points after injury, follow-up of the patients in this study began within 6 hr of their injury. This is a notable feature, given the known inherent variability among patients before their injury as well as in the recovery process that complicate the study of long-term outcomes in sTBI (Chua, Ng, Yap, & Bok, Reference Chua, Ng, Yap and Bok2007; Janowitz & Menon, Reference Janowitz and Menon2010; Lingsma, Roozenbeek, Steyerberg, Murray, & Maas, Reference Lingsma, Roozenbeek, Steyerberg, Murray and Maas2010; Roozenbeek, Lingsma, & Maas, Reference Roozenbeek, Lingsma and Maas2012).
Other important features of this study were the design of the Epo trial as well as the analytical method used to capture the complex data structure of the 6-month longitudinal process for those who had a severe TBI, using information collected at the acute phase and outcome measures up to 6 months. A cubic polynomial model was fit to this data structure to model the changing rate of deceleration over time and the slowing recovery to a plateau. The cubic polynomial is able to approximate asymptotic growth (or decay), which makes it desirable to describe the recovery process, such as in this case (Burchinal & Appelbaum, Reference Burchinal and Appelbaum1991). With regard to data collection, we were quite successful in collecting meaningful DRS scores for the early weeks (1–4) of recovery as well as at discharge from primary care, and 3 and 6 months post-injury. These additional data add to our understanding of how sTBI patients recover in the early stages and afterward. With regard to handling attrition, in the Epo final outcome report with the primary analysis of the 6-month endpoint only, patients lost to follow-up were either excluded or multiple imputation on the primary endpoint was performed. Both have their disadvantages. Using maximum likelihood estimation under a random effects model framework, however, some information on 97% of the study sample was included in the current study in lieu of 89% based on data available at the 6 months endpoint. Even with sufficient covariates to control for the heterogeneity at baseline when analyzing only the 6 month endpoint, which was done in Robertson et al. (Reference Robertson, Hannay, Yamal, Shankar, Goodman and Tilley2014), the heterogeneity in the recovery process across individuals is ignored. This study included information to control heterogeneity of the entire recovery time course using acute information on severity of injury to analyze recovery in patients with severe TBI.
Finally, previous studies may have used measures such as the GCS scores and Marshall CT scan classification as indicators of injury severity and prognostic factor (Davis & Cunningham, Reference Davis and Cunningham1984; Perel, Edwards, Wentz, & Roberts, Reference Perel, Edwards, Wentz and Roberts2006). Injury severity for this study was defined based on the IMPACT probability risk of poor outcomes, which is considered to be an optimal indicator of injury severity (Lingsma et al., Reference Lingsma, Roozenbeek, Steyerberg, Murray and Maas2010).
LIMITATIONS
Although a sample size of n=200 with six measurements on average per individual is favorable for this type of well-designed trial, the sample size for the number of combinations of treatments and injury groups is relatively small given the amount of suspected uncontrolled heterogeneity in recovery within each group. Thus, our findings should be interpreted with caution.
While the DRS is sensitive to change in recovery, it was designed to evaluate patients with sTBI, which is the initial status of the majority of our patient population. For assignment into disability categories, the DRS has an 8 score range for the vegetative state, a 15 score range for the moderately severe to extremely severe, but only a 6 score range for typifying recovery through moderate to a mild level of disability {i.e., Moderate (DRS score: 4–6); Partial (DRS score: 2–3); Mild (DRS score: 1)}. In our study, a patient had improved from vegetative state (on life support) at 1 week post sTBI to mild disability by 6 months. This patient, while independently living with a roommate, had reduced hours at a pre-injury job and likely had unresolved behavioral, cognitive, and emotional symptoms, not necessarily obvious in this DRS score. This may be reflective of the fact that the DRS may be less sensitive to identifying subtle decline (Dams-O’Connor, Pretz, Billah, Hammond, & Harrison-Felix, Reference Dams-O’Connor, Pretz, Billah, Hammond and Harrison-Felix2015). Thus, a finer grained score in the lower disability range might show further differentiation among patients and treatment groups out to 6-months and further. Moreover, the component scores themselves may give a better understanding of patient ability in this range of disability.
We took an ITT approach to this study for comparability to the original study results, which included individuals who lost their lives. More patients among those who died were in the most sTBI group. In the future, analytical methods should address this complication when studying recovery in sTBI through clinical trials research, for example, an integrated joint modeling approach. Future work is needed to study the use of longitudinal methods in clinical trials research and what could be learned from them that cannot be learned from single time point outcome studies.
CONCLUSIONS
This study demonstrated the value of taking a comprehensive view of recovery from sTBI as a temporally dynamic process that is shaped by both treatment and injury severity, and highlights the critical importance of the timing of primary outcome measurement. If primary outcomes are measured before recovery curves have reached their long-term asymptotes for all patients, estimates of treatment impact are specific to the time at which primary outcomes are measured. Effects of Epo1 varied as a function of injury severity and time. Because injury severity was not controlled at randomization, future studies are warranted to understand the effects of Epo1 on sTBI recovery over time and the possible moderating influence of injury severity on these treatment effects.
ACKNOWLEDGMENTS
This study was supported by National Institute of Neurological Disorders and Stroke (grant #P01-NS38660). Author Disclosure Statement: No competing financial interests exist.
Supplementary Materials
To view supplementary material for this article, please visit https://doi.org/10.1017/S1355617718001078