Introduction
Genetic diversity of germplasm is the basis for inbred and hybrid crop improvement. Germplasm exchange across countries, regions or breeding programmes after the 1960s has promoted the production of many improved cultivated varieties/elite lines, which led to the genetic mixture of geographical germplasm and reduced genetic diversity, as all the breeding programmes pursue limited and common elite variety sources (Wei et al., Reference Wei, Yuan, Yu, Wang, Xu and Tang2009; Agrama et al., Reference Agrama, Yan, Jia, Fjellstrom and McClung2010; Yan et al., Reference Yan, Agrama, Jia, Fjellstrom and McClung2010). The characterization of genetic diversity and elucidation of relationships among improved varieties and elite lines are fundamental for parental selection in inbred and hybrid variety breeding and in the construction of heterotic pools.
Molecular markers, such as restriction fragment length polymorphism and simple sequence repeat, have been widely used for investigating genetic diversity in rice (Zhang et al., Reference Zhang, Maroof, Lu and Shen1992; Garris et al., Reference Garris, Tai, Coburn, Kresovich and McCouch2005; Agrama et al., Reference Agrama, Yan, Jia, Fjellstrom and McClung2010; Yan et al., Reference Yan, Agrama, Jia, Fjellstrom and McClung2010). The application of single-nucleotide polymorphisms (SNPs) introduced a new tool of genotyping for diversity and marker-assisted selection with cost-efficiency. SNPs are the most abundant type of DNA variations (Varshney et al., Reference Varshney, Graner and Sorrells2005), with data being easily merged across research groups and stored in databases regardless of the genotyping platform used. The key advantages of the SNP technology are its high-throughput and increased speed coupled with lower cost per data point compared with previous marker platforms (Thomson et al., Reference Thomson, Zhao, Wright, McNally, Rey, Tung, Reynolds, Scheffler, Eizenga and McClung2012). Currently, SNPs are extensively being used to investigate genetic diversity and population structure in rice (McNally et al., Reference McNally, Childs, Bohnert, Davidson, Zhao, Ulat, Zeller, Clark, Hoen and Bureau2009; Chen et al., Reference Chen, He, Zou, Chen, Yu, Liu, Yang, Gao, Xu and Fan2011; Xu et al., Reference Xu, Liu, Ge, Jensen, Hu, Li, Dong, Gutenkunst, Fang and Huang2011; Zhang et al., Reference Zhang, Li, Li, Liu, Zhao and Lu2011; Zhao et al., Reference Zhao, Tung, Eizenga, Wright, Ali, Price, Norton, Islam, Reynolds and Mezey2011; Thomson et al., Reference Thomson, Zhao, Wright, McNally, Rey, Tung, Reynolds, Scheffler, Eizenga and McClung2012). However, almost all these researches have focused on genetic variability and significant differentiation among rice subspecies, ecotypes or landraces, such as the classification of aus, indica, aromatic, temperate japonica and tropical japonica. With different concerns from geneticists and taxonomists, rice breeders are more interested in the genetic diversity among/within breeding populations and elite germplasm to select appropriate parents and germplasm for developing new varieties to maximize yield potential as well as trait performance. A few documented studies have dealt with genetic diversity among improved varieties/elite lines using SNPs and their potential application for hybrid rice breeding (He et al., Reference He, Xie, Chen and Dela Paz2012; Xie et al., Reference Xie, Guo, Ren, Hu, Wang, Xu, Li, Qiu and Dela Paz2012).
In the present study, a group of 737 indica accessions collected from major rice-growing regions worldwide, including improved varieties and elite breeding lines popularly cultivated on a large scale and/or extensively used in rice breeding programmes as donor parents, were genotyped with SNPs. The main objectives of the study were to (i) characterize genetic diversity and population structure among improved indica varieties/lines based on SNPs and (ii) examine the relationship between geographical distribution and subpopulation structure for obtaining baseline data and references for parental selection and understanding heterotic pools in indica hybrid rice breeding.
Materials and methods
Plant materials
Initially, 838 indica varieties were collected from the International Network for Genetic Evaluation of Rice (INGER) Nurseries during 2007–2010, breeding programmes at International Rice Research Institute (IRRI) and International Center for Tropical Agriculture (CIAT). After screening with SNPs, accessions with more than 6% of heterozygosity were discarded, and 737 accessions were retained for further data analyses. The 737 samples were from IRRI and nine Asian countries, CIAT and two Latin-American countries, and Africa Rice Center (WARDA), Agricultural Research for Development in Africa (IITA) and two African countries (Table S1, available online). The samples represented either varieties from the major indica-growing regions in the world or those currently used in indica breeding programmes.
Genomic DNA extraction and SNP genotyping
Leaf sample from one plant of each accession was collected 20 d after transplantation. DNA was extracted following the modified cetyltrimethylammonium bromide (CTAB) method (Murray and Thompson, Reference Murray and Thompson1980). The isolated DNA was RNAse-treated, and the final concentration was normalized to 50 ng/ul. The SNP genotyping employed a 384-SNP assay designed to be informative for indica germplasm (Thomson et al., Reference Thomson, Zhao, Wright, McNally, Rey, Tung, Reynolds, Scheffler, Eizenga and McClung2012) and was carried out following the methodology reported in Xie et al. (Reference Xie, Guo, Ren, Hu, Wang, Xu, Li, Qiu and Dela Paz2012). The non-informative SNPs, which were monomorphic or with more than 20% missing data, were excluded from further analyses.
Data analyses
The measurements of genetic distance and other diversity parameters of the samples were computed using PowerMarker version 3.25 (Liu and Muse, Reference Liu and Muse2005). Relative kinship was calculated between each pair of accessions using the TASSEL software (Bradbury et al., Reference Bradbury, Zhang, Kroon, Casstevens, Ramdoss and Buckler2007). An admixture model-based program STRUCTURE was used to infer population structure and to assign individuals to groups (Pritchard et al., Reference Pritchard, Stephens and Donnelly2000). Models with a putative number of groups (K) from 1 to 10 with admixture and correlated allele frequencies were considered, and ten independent runs of a burn-in of 10,000 and a run length of 100,000 iterations for each K were implemented. To determine the K value, both estimated log probability (Ln P(D)) value and Evanno's ΔK were used (Evanno et al., Reference Evanno, Regnaut and Goudet2005). An individual was assigned to a specific group if it had ≥ 0.6 membership in that group; otherwise, it was assigned to the admixed group. A dendrogram was constructed from the Chord (Cavalli-Sforza and Edwards, Reference Cavalli-Sforza and Edwards1967) genetic distance matrix using the neighbour-joining (N-J) algorithm with PowerMarker version 3.25, and the resulting tree was visualized using DARWin 5.0 (Perrier and Jacquemoud-Collet, Reference Perrier and Jacquemoud-Collet2006). Analysis of molecular variance (AMOVA) was used to partition the variation among and within group components. Significance levels for variance component estimates were computed using 10,000 permutations. F st, correlation of alleles within subgroups (SGs), were calculated using the AMOVA approach implemented in ARLEQUIN version 3.5 (Excoffier and Lischer, Reference Excoffier and Lischer2010).
Results
Characterization of SNPs and genetic diversity in improved indica germplasm
Of the 384 SNPs, five were excluded from the analysis because they had more than 20% of missing data in the diversity panel. Among the 737 improved indica varieties/lines, 758 alleles were detected with 379 SNPs, each with two alleles as expected. The average heterozygosity was 0.0046 with a range of 0–0.0288. The average gene diversity index was 0.2963 with a range of 0.0027–0.5000. The average polymorphic information content (PIC) value was 0.2410 with a range of 0.0027–0.3750 (Table S2, available online). The Chord genetic distance between pairwise comparisons of all the 737 samples ranged from 0.001 to 0.515 with an average of 0.267 and a majority (93%) having a value greater than 0.200 (Fig. 1(a)). Relative kinship coefficients between pairs of samples varied from 0 to 1.98 with an average of 0.56 and a majority (85%) having a value of less than 0.80 (Fig. 1(b)).

Fig. 1 Distribution of pairwise genetic relationship: (a) the Chord genetic distance and (b) relative kinship.
Population structure
In the model-based grouping analysis, Ln P(D) increased continuously with increasing K from 1 to 10 (Fig. 2(a)). However, Ln P(D) exhibited a high turning point at K= 2 and remained relatively flat from K= 2 to K= 10. Evanno's ΔK also exhibited a sharp peak at K= 2 and a relatively small peak at K= 6 (Fig. 2(a)). Both Ln P(D) and ΔK values indicated two distinctly divergent groups with six SGs most possibly among the accessions. At K= 2, most of the accessions (84.4%) were classified into one of the two major groups and 115 accessions were categorized as ‘admixture’ because less than 60% of their ancestry was classified into any one of the two groups (Fig. 2(b); Table S1, available online). At K= 6, each of the two major groups was further divided into three SGs. Considering the multi-origin of the germplasm, as well as facilitation of further heterotic group study, we considered the six SGs as our basis for the tested samples.

Fig. 2 Population structure of 737 improved indica accessions with model-based grouping method in STRUCTURE: (a) plot of Ln P(D) and ΔK with K =1–10 and (b) population structure of the 737 accessions at K= 2 and K= 6. Each vertical line represents one individual with lengths proportional to the estimated probability membership to each of the K inferred populations.
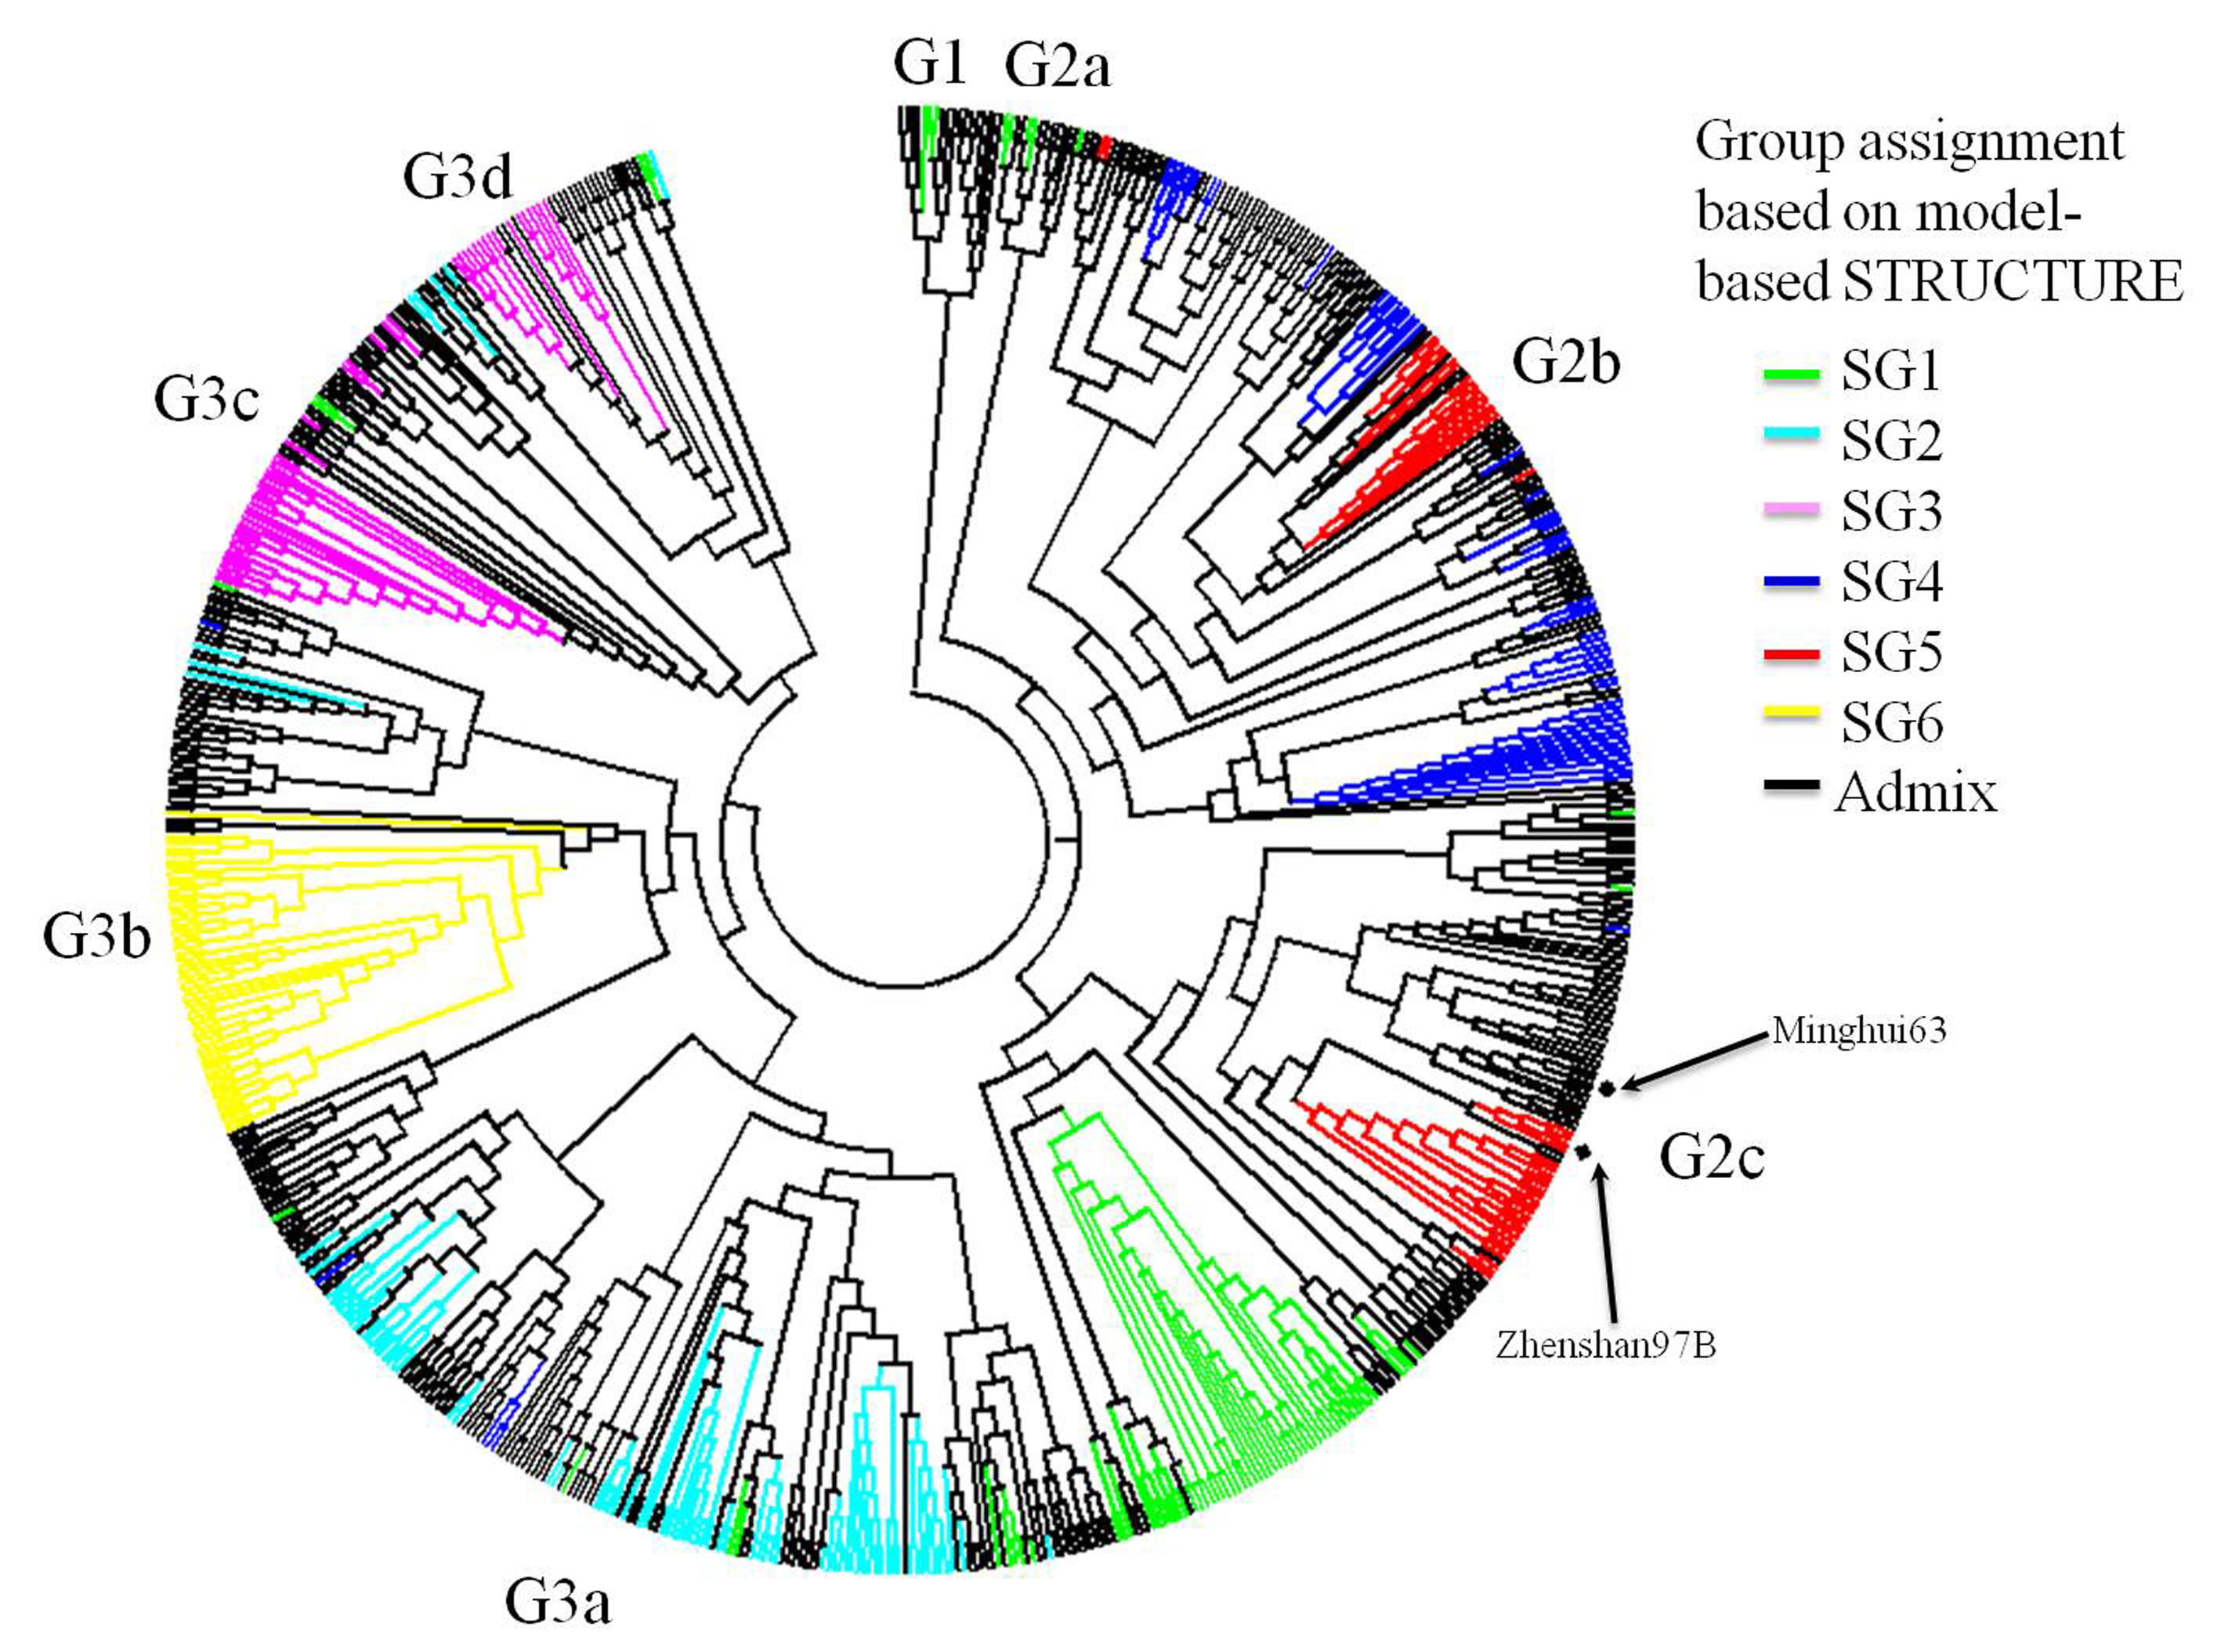
With a cut-off value of 60% inferred ancestry for SG assignment, 354 accessions (48.2%) were assigned to one of the six model-based SGs and 443 accessions (51.8%) in the sample were categorized as having admixed ancestry (Fig. 2(b); Table S1, available online). The N-J clustering grouped the 737 accessions into three major groups with eight SGs (Fig. S1, available online). The N-J clustering exhibited a minor consistency with the model-based population partition in assigning lines to groups. Nonetheless, most of the accessions in the same model-based SG tended to be categorized into the same N-J cluster, except the accessions in SG3 and SG5, where each was divided into two SGs, respectively (Fig. S1, available online). In the eight SGs, each SG originated from different geographical regions or countries, and none of the SGs comprised accessions originating exclusively from a single region or country (Fig. 3 and Table S1, available online). It is worth noting that all the Latin-American lines were clustered together and grouped into G2b, except two lines, while the African accessions were dispersed among the different clusters (Fig. 3).

Fig. 3 Neighbour-joining tree based on the Chord genetic distance. Accessions from different continents or institutes are indicated. IRRI, International Rice Research Institute.
Genetic diversity and differentiation of inferred groups
Among the six SGs classified by model-based grouping, SG5 exhibited the highest average PIC, gene diversity and heterozygosity values, while SG3 and SG6 exhibited the lowest PIC, heterozygosity and gene diversity values (Table S3, available online).
Overall pairwise comparisons indicated a modest degree of differentiation between the six model-based groups with F st value ranging from 0.20 to 0.48 (Table 1). Lower levels of differentiation were observed in the pairwise comparisons of SG1 with SG2 (F st= 0.20) and SG2 with SG4 (F st= 0.27), and higher levels of differentiation were observed in the pairwise comparisons of SG3 with the other SGs, specifically with SG6 (F st= 0.48), SG5 (F st= 0.43) and SG4 (F st= 0.39). AMOVA revealed that most of the genetic variation resided among individuals within SGs (66.95%) and between SGs (31.29%) and only a low percentage (1.76%) of variance was partitioned within individuals (Table 2).
Table 1 Pairwise F st values between different subgroups (SGs)
Table 2 Analyses of molecular variance for accessions assigned to groups by STRUCTURE

d.f., degree of freedom; SGs, subgroups.
Discussion
Genetic diversity and structure have been documented previously in rice; however, almost all these studies mainly reflected the genetic diversity between/among subspecies, ecotypes or landraces. In hybrid rice breeding, varieties from different subspecies/traditional landraces have not been directly applied in commercial production due to various problems, such as low spikelet fertility and poor adaptability. Rice breeders are more interested in the diversity of improved varieties and elite breeding lines, especially in the same subspecies. To obtain reliable reference information for parental selection in hybrid rice breeding and classification of heterotic groups, it is necessary to investigate the genetic structure and differentiation of improved varieties and elite breeding lines for practical breeding purposes. All the materials used in this study were improved semi-dwarf indica varieties/elite lines and indica landraces were not selected considering the difficulty in directly using landraces as a hybrid parent.
For 384 SNPs designed for indica/indica genotypes, there was a deviation between the grouping results based on distance and model. This is similar to the genetic study in improved japonica germplasm (Cui et al., Reference Cui, Xu, Tang, Yang, Yu, A, Cao, Xu, Zhang and Han2013), which could be due to the relatively narrow genetic background among the improved indica or japonica lines. In the model-based population structure analysis, the improved indica varieties/lines exhibited significant differentiation into two major groups with six SGs, but without any tendency associated with any particular breeding programme or geographical origin of the accessions. At K= 6, over half of the accessions (51.8%) were assigned to the admixed group compared with the six SGs. The main reason for the majority of lines being classified as the admixed individuals could be the gene flow within cultivated indica lines by germplasm exchange among countries, regions or institutes in the last 50 years. IRRI has played an important role in the provision of elite indica germplasm for variety improvement worldwide; for example, 49 of 91 accessions from Asian countries and 15 of 21 accessions from African countries in our tested samples have IRRI ancestries. So far, the INGER at IRRI has distributed a total of 50,912 seed samples to 69 countries and has facilitated more than 48,000 nursery accessions to breeding programmes among 80 rice-growing countries (http://seeds.irri.org/inger/). Valuable alleles have been widely spread and have possibly formed high-frequency gene clines under extensive elite germplasm dispersal, domestication and cultivation. The molecular marker technology has provided a powerful tool to regularly monitor and evaluate genetic composition and population structure of germplasm, as confirmed in this study. The distance-based N-J clustering revealed that almost all the Latin-American improved indica lines clustered together and grouped into the same group with some Asian lines, indicating that Latin-American improved indica lines have tended to form their own ecological cline (Fig. 3). It could be a potential heterotic ecotype used for hybrid rice breeding. Nonetheless, the Latin-American improved indica lines are still closely related to Asian improved indica lines. On the contrary, the accessions collected from Africa were dispersed among the different clusters (Fig. 3), indicating that African improved indica lines have not yet formed their own ecological cline due to the late initiation of indica breeding and extensive introduction of IRRI ancestries.
Zhenshan97B and Minghui63, the two parents of an elite commercial hybrid widely grown in China for the last two decades, were grouped into the same SG with a relatively narrow genetic distance (Fig. S1, available online). This was consistent with the result of a genetic diversity study in indica varieties in South China and IRRI (Xie et al., Reference Xie, Guo, Ren, Hu, Wang, Xu, Li, Qiu and Dela Paz2012). The results revealed that the exploration of heterosis using high diversity within indica rice lines still has a great potential and also reflected the complexity of genetic basis for heterosis. In general, parental diversity is one of the major contributors to the magnitude of heterosis in hybrid rice; however, a significant genetic distance between parents seems not to be a prerequisite for all the high-heterosis hybrid rice lines. Genetic diversity and structure information on improved indica varieties/lines based on molecular markers would provide reference data for parental selection in indica hybrid breeding and indica heterotic pool construction.
Supplementary material
To view supplementary material for this article, please visit http://dx.doi.org/10.1017/S1479262113000579
Acknowledgements
This research was supported by the Hybrid Rice Development Consortium at IRRI and the IRRI-China Scholarship Council (CSC) programme. The authors thank Dr Michael Thomson and his team at IRRI Genotyping Services Laboratory for genotyping the samples and the IRRI INGER programme for providing sample accessions.