


Background and industry issues
Plant sucking bugs from the family Miridae have emerged as key pests of transgenic cotton expressing endotoxin genes from Bacillus thuringiensis (Bt) in Australia and other cotton growing parts of the world (McColl et al., Reference McColl, Khan and Umina2011; Wilson et al., Reference Wilson, Downes, Khan, Whitehouse, Baker, Grundy and Maas2013, Reference Wilson, Whitehouse and Herron2018). In Australia, Creontiades dilutus (green mirid) and C. pacificus (brown mirid) are major pests of cotton with the potential to cause damage and significant yield loss in all cotton growing areas year after year. In the USA, a number of Lygus and Creontiades species are among the most damaging and widely distributed pests of cotton (Wheeler, Reference Wheeler2001). In the remainder of this treatise, the common name mirids will be used collectively to denote the Australian green and brown mirids. Crop damage by mirids is defined inclusively as abscission of fruiting bodies after being fed on and damage to locules and developing seed within older bolls that are retained following feeding activity.
In the conventional (pre-Bt) cotton era, season-long insecticide application to control heliothine caterpillar pests provided effective incidental control of mirids (Adams & Pyke, Reference Adams and Pyke1982; Adams et al., Reference Adams, Foley and Pyke1984). In light of their increasing pest status and potential to cause economic yield loss in Bt cotton systems, mirid biology, ecology and population dynamics became the foci of substantial and sustained R&D investments from public (government) and industry funding sources aimed at developing control strategies. The outcome of these investments over the last 20 or more years has been the development of a comprehensive knowledge base and integrated pest management (IPM) strategy for mirid management in cotton (Wilson et al., Reference Wilson, Whitehouse and Herron2018).
Since the dawn of the Bt cotton era in the mid-1990s, cotton pest management in Australia has been heavily influenced by mirid management practices (Whitehouse, Reference Whitehouse2011; Wilson et al., Reference Wilson, Downes, Khan, Whitehouse, Baker, Grundy and Maas2013, Reference Wilson, Whitehouse and Herron2018). Mirid damage can occur at any and all stages of cotton crops, from seedling to boll filling (Miles, Reference Miles1995; Khan Reference Khan1999). Feeding damage by mirids typically results in the destruction of terminals, abscission of young squares (developing flower buds prior to anthesis) and bolls, and damage to lint in older developing bolls (Miles, Reference Miles1995; Khan Reference Khan1999), all of which can translate into significant yield loss (Khan et al., Reference Khan, Quade and Murray2006; Khan Reference Khan2008; Whitehouse, Reference Whitehouse2011). For this reason, mirids are often the target of early and midseason insecticide applications which, in turn, can result in the disruption of the beneficial insect community in cotton crops and flaring of secondary pests such as mites and whiteflies (Wilson et al., Reference Wilson, Bauer and Lally1998; Khan et al., Reference Khan, Quade and Murray2006; Mansfield et al., Reference Mansfield, Dillon and Whitehouse2006).
A key component of mirid IPM strategies in cotton has been the development and use of economic thresholds (ETs hereafter). A basic definition of an ET is the pest density above which the cost of the damage caused will exceed the cost of controlling the pest (Pedigo et al., Reference Pedigo, Hutchins and Higley1986; Pedigo, 1996). The first thresholds for mirids in (conventional) cotton, proposed in the 1980s, were based on limited research data and varied considerably between studies (e.g. Adams et al., Reference Adams, Foley and Pyke1984; Chinajariywong et al., Reference Chinajariywong, Pyke and Walter1988; see Miles (Reference Miles1995) for a detailed history of mirid thresholds in conventional cotton in Australia).
The work of adapting mirid thresholds developed for conventional cotton to first generation Bt cotton (Ingard®) began with a research project funded by the Cotton Research & Development Corporation (CRDC) in 1998. The project's outputs showed that a density of approximately 0.5 mirids m−1 was sufficient to cause a 30% fruit loss (Simpson, Reference Simpson2001). Subsequent CRDC-funded research projects (Khan, Reference Khan2008, Reference Khan2011, Reference Khan2014) resulted in further progressive refinement leading to the development of comprehensive mirid management guidelines appropriate for second and later generations of Bt cotton (Khan et al., Reference Khan, Quade and Murray2006; Khan Reference Khan2008). The new guidelines, featuring ETs appropriate for different climatic regions (e.g. warm or cool), crop stages (squaring, early and late boll), sampling method (visual, beat sheet, suction, sweep net) and level of crop damage (table 1), were first published in Cotton Pest Management Guide 2005–06 (Farrell & Johnson, Reference Farrell and Johnson2005) and continue to serve as the cotton industry's main decision support system for mirid management to date.
Table 1. Current economic thresholds for controlling green and brown mirids (Creontiades spp.) in Australian cotton.

Source: Maas & Redfern (Reference Maas and Redfern2017).
1 After 9–10 nodes.
2 Light tip damage – embryo leaves within the terminal are black.
3 Heavy tip damage – terminal and two to three uppermost nodes are dead.
The response of the Australian cotton industry to the availability of ETs to guide spray decisions for mirid management has traditionally been somewhat ambivalent. In 1997, industry mirid thresholds ranged from 0.16 to 0.33 m−1 for pre-squaring cotton and 0.5 m−1 for post-squaring cotton (Simpson et al., Reference Simpson, Murray and Lloyd1997) even though research had shown that densities of up to 4 mirids m−1 were not causing significant yield loss compared with mirid-free plots (Chinajariywong et al., Reference Chinajariywong, Pyke and Walter1988).
The level of adoption of mirid ETs in cotton was critically examined by Whitehouse (Reference Whitehouse2008, Reference Whitehouse2011) in 2006 and 2007 through surveys of crop protection practices used by crop managers.Footnote 1 One of Whitehouse's key findings was that mirid management guidelines were generally interpreted conservatively such that the lower ET associated with the more imprecise visual sampling method was used in preference to the substantially higher ET associated with the more accurate beat sheet sampling method (table 1) even when the latter was more appropriate.
Annual surveys of cotton production practices used by crop managers within the cotton industry from 2010 to 2017 by Crop Consultants Australia (CCA) have served to highlight the longer term trends in the level of adoption and industry confidence in the mirid management guidelines. Data from 29–65 respondents representing 81–100% of annual survey participants (54–67% of the total cotton area in Australia) indicate that on average over the survey period 34, 44 and 22% of mirid sprays were applied below, at and above the recommended industry thresholds, respectively (fig. 1). The proportion of total mirid sprays applied below threshold increased with the total amount of insecticides (dimethoate, fipronil and sulphoxaflor) specifically used to control mirids (regression df = 1.6; R 2 = 0.78; F = 0.004). In contrast, the proportions of mirid sprays applied at or above threshold were independent of insecticide usage (regression R 2 ≤ 21%; F ≥ 0.25). In the 2017 CCA survey of 64 respondents, 45 and 11% indicated that current mirid thresholds were reliable only sometimes (25–50% of occasions) and infrequently (0–25% of occasions), respectively.

Fig. 1. Survey data showing the percentage of annual (seasonal) insecticide spray recommendations made by Australian crop managers (consultants and/or agronomists) for mirid control in cotton applied below, at or above the recommended ET in the context of total insecticide usage (total g active ingredients divided by total survey area) targeting mirids. See the text for details. Data source: Crop Consultants Australia.
The assessments of adoption summarized above highlight two dimensions of the problem: (1) a historical discrepancy between the (nominal) mirid densities used by industry to underpin spray decisions and currently recommended ETs developed through research, and (2) a broad-based lack of confidence in the mirid management guidelines, particularly ETs. The two are interrelated to the extent that a partial explanation for the first is highly likely to be found among the factors contributing to the second.
The first objective of this review is to identify and characterize the factors that contribute to the long standing discrepancy in the use and lack of confidence (reliability) in recommended ETs for mirid control. The second objective is to explore holistic mirid management alternatives that address intrinsic constraints and/or weaknesses in the traditional ET centric approach to mirid management through the incorporation of mirid induced damage into a strategic framework of factors that contribute to generation and loss of yield in cotton.
Reasons for sub-threshold spraying
Based on the findings of the CCA surveys and those of Whitehouse (Reference Whitehouse2008), the discrepancy between recommended and nominal ETs is evidenced by one third or more of all mirid sprays being applied below the recommended ET. A resolution of this discrepancy requires a thorough understanding of the range of factors (fig. 2) that can influence adoption and the level of mirid damage in cotton.
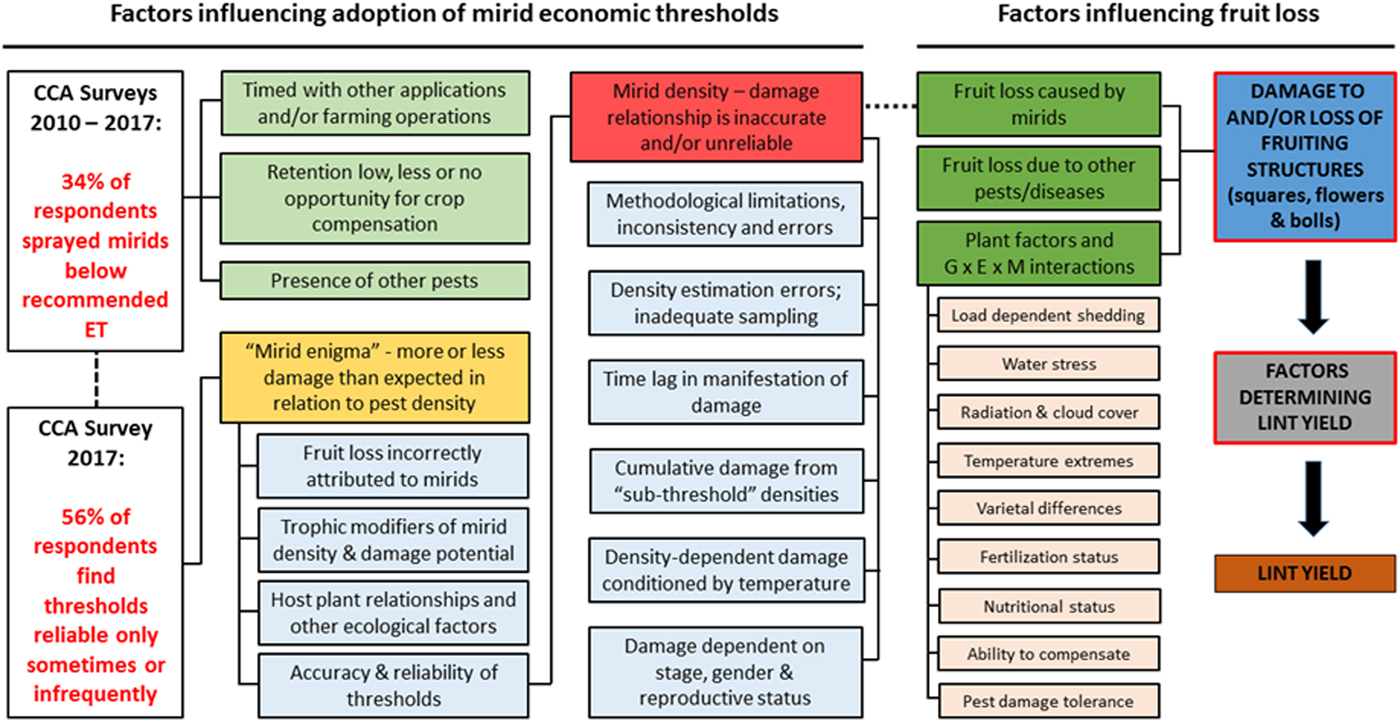
Fig. 2. The relationship and linkage between key factors influencing adoption of mirid management guidelines (ETs) and those contributing to fruit loss in Australian cotton, identified from an assessment of spray practice adoption by Whitehouse (Reference Whitehouse2008), annual surveys of cotton consultants/agronomists (CCA, 2010–2017), Cotton Research & Development Corporation project Final Reports and the scientific literature on mirid management.
By far the most important stated reason for sub-threshold spraying is timing of the mirid spray to take advantage of multitasking opportunities presented by other farming operations such as spraying for weeds and other pests, and agronomic operations (fig. 3). Other notable reasons include low fruit retention with low or diminishing prospects of crop compensation and the presence of other pests.

Fig. 3. Reasons provided by respondents in the 2015 (n = 39) and 2016 (n = 56) CCA surveys on crop protection practices in the cotton industry for mirid sprays applied below recommended ETs.
An element of sub-threshold spraying can be attributed to lack of confidence in the ET. Some of the spray events classified by more than 80% of respondents in the 2015 and 2016 surveys as ‘Timed with other operations’ (fig. 3) could arguably be considered insurance sprays (Whitehouse, Reference Whitehouse2011) in response to perceived lack of accuracy and/or reliability of thresholds (see below). A common practice aimed at extending the perceived benefits of insurance spraying for mirids is addition of abamectin, a highly cost effective miticide, to spray mixtures to minimize the risk of two-spotted spider mite outbreaks that often follow mirid sprays (Herron & Wilson, Reference Herron and Wilson2016). This practice is selecting strongly for resistance in two-spotted spider mites to abamectin. The availability of relatively cheap mirid and mite control options is also likely to be a factor in insurance spraying; the chemical cost of a low rate (30 ml) of fipronil for mirid control is less than $5 ha−1.
Lack of confidence (reliability) in the recommended ETs for cotton (table 1) stems from a phenomenon that may be best described as the ‘mirid enigma’; Australian crop managers have long reported observations of more damage than expected at low mirid densities and the opposite at high mirid densities. The variable nature of mirid-related damage in cotton is by no means restricted to Australian production systems. California cotton growers have long reported damage to cotton by Lygus bugs to be more or less than expected based on the density of the pest estimated through sampling; this is referred to as the ‘Lygus enigma’ (Rosenheim et al., Reference Rosenheim, Goeriz and Thacher2004; Zink & Rosenheim, Reference Zink and Rosenheim2005). From an economic perspective, the putative ability of low mirid densities to cause disproportionately high yield loss is of greater concern than the opposite scenario. Hence the former will be the main focus of the mirid enigma discussion hereafter.
Factors that can influence the accuracy of the mirid density–damage relationship
Fruit loss incorrectly attributed to mirid damage
This is the first of four broadly defined categories of plausible factors (fig. 2) that underpin the mirid enigma. Mirid activity is just one of many factors including other (non-mirid) arthropods, diseases and plant factors (genetic × environment × management interactions; fig. 2) that individually or collectively contribute to overall fruit loss in cotton which can range from 40 to 50% (Guinn, Reference Guinn1982; Sadras & Fitt, Reference Sadras and Fitt1997; Tariq et al., Reference Tariq, Yasmeen, Ahmad, Hussain, Afzal and Hasanuzzaman2017). The component of overall fruit loss attributed to plant physiological factors (e.g. over production) has been estimated to be around 60% (Oosterhuis & Jernstedt, Reference Oosterhuis, Jernstedt, Smith and Cothren1999). The component of fruit loss attributed to mirids may well be overestimated if physiological shedding in response to total fruit load and other causal factors is incorrectly attributed to damage caused by mirids because the former is often difficult to distinguish from the latter (Whitehouse, Reference Whitehouse2011).
If non-mirid related fruit loss is properly accounted for, some researchers argue that densities of mirids that can cause significant yield loss are likely to be higher than nominal thresholds used by industry and possibly higher than current recommended thresholds (Chinajariywong et al., Reference Chinajariywong, Pyke and Walter1988; Duggan, Reference Duggan2006; Whitehouse, Reference Whitehouse2008). This argument is more plausible in irrigated production systems that generally offer more opportunities for compensatory plant responses to insect damage than in rain fed (water limited) systems with little or no scope for compensation wherein mirids can inflict significantly greater damage (Miles, Reference Miles1995; Khan Reference Khan2008).
Trophic modifiers of mirid density and damage potential
Modern Bt cotton production systems, typically characterized by minimal pesticide usage (Wilson et al., Reference Wilson, Downes, Khan, Whitehouse, Baker, Grundy and Maas2013, Reference Wilson, Whitehouse and Herron2018), are home to a wide variety of beneficial arthropods (spiders, predatory and parasitic insects) which form the corner stone of IPM strategies designed to keep populations of pest species (e.g. mirids) in check (Naranjo, Reference Naranjo2001; Mensah, Reference Mensah2002; Whitehouse et al., Reference Whitehouse, Wilson and Fitt2005; Mansfield et al., Reference Mansfield, Dillon and Whitehouse2006). Beneficial arthropods can modify the type and extent of plant (crop) damage through density and behaviourally mediated effects on the target pest population (Schmitz et al., Reference Schmitz, Beckerman and O'Brien1997; Grostal & Dicke, Reference Grostal and Dicke1999; Schmitz & Suttle, Reference Schmitz and Suttle2001; van Veen et al., Reference van Veen, Morris and Godfray2006). Whitehouse (Reference Whitehouse2011) found that in cage experiments involving green mirids, lynx spiders (Oxyopes molarius) and damsel bugs (Nabis kinbergii), cages with spiders had fewer mirids and less boll damage than those without. Her results also showed that in cages with both predators and mirids, there were fewer mirids at the end of the experimental assessment than in cages with mirids alone but no reduction in damage. Thus, complex behavioural interactions between herbivores and their natural enemies can result in significant, often unexpected, variability in plant damage.
Host–plant relationships and other ecological factors
The green mirid is endemic to Australia and has been recorded from a wide variety of feral and cultivated host plants (Miles, Reference Miles1995; Malipatil & Cassis, Reference Malipatil and Cassis1997). Cotton is thought to be a poor quality host for mirids (Chinajariywong, Reference Chinajariywong1988; Hereward et al., Reference Hereward, DeBarro and Walter2013) despite its major pest status in this crop. Molecular analyses of gut contents aimed at better understanding the feeding behaviour and pest status of the green mirid across its host plant range have shown that adults collected from one host often feed locally on other host plant species nearby even when the former is the primary and inherently more attractive host plant (Hereward & Walter, Reference Hereward and Walter2012; Hereward et al., Reference Hereward, DeBarro and Walter2013). This research raises important unanswered questions on the feeding behaviour of mirids and the potential for variable damage in response to the heterogeneity of cropping systems, crop layouts and vegetation landscapes.
Accuracy and reliability of thresholds
More than 20% of respondents in the 2017 CCA survey nominated thresholds being too high as justification for sub-threshold spraying. The assertion of unrealistic or inaccurate thresholds calls into question the robustness (accuracy) and reliability of the mirid density–damage relationship in cotton on which ETs are based (Miles, Reference Miles1995). The main factors that can influence the relationship and its consistency over time (fig. 2) are reviewed below in the context of research done in Australia and the USA.
Methodological limitations, inconsistency and errors
The Australian research effort on the damage capability of mirids, field sampling and ETs in cotton is characterized by a lack of methodological consistency between researchers and projects, and highly variable outcomes. Adams et al. (Reference Adams, Foley and Pyke1984) assessed mirid damage in early squaring cotton by enclosing field caught mirids in field cages (1.2 × 1 × 1.6 m in dimension) for 7–10 days and concluded that one adult mirid damaged approximately five squares per m of row (m−1 week−1) which equated to a threshold of 2–3 mirids m−1. Using similar methodology, Chinajariywong et al. (Reference Chinajariywong, Pyke and Walter1988) suggested that economically damaging densities of mirids were possibly above 4 adults m−1 in the seedling stage and above 8 adults m−1 in the early squaring stage. Miles (Reference Miles1995) studied mirid damage in squaring cotton enclosed in 2 × 2 × 2 m field cages with varying mirid densities within for 23–32 days and found no relationship between mirid density and final yield. Simpson (Reference Simpson2001) assessed crop damage in large, uncaged field plots in which mirids were either excluded using chemical insecticides or left untreated, and concluded that a realistic mirid threshold was 0.5 adults m−1. Duggan (Reference Duggan2006) found that cotton exposed to damage by up to 4 mirids m−1 for a week within 2 × 2 m field cages did not affect cotton yield. Khan (Reference Khan2008), whose outputs underpin the current mirid management guidelines (table 1), studied the interaction between crop stage and mirid density in cotton that was enclosed within field cages (dimension: 1 × 0.8 × 1.2 m) with varying mirid densities for 5–6 weeks. The foregoing examples highlight methodological inconsistency and variability of outputs that are due, in part, to well-known difficulties associated with researching these highly mobile insects. They attack all stages of the crop, have a long developmental period, cryptic daytime and nocturnal feeding behaviour, crepuscular activity patterns and unpredictable population dynamics (Wheeler, Reference Wheeler2001).
A variety of sampling methods have been evaluated and used to estimate population density of mirids and related species in the field in Australia and overseas. These include but are not limited to visual, suction (D-Vac), beat or shake sheet, shake bucket, sweep net sampling, dirty blooms (flowers) and dirty squares (Simpson et al., Reference Simpson, Murray and Lloyd1997; Deutscher et al., Reference Deutscher, Dillon, McKinnon, Mansfield, Staines and Lawrence2003; Threlfall et al., Reference Threlfall, Deutscher, Wilson and Staines2005; Wade et al., Reference Wade, Scholz, Lloyd, Cleary, Franzmann and Zalucki2006; Musser et al., Reference Musser, Stewart, Bagwell, Lorenz, Catchot, Burris, Cook, Robbins, Greene, Studebaker and Gore2007; Brewer et al., Reference Brewer, Anderson, Armstrong and Villanueva2012). No one method has proved to be suitable for sampling all growth stages of cotton due to differences in practicality and sampling efficiencies (Wade et al., Reference Wade, Scholz, Lloyd, Cleary, Franzmann and Zalucki2006; Musser et al., Reference Musser, Stewart, Bagwell, Lorenz, Catchot, Burris, Cook, Robbins, Greene, Studebaker and Gore2007; McColl et al., Reference McColl, Khan and Umina2011). This makes comparison of results from different projects and researchers difficult and also has a bearing on the levels of adoption amongst cotton pest managers.
Given the strong tendency of mirid adults and nymphs to hide or disperse (flying, running) when disturbed, the use of glasshouse and field cages for quantifying mirid activity and damage is indispensable. However, plants growing within cages and the insects inhabiting them undoubtedly experience an altered micro-environment (temperature, relative humidity, radiation, airflow) in comparison with their uncaged counterparts. The difference in the micro-environment experienced by caged and uncaged plants will be influenced by the duration of caging, the number and size of plants being enclosed and the degree to which caging impacts on the canopy structure.
Brewer et al. (Reference Brewer, Anderson and Armstrong2013) found 6–12% lower fruit retention in un-infested field caged plants compared with the no-cage control in Texas dryland cotton which they attribute to the effect of caging. The impact of caging on fruit production and retention (the cage effect) is undocumented, unstated or ignored in the Australian mirid research material (project reports, publications) relating to fruit loss reviewed here. Therefore, the cage effect is likely to be an important consideration in mirid research. Fruit loss resulting from the cage effect on plants will be a significant source of inflationary error in estimates of mirid-related damage obtained in highly contrived conditions involving plant crowding and/or distortion of the canopy and altered micro-environment.
Aside from the effects of caging on plants, it would be unrealistic to expect mirids (and other insects) introduced into highly contrived caged environments to behave in exactly the same way as their counterparts in the natural crop canopy. As in the case of plant responses, the comparative behaviour of mirids under caged and cage-free experimental conditions has received scant attention in the Australian research on mirid damage and thresholds in cotton.
Another dimension to the problem of estimating plant damage under caged conditions was highlighted by Musser et al. (Reference Musser, Catchot, Stewart, Bagwell, Lorenz, Tindall, Studebaker, Leonard, Akin, Cook and Daves2009) in relation to cotton thresholds and sampling comparison for Lygus lineolaris in the mid-southern USA. They found that natural populations of L. lineolaris caused significant yield loss in cotton. This finding was contrary to the prevailing view, based on a number of previous cage studies (Scales & Furr, Reference Scales and Furr1968; Jubb & Carruth, Reference Jubb and Carruth1971; Tugwell et al., Reference Tugwell, Young, Dumas and Phillips1976) where insectary reared bugs had been used, that L. lineolaris nymphs and adults caused altered growth and fruiting patterns but did not cause yield loss in cotton. The foregoing discussion highlights some of the methodological challenges associated with cage research on mirids and the need for judicious interpretation and use of the results.
The recommended mirid ETs (table 1) are based on the results of field cage trials done over three growing seasons (2004–05; 2005–06 and 2006–07) at the Queensland Department of Agriculture & Fisheries research facility (Kingaroy Research Station, KRS) in Kingaroy (Khan, Reference Khan2008). Mirid feeding damage at squaring, early and late boll filling stages of caged Bollgard II cotton plants in large field plots was quantified in each of the three years. Varying densities of adult mirids (males only) were introduced into the cages and allowed to feed for the duration (approximately 42 days) of each phenological stage. The resulting fruit loss and final lint yield data were used to quantify the relationship between yield loss and mirid density, which was then used to estimate ETs based on the formula of Pedigo et al. (Reference Pedigo, Hutchins and Higley1986): Economic ThresholdFootnote 2 = C/(V·D), where C = cost of control including application ($ ha−1), V = value of product and D = damage per pest per unit time.
Methodological errors, inadequate hypothesis testing and the need for validation of the currently recommended mirid ETs prompted three new analyses of Khan's (Reference Khan2008) cage experiments data. The first re-analysis examined the effect of varying the cost of control (C) thereby extending Khan's original calculations to better reflect contemporary chemical and application costs.
Khan's calculations were based on $15 as the cost of control (C), $450 as the value of product (V), i.e. one bale (227 kg) of cotton, and a damage (D) estimate derived from the relevant coefficient of yield in the regression equations in figs 4a–c. The ensuing ETs of 4.5 and 3.8 mirids m−1 for the squaring and early boll filling stages, respectively (table 2), were rounded down to the nearest integer, thereby resulting in the current industry ET recommendation of 4 and 3 mirids m−1 for beat sheet sampling (table 1). The arbitrary rounding down of ET estimates was justified by Khan as being necessary to account for the unreliability of the relationship between mirid density and damage to cotton under field conditions. Recalculation of Khan's ETs with higher costs of control results in dramatically larger ETs (table 2). For example, at V = $450, C = $45 results in unrealistic ETs of 13.5 and 11.5 mirids m−1 for squaring and early boll filling stages of cotton, respectively.

Fig. 4. The regression of lint yield on mirid density at different growth stages of Bollgard II cotton in field cages at the KRS facility as reported by Khan (Reference Khan2008) (a–c) and from a re-analysis of data accounting for variation among seasons (d–f). See the text for details (data source: Khan, Reference Khan2008).
Table 2. Revised ET estimates based on the formula of Pedigo et al. (Reference Pedigo, Hutchins and Higley1986) for mirids in squaring and early boll filling stages of Bollgard II cotton (beat sheet sampling method) for different values of product (V), costs of control (C) and the damage parameter (D) calculated daily or per check (3.5 days) from the coefficient of yield loss from the regression equations in fig. (4). Recalculated ET estimates have been rounded to the nearest 0.5. See the text for details.

1 Damage parameter calculated as daily loss of yield.
2 Damage parameter calculated as loss of yield per check (3.5 days).
The second re-analysis tested Khan's implicit assumption of parallelism of slopes among years as justification for pooling of the data used in ET calculations. Khan quantified the relationship between mean lint yield and mean mirid density using pooled data incorrectly aggregated on replicate number over all seasons. A grouped regression analysis of yield on mirid density with season as the grouping variable for each of the three phenological stages showed that the coefficient (slope) of yield did not differ significantly among seasons for the squaring and late boll filling stages (P > 0.35). For the early boll filling stage, the coefficient of yield in year 1 was significantly lower (P < 0.001) than in years 2 and 3. The re-analysis confirms Khan's estimates of the yield loss coefficient for the squaring and late boll fill stages (cf. figs 4a, d, c, f). However, pooling over seasons for the early boll stage is invalid because the yield loss–mirid density relationship clearly differs among years; the yield loss coefficient is 0.37 bales per ha per mirid over 42 days from Khan's pooled data calculation vs. 0.25–0.5 bales per ha per mirid from the re-analysis (cf. figs 4b, e).
The inter-annual difference is possibly a reflection of the dual sources of variability inherent in the mirid density–crop yield relationship, viz., variability of damage caused and variable compensation by the cotton plant (see below) in space and time. Follow-up research (Khan, Reference Khan2011) touched on but did not adequately address the critical issue of validation of the proposed mirid density thresholds.
From a methodological perspective, the rationale for nomination of a single ET for each growth stage based on a fixed cost of control is unclear and inconsistent with the philosophy and functionality of thresholds as decision support tools linked to the economics of IPM. A more accurate approach would have been the development of a lookup table of thresholds for a range of product value, cost (and potentially damage) parameters. The revised ETs for the early boll filling stage resulting from the second re-analysis (table 2), although manifestly different, are no more acceptable and realistic from a commercial perspective than those originally reported by Khan. Based on the estimated ETs in table 2, control of mirids in Australian cotton crops would be uneconomical except for in situations where the total control costs did not exceed $15–20 ha−1.
A key determinant of ETs other than the cost of control and product value (V) is the damage parameter (D). The third re-analyses tested the propriety of the time scale for D used by Khan in ET calculations. The time scale used in the definition of damage as well as unrealistic (underestimated) values of the damage parameter will result in potentially unacceptable (high) estimates of the ET even though contemporary (realistic) values of the cost of control (C) and value of product (V) have been used in the calculation. This is clearly demonstrated by the results of the third re-analysis in which mirid damage (yield loss) is gauged in units of 3.5 days in contrast to yield loss per day used by Khan. The former is logically a more appropriate unit of measurement because practice in the cotton industry is to check crops twice a week, roughly 3.5 day apart. The use of an appropriate time scale results in lower predicted ETs (table 2) that are more in line with mirid densities commonly observed in cotton crops.
Are the recalculated ETs resulting from the third re-analysis likely to be more accurate and/or robust than those currently recommended (table 1)? Whilst the former are computationally more accurate and better aligned with nominal industry action thresholds, the forgoing discussion leads to the conclusion that the mirid damage parameter (e.g. 0.25–0.5 bales per ha per mirid over 42 days) may have been underestimated in Khan's caged experiments at the KRS facility. The causes of underestimation are many (fig. 2) and include, among others, altered behaviour and variable damage potential of mirids as a result of trophic effects, host plant usage, caging, developmental stage, gender and mating status. Khan used only adult male mirids in the cage experiments, thereby limiting plant damage to just one of several potential contributing factors operating in natural, mixed populations of mirids. Some of these are discussed below.
The relevance of Khan's ET estimates is also questionable from a different perspective. The caged experiments were all conducted in low yielding (commercially unacceptable) irrigated cotton, as evidenced by the difference between caged cotton yields and those from contemporary cage-free experiments (Khan, Reference Khan2008) with the same treatments in field plots within commercial cotton crops on three farms (fig. 5). Collectively, the unrealistic ETs and yield discrepancies discussed above call into question the validity of using mirid density–damage relationships and thresholds developed in very low yielding caged cotton to manage mirids in relatively high yielding commercial cotton production systems.

Fig. 5. Lint yields of irrigated Bollgard II cotton subjected to mirid feeding damage at different growth stages and levels in field cages at the KRS facility and contemporary cage-free field plots within commercial cotton crops on three farms (data source: Khan, Reference Khan2008).
Density estimation errors; inadequate sampling
The accuracy and reliability of mirid density–damage relationships and ETs derived from them are critically dependent on the accuracy with which the pest population density is estimated. The density estimation problem has two dimensions that are relevant here, viz., spatial and temporal.
From a spatial perspective, the appropriate methodology for and accuracy of density estimation will be determined by the dispersion of the pest population in the crop/field, the desired statistical precision with which population density should be estimated (adequacy of sampling) and the type of sampling (Buntin, Reference Buntin, Pedigo and Buntin1994; Wilson, Reference Wilson, Pedigo and Buntin1994). The choice of probability distribution or model (e.g. normal, Poisson, negative binomial, Taylor's Power Law) used to describe pest dispersion is a major determinant of the optimum sample size, i.e. minimum number of sample units required to estimate population density with a desired level of precision (Legg & Moon, Reference Legg, Moon, Pedigo and Buntin1994). Statistical precision can be explained as the nearness of an estimated value to the true value; increasing the number of samples the estimate is based on increases the precision with which the value has been estimated (Buntin, Reference Buntin, Pedigo and Buntin1994; Legg & Moon, Reference Legg, Moon, Pedigo and Buntin1994). Estimation of pest density with a precision of 0.25 is thought to be sufficient for IPM purposes (Southwood, Reference Southwood1978; Buntin, Reference Buntin, Pedigo and Buntin1994).
The existing mirid ETs (table 1) were extended to industry by Khan et al. (Reference Khan, Quade and Murray2006) well before the critical issue of mirid density estimation received any attention. Work on characterization of mirid dispersion and determination of optimum sample size commenced in 2011 and ended with sample size recommendations (table 3; Khan Reference Khan2014). Ideally the work of sample size determination and quantification of mirid damage potential should have been conducted simultaneously so as to provide industry with appropriate sampling guidelines to underpin prospective ETs. The anomalous sequence of mirid R&D compounded by the lack of appropriate and accurate sampling advice to industry is likely to have contributed to perpetuation of the mirid enigma.
Table 3. Minimum number of samples required to estimate a given level of mirid density with a desired level of statistical precision (Source: Khan Reference Khan2014).

Khan's (Reference Khan2014) optimal sample size calculations indicate that 16 and 11 beat sheet samples (midway between the 0.2 and 0.3 precision columns in table 3) are sufficient to estimate a population density of 2 and 3 mirids m−1, respectively, with a standard IPM accuracy level (within 25% of the true mean). If a lower level of precision (e.g. 30%) is acceptable then ten and seven beat sheet samples are sufficient. If the actual mean is ≤1 mirids m−1, the required number of beat sheet samples jumps to 17–20, which makes accurate estimation of mirid density in periods or seasons of generally low abundance extremely challenging. Preliminary data gathered through group consultations at regional IPM meetings and one-on-one interviews with consultants in the MacIntyre and Gwydir valleys in the 2017–18 season (R. Sequeira, unpublished data) indicate that the prevalent practice of mirid sampling (mostly two to four beat sheet samples per management unit) is broadly consistent with a precision level of 0.5. This means that from a practical sampling perspective mirid density estimated from sampling will be, on average, 50% lower (or higher) than the true density in the crop and the observed level of damage will be higher or lower than expected. Therefore, inadequate sampling, as reflected in current industry practice, is an important factor in the perpetuation of the mirid enigma.
An important temporal aspect of mirid sampling was highlighted by Bodnaruk (Reference Bodnaruk1992). His study on the daily activity patterns of adult C. dilutes (green mirid) and Campylomma liebknechti (yellow mirid a.k.a. apple dimpling bug) in early flowering (15 nodes) cotton showed two activity peaks for both species, the first during the mid-morning and a second, larger peak, during late afternoon. His study, based on sweep net sampling, provides unequivocal evidence that late afternoon to early evening (3:30–6:30 pm) is the most effective time for sampling mirids; sampling during the first half of the day when virtually all commercial sampling activity takes place will result in significant underestimation of density by 50% or more. Bodnaruk's results are suggestive of diurnal changes in the vertical distribution of mirids in the crop canopy which, if confirmed using other sampling methods, e.g. beat sheet and D-Vac suction, will have significant implications for sampling and the mirid density–damage relationship. Sweep net sampling is best suited to and typically targets the upper half or third of medium-large plant canopies (Threlfall et al., Reference Threlfall, Deutscher, Wilson and Staines2005) and may, therefore, give biased results if there are significant diurnal shifts in mirid distribution within the crop canopy.
Time lag in manifestation of damage
The evidence for the capacity of mirids to cause yield loss is unequivocal. Yield loss is clearly linked to mirid density and fruit retention (Khan, Reference Khan1999; Khan et al., Reference Khan, Quade and Murray2006; Whitehouse, Reference Whitehouse2011) but mirid density is poorly correlated with fruit loss (Khan, Reference Khan2008; Whitehouse, Reference Whitehouse2011). Similar findings for L. lineolaris in overseas cotton systems have been attributed to a time lag between initiation of feeding on squares and young bolls, and physical manifestations of damage or abscission (Musser et al., Reference Musser, Catchot, Stewart, Bagwell, Lorenz, Tindall, Studebaker, Leonard, Akin, Cook and Daves2009). Mirid damage to developing ovules in older bolls is often undetectable from the outside and will only be evident as damaged (unharvestable) lint prior to harvest. Thus, a time lag is a highly likely and important source of error in estimates of mirid density related damage and a contributor to negative perceptions of threshold reliability among cotton pest managers.
Cumulative damage from ‘sub-threshold’ densities
Mirid damage to cotton is cumulative and typically reflects the combined activity of populations that have developed within the crop over time (multiple, overlapping generations) and immigrant populations (Khan, Reference Khan1999). While moderate to high densities of mirids will always be detected with current industry sampling practices, albeit with a low level of accuracy, densities of ≤1 m−1 are more likely than not to go undetected due to minimum sample size requirements which are significantly more demanding (table 3). The cumulative damage potential of mirids at sustained low densities in field situations is currently unknown. A typical scenario experienced by cotton pest managers is a period of sustained low or negligible mirid pressure during which damage is also assumed to be negligible, followed by a rapid increase in pressure often attributed to a putative immigration event. In such scenarios, if the assumption of negligible cumulative damage at low densities is invalid, then one would expect to find more damage than predicted from mirid density estimated at peak pressure. Cumulative damage from sub-threshold densities of mirids is increasingly alluded to by cotton pest managers as a potentially important consideration in mirid management that is currently outside the ET framework and therefore a significant knowledge gap.
Density dependent damage conditioned by temperature
Temperature is a key environmental factor that influences virtually every facet of insect biology, physiology and ecology (Ratte, Reference Ratte and Hoffmann1984; Gillooly et al., Reference Gillooly, Charnov, West, Savage and Brown2002). Thus, one would expect crop damage resulting from insect activity to be influenced by temperature in one way or another. A potential link between temperature and damage caused by mirids in cotton was first highlighted by Adams et al. (Reference Adams, Foley and Pyke1984). They concluded that under cool conditions mirid densities much below their recommended threshold of 2–3 m−1 in early squaring cotton could prevent squaring entirely which justified thresholds being linked to short-term weather conditions. Chinajariywong et al. (Reference Chinajariywong, Pyke and Walter1988) went on to suggest the need for different ETs for cool and warm growing areas/regions in recognition of the potential link between climatic conditions, length of the season and opportunities for crops to recover from mirid induced damage. While this suggestion has been incorporated into the existing thresholds framework by arbitrarily setting thresholds for cool regions at 50% of corresponding warm region values (table 1), the potential link between mirid feeding activity (and implicitly damage) and significant changes in short-term weather conditions has not been further investigated. There are two distinct but interrelated questions that need to be addressed here. Was excessive damage observed in the Adams et al. study under cool weather conditions the result of more mirid feeding damage per se or a more severe reaction (higher rate of abscission of squares and young bolls) by the plant in response to mirid feeding under the cooler conditions?
Damage dependent on stage, gender and reproductive status
Mirids develop through five nymphal instars before reaching adulthood. Fourth and fifth instar nymphs and adults cause the most damage. Third instar nymphs are capable of 33% and 1st–2nd instars capable of 25% of the damage done by the later instars and adults (Khan, Reference Khan2008). From a population assessment perspective, the nymphs, early instars in particular, are generally found feeding within fruiting structures (McColl et al., Reference McColl, Khan and Umina2011) which makes them more difficult to detect and less apparent during sampling. Thus, damage done by mirid nymphs is more likely to go undetected while still making a significant contribution to overall damage. In support of this argument, Zink & Rosenheim (Reference Zink and Rosenheim2005) hypothesized that unexplained variability in the relationship between L. hesperus density in the field and the amount of cotton crop damage could be explained by highly variable damage to fruiting structures caused by different juvenile stages (instars) depending upon the age/stage structure of the pest population.
With the exception of Whitehouse (Reference Whitehouse2008), differences in damage caused by differences in gender, sexual state (mated or unmated) and reproductive state (pre-reproductive or reproductive) have been ignored in the Australian mirid research done to date. Whitehouse (Reference Whitehouse2008) found that while sexual state did not influence the number of undamaged fruit, it did have a statistically significant effect on total boll weight, with male and unmated female treatments producing more fruit dry weight; plant height varied significantly between treatments, with the tallest plants found in the control and mated female treatments. Whitehouse's results were confounded by aphid and mite contaminations, both of which can seriously damage cotton, and therefore warrant cautious interpretation. Her results are indicative of the need for a better understanding of mirid age and state-related injury potential. This knowledge gap is evident in other systems, as acknowledged by Cooper & Spurgeon (Reference Cooper and Spurgeon2012) whose video-based laboratory studies showed highly significant differences in behaviour and damage caused by L. Hesperus adults of different gender, sexual and reproductive states.
Summary and synthesis
Accurate quantification of yield loss in cotton that can be directly attributed to mirids is challenging due to the sheer number of factors that can influence loss of fruit and yield, and our incomplete understanding of these factors. Methodological and technological shortcomings are evident in the research done to date, as the foregoing review clearly highlights. The accuracy and reliability of existing ETs (table 1) are questionable due to (1) inherent weaknesses in the traditional approach to quantification of mirid induced damage, and (2) the inability, unwillingness or both of crop managers to meet the minimum procedural (sampling) requirements for effective implementation of mirid management recommendations.
The extent and timing of fruit loss over the life of the crop is a key factor in determining the characteristics of the final fruit load (e.g. number, weight, nodal position) and yield. Most estimates of fruit loss attributed to mirid damage in the Australian research reviewed here include contributions from mirid and non-mirid components (fig. 2). The latter includes fruit loss due to other pests and/or diseases, and a number of plant factors and genotype × environment × management (G × E × M) interactions. Load dependent shedding, environmental stress, varietal differences, fertilization status (self or cross pollination; V. Gagic, CSIRO, pers. comm.), nutritional status, compensation and pest damage tolerance ability are examples of factors that can partially or completely mask fruit loss due to mirid feeding. Interactions between factors may also influence the severity of fruit loss; feeding damage by mirids may result in greater fruit loss in stressed plants than in healthy plants. For comprehensive reviews on the totality of factors affecting fruit loss in cotton the reader is referred to Guinn (Reference Guinn1982) and Tariq et al. (Reference Tariq, Yasmeen, Ahmad, Hussain, Afzal and Hasanuzzaman2017). Accurate estimation and partitioning of damage among contributing factors will be critical to the success of future mirid management strategies.
How does one reconcile unreliable ETs underpinned by a mirid density–damage relationship that is arguably inaccurate with above-threshold spraying annually by 20–30% of CCA survey respondents (fig. 1)? A cotton plant with unlimited access to water and other essential resources has a remarkable ability to compensate for fruit loss due to mirid damage and other causes (Sadras, Reference Sadras1995; Lei Reference Lei2000; Wilson et al., Reference Wilson, Sadras, Heimoana and Gibb2003). In irrigated production systems, plant compensation for mirid induced fruit loss could easily be interpreted as threshold(s) being too low and the belief that higher mirid densities could be sustained without economically significant loss of yield. Thus, above threshold spraying does not necessarily imply disproportionately less damage by the extant mirid population in the crop, although the latter cannot be ruled out due to the potential of trophic effects and other factors to influence mirid behaviour and damage potential. However, in view of the limited data currently available to support the role of these other factors, instances of above threshold spraying are currently better explained by plant compensation masking mirid induced crop damage.
The Australian cotton industry has used nominal as well as recommended mirid ETs as static trigger points, in most cases without any consideration given to the economic aspects of spraying. This erroneous use pattern has been unintentionally supported by the failure of the cotton research and extension community to extend an accurate message on the correct interpretation and effective deployment of ETs. A prime example of this failure is the recommended threshold table in the Cotton Pest Management Guide 2017–18 (Maas & Redfern, Reference Maas and Redfern2017; p. 19) and the associated section (p. 20) which specifies a single region and crop stage-specific threshold whereas in reality the ET is linked to (and will change with) the value of the product and the cost of application (e.g. table 2).
A precondition for effective use of thresholds is the need to estimate pest density with adequate accuracy (precision). Current industry mirid sampling practices by and large do not support the effective deployment of the ETs because of their failure to meet minimum sample size requirements (table 3) that are necessary to estimate population density with at least 30% precision. Inadequate sampling, typically attributed to constraints on time and other resources, is a major contributing factor to the persistence of the mirid enigma.
The shortcomings of the mirid thresholds research identified in this report and the lack of industry compliance in relation to sampling requirements contribute in equal measure to a greater likelihood of unexpected outcomes and potentially higher risk of yield loss for many crop managers in the future.
Where to from here? Mirid management in the future
The inadequacies of traditional pest management systems based solely on numeric density thresholds for mirids and other bug have prompted calls for more inclusive decision support systems that allow other variables such as fruit retention levels (Khan, Reference Khan2011) and indirect measures of bug activity (Musser et al., Reference Musser, Stewart, Bagwell, Lorenz, Catchot, Burris, Cook, Robbins, Greene, Studebaker and Gore2007; Gore et al., Reference Gore, Catchot, Musser, Greene, Leonard, Cook, Snodgrass and Jackson2012) to be used in conjunction with population density thresholds to make intervention decisions. The importance of maintaining (first position) fruit retention at 60–70% to prevent economic yield loss has been a long standing recommendation in Australian cotton production and is reflected in the current mirid management guidelines (table 1). A more inclusive approach to mirid management (Khan, Reference Khan2011) comprising a recommended fruit retention benchmark in conjunction with a density based ET was an improvement on the latter used by itself. However, there is little evidence to indicate that the inclusive approach has delivered better mirid management outcomes. This is due in part to the static nature of the retention recommendation which limits its usefulness to a largely reactive and sometimes pre-emptive intervention philosophy. Current practice is largely characterized by reactive responses to fruit loss with some crop managers opting for insurance sprays for mirids, particularly when retention is close to the recommended 60–70% level, to minimize the likelihood of additional damage.
An alternative to the status quo is a departure from the traditional approach that links mirid damage directly to predicted yield loss at the end of the season, to an integrated fruit load management strategy that is underpinned by management of net fruit load (production–loss) dynamics during the reproductive stages of the crop. At its core is a proximal measure of mirid activity in the crop – damage to and/or loss of reproductive structures – and partitioning of observed fruit damage/loss into components that can be reliably attributed to different contributing causal agents of which mirids are just one.
A comprehensive characterization of the fruit load–yield relationship for modern, high yielding Bt cotton systems as a pre-requisite for futuristic IPM systems was advocated by Lei (Reference Lei2000) in the context of managing Helicoverpa spp. His approach to cotton IPM based on dynamic thresholds linked to the compensatory capacity of cotton is applicable in its entirety to mirid management systems of the future. The first and central element of this alternative approach is the capability to predict net fruit load dynamics (production–loss) in relation to plant growth parameters and environmental factors, i.e. independently of mirids and other factors that can influence fruit loss and/or damage. This capability would enable crop managers to generate and project dynamic fruit load baselines over defined time periods or between crop checks, and to partition observed fruit loss into components that can be reliably attributed to different contributing causal agents, including mirids.
The second element is the availability of accurate and reliable estimates of mirid density dependent damage potential at critical crop stages. On their own, estimates of fruit loss directly caused by mirids at different crop stages are often poorly correlated with yield loss at harvest and hence of little value within the traditional ET framework. However, the integration of mirid-related fruit loss estimates and dynamic fruit load baselines within a unified strategic framework would give crop managers a powerful mechanism to determine expected fruit retention profiles over desired time frames with and without the mirid influence, and accordingly assess the need for intervention. An integrated fruit load management strategy would also allow crop managers to distinguish between factors responsible for yield loss that are more readily amenable to control (e.g. mirids and potentially other insect pests) from those that are less so (e.g. environmental stress). Traditional ETs that benchmark damage to older bolls could also be used in conjunction with an integrated fruit load management strategy to fine tune mirid control decisions.
The third element, accurate estimation of pest density in the crop, is the lynchpin of all IPM strategies without which estimates or projections of pest damage are essentially unreliable. Prevalent crop sampling practice typically involves a small fraction of the sampling effort required to estimate mirid population density with acceptable accuracy. Given the poor adoption of current sampling guidelines, the development of an alternative sampling strategy that is effective as well as practicable will largely determine the usefulness of future mirid management strategies.
The capability of existing modelling/predictive platforms (e.g. Agricultural Production Systems sIMulator Model) to produce quantitative predictions of fruit load dynamics (e.g. plant compensation, stress-related fruit loss) is debatable but probably more within reach now than ever before (M. Bange, CSIRO, pers. comm.). Lei (Reference Lei2000) presents a comprehensive damage look-up table which shows the expected number of damaged fruit in relations to fruiting classes, crop development stage and the number of pest (Helicoverpa) individuals per unit area of crop. A similar look-up table for mirid damage would be the simplest form of a predictive tool if a more sophisticated dynamic predictive platform is still deemed beyond contemporary predictive modelling capability in cotton research. Development of new or improved capability of modelling fruit load dynamics should be a high priority for cotton research.
Acknowledgements
The author thanks Susan Maas, Sandra Williams, Melina Miles, Paul Grundy, Jamie Hopkinson, Mary Whitehouse, Simone Heimoana and Emma Colson for helpful comments on earlier drafts of the manuscript. Research funding support from the Australian Cotton Research & Development Corporation is gratefully acknowledged.


