


Anxiety disorders are a set of heterogeneous diagnostic categories that encompass social phobia, agoraphobia, panic attacks, generalized anxiety disorders, post-traumatic stress disorder and obsessive compulsive disorder (American Psychiatric Association, 2000). Anxiety symptoms such as nervousness, worry, fear, and/or rumination can occur at subclinical level, without meeting the criteria required for the diagnosis of a clinical disorder (Ozen, Ercan, Irgil, & Sigirli, Reference Ozen, Ercan, Irgil and Sigirli2010). Anxiety is considered a mental disorder that includes a variety of conditions that share a common feature, a psychopathological extreme worry. This feature appears itself in multiple dysfunctions and dysregulations to cognitive, behavioral and psychophysiological level (Stanley & Beck, Reference Stanley and Beck2000).
These clinical disorders are prevalent in general population (Copeland, Shanahan, Costello, & Angold, Reference Copeland, Shanahan, Costello and Angold2009; Costello, Copeland, & Angold, Reference Costello, Copeland and Angold2011; Costello, Egger, & Angold, Reference Costello, Egger and Angold2005; Kessler, Berglund, Demler, Jin, & Walters, Reference Kessler, Berglund, Demler, Jin, Mericangas and Walters2005), and they could become one of the leading causes of disability in 21st century in European countries (Alonso et al., Reference Alonso, Angermeyer, Bernert, Bruffaerts, Brugha, Bryson and Vollebergh2004). For instance, Alonso et al. (Reference Alonso, Angermeyer, Bernert, Bruffaerts, Brugha, Bryson and Vollebergh2004), found that vital prevalence for any anxiety disorder was 13.6% in a representative sample of 21,425 adults belonging to six European countries. In the replication of the National Comorbidity Survey conducted in the United States (Kessler, Chiu, Demler, & Walters, Reference Kessler, Berglund, Demler, Jin, Mericangas and Walters2005), anxiety disorders were the most prevalent type of disorders (18.1%), followed by mood disorders (9.5%), impulse control disorders (8.9%) and substance use disorders (3.8%). Moreover, the review of Somers, Goldner, Waraich and Hsu (Reference Somers, Goldner, Waraich and Hsu2006), proposed year-prevalence rates and life-prevalence rates of anxiety disorders between 10.6% and 16.6%. Similarly, according to Bloom (Reference Bloom2002), 16% of the population reported anxiety problems. These epidemiological results are even more relevant to the extent that anxiety disorders are risk factors for the onset of the first major depressive disorder (Bittner et al., Reference Bittner, Goodwin, Wittchen, Beesdo, Höfle and Lieb2004). In this sense, Gorwood (Reference Gorwood2004) found that up to 80% of people with generalized anxiety disorders also have a comorbid mood disorder during lifetime. In Spain, the ESEMeD study which evaluated the epidemiology of mental disorders in a sample of Spanish general adult population, found year-prevalence rates for anxiety disorders of 6.2%, higher than depressive disorders (4.3%). Indeed, anxiety disorders with depressive disorders are more prevalent in the Spanish population and are very common in Primary Care consultations, hovering around 18.5% (Cano-Vindel, Reference Cano-Vindel2003).
Among the different perspectives that address the study of anxiety, a recent transdiagnostic approach (Hagenaars, van Minnen, Hoogduin, & Verbraak, Reference Hagenaars, van Minnen, Hoogduin and Verbraak2009) maintains that there is a common neurological pathology in all anxiety disorders, as stipulated in a specific factor of physiological hyperarousal and a general factor of negative affectivity. Negative affectivity in particular would be a tendency to experience a range of feelings or negative emotions such as worry, anxiety, fear, alteration, anger, sadness and guilt (Somers et al., Reference Somers, Goldner, Waraich and Hsu2006). Among the different tools designed to measure any of the many facets that encompassed anxiety disorders stand out among others the Depression Anxiety Stress Scales (DASS: Lovibond & Lovibond, Reference Lovibond and Lovibond1995), the State-Trait Anxiety Inventory (STAI: Spielberger, Gorsuch, & Lushene, Reference Spielberger, Gorsuch and Lushene2008), and the Burns Anxiety Inventory (Burns-A: Burns, Reference Burns1993).
Specifically, the Burns-A, is a self-report instrument developed with the aim to evaluate anxiety symptoms. The Burns-A has 33 items that focus on three anxiety dimensions: 1) Anxious Feelings, 2) Anxious Thoughts, and 3) Physical Symptoms. In addition, there is a total general anxiety score ranging from 0 to 99 with the sum of the items (Sekirnjak & Beal, Reference Sekirnjak and Beal1999). The Burns-A, firstly developed in English, has been translated to different languages including the Spanish form. Different studies have analysed the psychometric properties of the Burns-A scores, confirming an internal consistency of 0.95 and a high correlation with the anxiety subscale of the Symptom Checklist-90-Revised (SCL-90: Derogatis, Reference Derogatis1975). In addition, discriminant validity is comparable to other self-reported anxiety scales frequently used (Burns & Eidelson, Reference Burns and Eidelson1998). Likewise, in the study on the convergent validity, the Burns-A (Burns, Reference Burns1993) was found to correlate significantly with the Beck Anxiety Inventory (Beck & Steer, Reference Beck and Steer1990) and the Zung Self-Assessment Scale of Anxiety (Zung, Reference Zung1971). These results provide evidence for concurrent validity of Burns-A. Moreover, Grossman, Cohen, Goldner, and Jadonath (Reference Grossman, Cohen, Goldner and Jadonath1994) reported that the Burns-A was sensitive in detecting anxiety that occurs with cardiac disease and concluded that the scale is useful in medical and psychiatric settings.
Nevertheless, despite the psychometric properties of the Burns-A have been studied in the English version, we have not found any evidence of the psychometric properties of this measuring instrument in its Spanish version. Hence, the main goal of this study is to examine the psychometric properties of the Burns Anxiety Inventory (Burns-A: Burns, Reference Burns1993) in adult Spanish population. We therefore study: 1) the internal consistency and the test-retest of the Burns-A scores; 2) the internal structure of the Burns-A scores; 3) the relationship between the Burns-A and the STAI (Spielberger et al., Reference Spielberger, Gorsuch and Lushene2008); and 4) the discriminant validity between a clinical and a non-clinical sample.
Method
Participants
The final sample comprised a total of 417 non-clinical and clinical adults. Participants volunteered to take part in the study (convenient samples). Non-clinical sample was composed of 387 adults, 115 were male (29.72%). Participants’ ages ranged from 18 to 72 years (M = 35.47 years; SD = 8.40). Participants belonged to all the Spanish communities, with more participation from La Rioja (30.23%), followed by Catalonia (28.42%), and Madrid (13.96). With regards to the educational level, a 77.26% had university studies, a 16.02% had professional studies, and 4.6% had secondary level. At the moment of the study, 30 participants of the non-clinical sample (7.75%) were taking some type of medication for anxiety. Clinical subsample was composed by 30 participants with a diagnosis of some type of anxiety disorders from the Psychology Centre of Barcelona (BCN), 11 were male (36.7%). The ages of the participant ranged from 21 to 61 years (M = 35.8 years; SD = 12.94). All participants were living in Catalonia. Concerning the educational level in the patient group, 70% reached the university level, 23.33% had professional studies, and 6.6% had secondary level. At the time of research participation, 14 participants of the clinical sample (46.66%) were taking some type of medication for anxiety.
Instruments
Burns Anxiety Inventory (Burns-A: Burns, Reference Burns1993)
The Burns-A is a measuring instrument composed by 33 items that refer to anxiety symptoms. The Burns-A consists of three subscales: Anxious Feelings (six items), Anxious Thoughts (11 items), and Physical Symptoms (16 items). Anxious Feelings are defined like “anxiety, nervousness, fear or worry”, Anxious Thoughts include “difficulties to focus or fear to be alone, isolated from others or to be abandoned”, and Physical Symptoms including “pain, oppression or thoracic constriction” among others. Participants have to respond about how they have experimented or have been worried each symptom in the last days, in a Likert-type respond format with four options (0 = not at all to 3 = a lot). The sum of all items forms the Total Anxiety Score. A score from 0 to 4 show minimum anxiety whereas a score from 55 to 99 indicates extreme anxiety.
State-Trait Anxiety Inventory (STAI) ( Spielberger et al., Reference Spielberger, Gorsuch and Lushene2008)
The STAI Spanish version is a self-reported questionnaire composed by 40 items developed with the aim of evaluating two different types of anxiety: state anxiety (emotional condition transitory), whose reference frame is the “now, at this moment” (20 items), and the anxiety trait (anxiety tendency relatively stable), whose reference frame is “in general, most of the time” (20 items). The STAI has a Likert-type response format with four options (State: “not at all”, “somewhat”, “moderately so”, and “very much so”; Trait: “almost never”, “sometimes”, “often”, and “almost always”). Score in each subscale ranges from 0 to 60. The STAI is widely used for the screening of state anxiety and trait anxiety in non-clinical and clinical populations, being one of the most used among clinical psychologist (Muñiz & Fernández-Hermida, Reference Muñiz and Fernández-Hermida2010). The STAI has been reported to have adequate psychometric properties in its Spanish version with a Cronbach’s Alpha of 0.93 for the Total Score (Fonseca-Pedrero, Paino-Piñeiro, Sierra-Baigrie, Lemos-Giráldez, & Muñiz-Fernández, Reference Fonseca-Pedrero, Paino Piñeiro, Sierra Baigrie, Lemos Giráldez and Muñiz Fernández2012). In addition, evidence for its internal structure has been reported for a three and a four-dimensional structure (Fonseca-Pedrero et al., Reference Fonseca-Pedrero, Paino Piñeiro, Sierra Baigrie, Lemos Giráldez and Muñiz Fernández2012; Guillén-Riquelme & Buela-Casal, Reference Guillén-Riquelme and Buela-Casal2011).
Procedure
Sampling method varied according to each of the subsamples. The non-clinical subsample was obtained through the use of new information and communication technologies. Through different media (social networks, chats and e-mail), collaboration in the study was requested. Socio-demographic data and written consent was collected from every participant and, in addition, all of them were given a code. The clinical sample was composed for 30 participants that at the moment of the study were diagnosed with some anxiety disorder according to the DSM-IV Manual (American Psychiatric Association, 2000). The researcher administered the Burns-A and the STAI to the participants of this subsample in the Psychological Centre of Barcelona. Socio-demographic data and written consent was collected as well in this subsample and every participant was given a code for identification. Participants of the total sample were asked to complete the Burns-A again, 15 days after being administered the questionnaire. In the non-clinical sample, 186 participants completed the retest form, while all participants of the clinical sample completed for the second time the Burns-A. As inclusion criteria for the total sample, participants had to be Spanish and over 18 years. As regards to the non-clinical sample, participants had not to have been diagnosed of any anxiety disorder, whereas for the clinical sample, participant had to have a diagnosis of an anxiety disorder in the Psychology Centre (BCN). This centre is a clinical centre with focus on evaluation, diagnosis and treatment of children, adolescents, and adult population.
Data analysis
First, we calculated descriptive statistics for the subscales and Total Score of the Burns-A. In addition Cronbach’s alpha coefficient was calculated as a measured of the internal consistency of the scores in both subsamples. Also, test-retest reliability was analyzed the in both subsamples.
Second, with the aim of studying the internal structure of the Burns-A, several confirmatory factorial analyses (CFAs) were conducted at the item level. Due to the categorical nature of the data, we used the robust Mean-adjusted Weighted Least Square method (WLSMV) for the estimation of parameters (Muthen & Muthen, 1998-2007). The following goodness-of-fit indices were used: Chi-square (χ2), Comparative Fit Index (CFI), Tucker-Lewis Index (TLI), Root Mean Square Error of Approximation (RMSEA) and Weighted Root Mean Square Residual (WRMR). To achieve a good fit of the data to the model, the values of CFI and TLI should be over 0.95 and the RMSEA and WRMR values should be under 0.08 for a reasonable fit and under 0.05 for a good fit (Brown, Reference Brown2006; Hu & Bentler, Reference Hu and Bentler1999). With the aim to determine wether the compared measurement models are equivalent or not, we selected the ∆CFI criterion proposed by Cheung and Reswold (Reference Cheung and Rensvold2002) and validated by Chen (Reference Chen2007). Hence, when the change in CFI is less than 0.01, it is considered that models are equivalent, whereas a change greater than 0.01 in the CFI indicates the probability of differences between models and changes greater than 0.02 indicates definitely the existence of significant differences.
Third, we studied the sources of validity evidence with other external variables. We analysed the Pearson’s correlation between the Burns-A and the STAI scores. Also, in order to gather new sources of validity evidence, we carried out a MANOVA between the non-clinical and clinical subsamples, taking in consideration the Total Score of the Burns-A and the different subscales. Taking into account the heterogeneity of the subsamples, we randomly selected participants (n = 45) from the non-clinical subsample. The statistical analyses were carried out using the program SPSS 15.0 (Statistical Package for the Social Sciences, 2006) and Mplus 5.2 (Muthen & Muthen, 1998-Reference Muthen and Muthen2007).
Results
Descriptive statistics and reliability
Descriptive statistics of the subscales and the Total Score of the Burns-A in the non-clinical and the clinical subsamples were calculated (see Table 1). In the non-clinical subsample, internal consistency for the Total Score was 0.95 and for the subscales were 0.80 (Anxious Feelings), 0.86 (Anxious Thoughts), and 0.92 (Physical Symptoms). In addition, Cronbach’s alpha was calculated for the clinical subsample: 0.95 for Total Score and 0.79, 0.90, and 0.93 respectively in each of the subscales. Results for the test-retest reliability displayed a significant relation between the means of the Total Scores in the non-clinical subsample with a coefficient of 0.86 (F = 13, 2, p ≤ .001) and in the clinical subsample with a coefficient of 0.95 (F = 36, 5, p ≤ .001). Test-retest correlations for the other subscales can be seen in Table 2.
Table 1. Descriptive statistics of the Burns-A for the non-clinical and the clinical subsamples

Table 2. Test-retest reliability of the Burns-A scores

*All coefficients were statistically significant p ≤ .01.
Confirmatory Factor Analyses
Several confirmatory factor analyses were conducted in order to test the three-dimensional model proposed by Burns (Reference Burns1993) (see Figure 1). For the one dimensional model, the results showed inadequate indexes: χ2 = 487.63; df =104; CFI = 0.87; TLI = 0.96; RMSEA = 0.09; and WRMR = 1.47. For the three dimensional model the results displayed a modest adjust of the model to data, with χ2 = 414.83; df = 104; CFI = 0.89; TLI = 0.96; RMSEA = 0.09; and WRMR = 1.35. Substantial modifications indices (IMs) were found, suggesting the possibility of correlation between items 16 (Fears of criticism or disapproval) and 14 (Fears of looking foolish in front of others); items 17 (Fears that something terrible will happen) and 13 (Fears of illnesses, heart attacks or dying); and items 29 (Feeling dizzy, lightheaded or off balance) and 12 (Fears of fainting or passing out). Correlations between error terms were performed on those items with similar content meaning. Goodness-of-fit indices for the new measurement model were appropriate with χ2 = 326.56; df = 104; CFI = 0.92; TLI = 0.97; RMSEA = 0.07; and WRMR = 1.19. The inclusion of the error terms displayed a change of 0.03 in CFI, indicating the improvement of the model with the inclusion of the error terms. Standardized factor loadings for the three factor model ranged between 0.32 of item 14 (Fears of looking foolish in front of others) belonging to the Anxious Thoughts subscale and 0.77 of item 27 (Trembling or shaking) of the Physical Symptoms subscale (see Table 3). All standardized loadings were statistically significant (p < .01). Correlation between the latent dimensions of the hypothetical three-dimensional model ranged between 0.40 (Anxious Thoughts and Anxious Feelings) (p < .01) and 0.50 (Anxious Feelings and Physical Symptoms) (p < .01).

Figure 1. Path diagram of the confirmatory factor analysis.
Table 3. Standardized factor loadings for the final three factor model
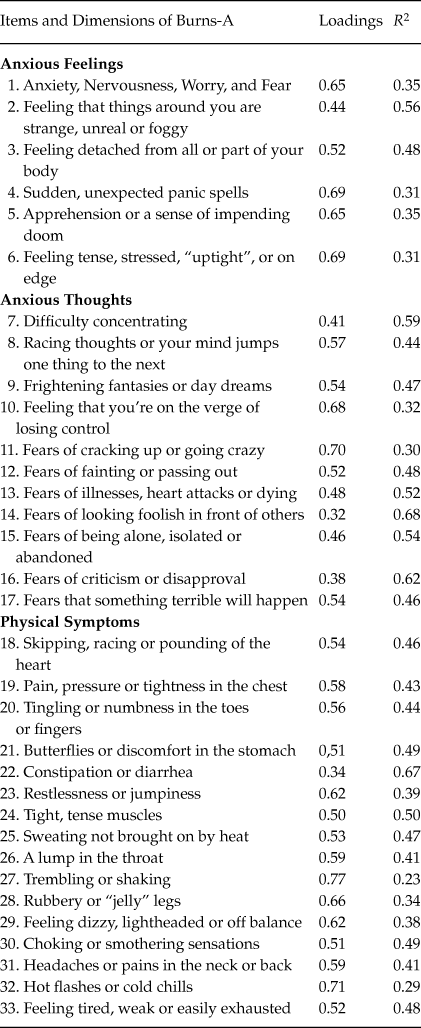
R2: Proportion of explained variance.
Sources of validity evidence
Table 4 shows the Pearson’s correlation between Burns-A subscales and Total Score and the Anxiety-Trait and Anxiety-State subscales from the STAI. As it is shown in Table 4, all of the associations between scores were statistically significant. In order to gather evidence of discriminant validity, we compared clinical and non-clinical subsamples through analysis of the variance. Results showed statistically significant differences in the means scores between the subsamples in the subscales Anxious Feelings (F = 44, 9; df = 74; p ≤ .001; partial η² = 0.38), Anxious Thoughts (F = 24, 5; df = 74; p ≤ .001; partial η² = 0.25), Physical Symptoms (F = 28, 2; df = 74; p ≤ .001; partial η² = 0.28) and in the Total Score (F = 35, 2; df = 74; p ≤ .001; partial η² = 0.33) (see Table 5).
Table 4. Pearson’s correlations between Burns-A and STAI
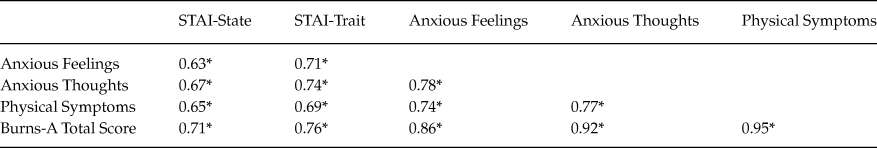
*All the correlations were statistically significant p ≤ .01.
Table 5. Mean scores comparisons between non-clinical and clinical subsamples
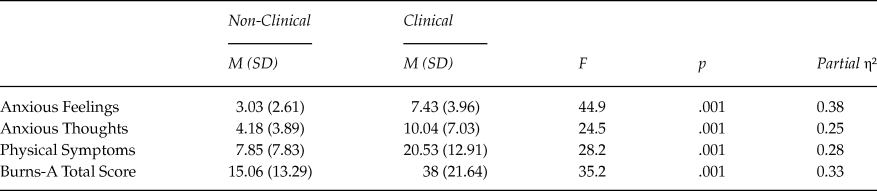
Note: η² = eta square.
Discussion and conclusions
The main purpose of the study was to analyze the psychometric quality of the Spanish version of the Burns Anxiety Inventory (Burns-A: Burns, Reference Burns1993). We thus examined the internal structure of Burns-A, estimated the reliability of the scores and obtained different sources of validity evidence. This objective provided information on the psychometric properties of the Burns-A (Spanish version) in order to use it as a screening instrument in Spanish-speaking adult populations. Results found in the study indicate that the Burns-A has adequate psychometric properties and, therefore that it is a useful instrument that could be used to evaluate anxiety symptoms.
Internal consistency for the subscales and for the total score were all over 0.79. These results are similar to those found in previous studies (Sekirnjak, Reference Sekirnjak1998). Regarding the test-retest reliability analysis, ICC were adequate, indicating a good stability of the instrument, both in the non-clinical and the clinical subsamples.
Analysis of the internal structure underlying the items allowed to support the initial three-dimensional model. Nevertheless, goodness-of-fit indices were modest and revealed the presence of different modification indices. In order to determine wether the compared models are equivalent or not, we selected the ∆CFI criterion proposed by Cheung and Reswold (Reference Cheung and Rensvold2002) and validated by Chen (Reference Chen2007). In the analysis, the inclusion of the error terms revealed a change of 0.03, indicating the improvement of the measurement model with the inclusion of the error terms and the necessity to control the existence of items with similar content that could affect to the factorial structure of the measuring instrument.
Results from the analysis of the sources of validity evidence with other variables yielded a significant association between Burns-A scores and the scores of the State-Trait Anxiety Inventory (STAI: Spielberger et al., Reference Spielberger, Gorsuch and Lushene2008) in all the subscales and in the Total Score. These results support the validity of the Burns-A (Spanish version) with other external variables and are consistent with previous studies (Rabenhorst, Reference Rabenhorst2000; Sekirnjak, Reference Sekirnjak1998; Sekirnjak & Beal, Reference Sekirnjak and Beal1999) that showed evidence for the validity of the Burns-A with other external sources such as the Burns Depression Checklist, the Symptom Checklist (anxiety subscale), the Self-Rating Anxiety Scale (Zung, Reference Zung1971), the Beck Anxiety Inventory (Beck & Steer, Reference Beck and Steer1990), and the Profile of Mood States tension/anxiety scale (McNair, Lorr, & Droppleman, 1971-Reference McNair, Lorr and Droppleman1981). It should be mentioned that even though the Burns-A is supposed to measure state anxiety, a higher correlation has been found, in the present study, between the STAI-Trait and the Burns-A rather than between the STAI-State and the Burns-A. That could mean that the Burns-A may be an instrument that allows to measure anxiety traits as well as anxiety states. Anxiety traits and states have been related, in different studies with psychological problems such as depression (López-Ibor, Reference López-Ibor2007). In this sense, screening of anxiety traits in each of the dimensions of the Burns-A could be relevant for the early detection in order to avoid psychological disorders that become permanent. In addition, results of the present study related to the sources of discriminant validity, permit to assure, according to previous studies (Sekirnjak & Beal, Reference Sekirnjak and Beal1999), the goodness of the Burn-A to distinguish between clinical and non-clinical samples.
The results of the present study should be interpreted in the light of the following limitations. First of all, there is an inherent issue in the administration of every type of self-reported instrument, with the very well-known effect of stigmatization, the possibility of misunderstanding of some items or the lack of introspection of some participants, and the social desirability. For these reasons, it would have been relevant to use external sources of information via hetero-informs or structured interviews. Second, we did not use a scale in order to assure the infrequency in the response, what would have allowed eliminating those participants that displayed random answers. Third, in order to study the sources of convergent validity we only used the STAI that in fact evaluates the same anxiety problematic. Regarding this, the use of other instruments that measure other types of psychological problems like, for instance, depression would have been worthy. Fourth, we have studied adult populations across the country with only specification for people over 18 years of age. As a result, the age range was large and the results cannot be extrapolated to a specific age group. Finally, we did not make any statistical analysis to study the response distribution of the items attending different relevant variables like gender or age. The inclusion of Differential Item Functioning and the Measurement Invariance analysis are advised with the aim to compare scores in different groups.
In conclusion, data obtained in the present study presented evidence supporting the psychometric properties of the Burns-A scores (Spanish version). Measurement instruments that allow evaluating psychological signs and symptoms such as anxiety are useful for detection of individuals at risk to transit to more severe and permanent problems. The Burns-A is an inventory designed to measure anxiety; however, it may be relevant for future studies to determine whether a shorter form of the questionnaire could be derived. That would be an added value in comparison with other anxiety instruments such as the STAI. The use of short instruments increases participants’ satisfaction and at the same time saves time for the researchers. Future studies should try to establish specific cut-points, and may try to follow up those individuals with high scores in this type of self-reported instruments in order to establish the sensitivity and specifity. In addition, future studies should investigate the measurement invariance attending to relevant variables like gender, culture or age.


